
Impact Modifier Market Size and Share
Market Overview
| Study Period | 2021 - 2031 |
|---|---|
| Market Size (2026) | USD 4.88 Billion |
| Market Size (2031) | USD 6.63 Billion |
| Growth Rate (2026 - 2031) | 6.31 % |
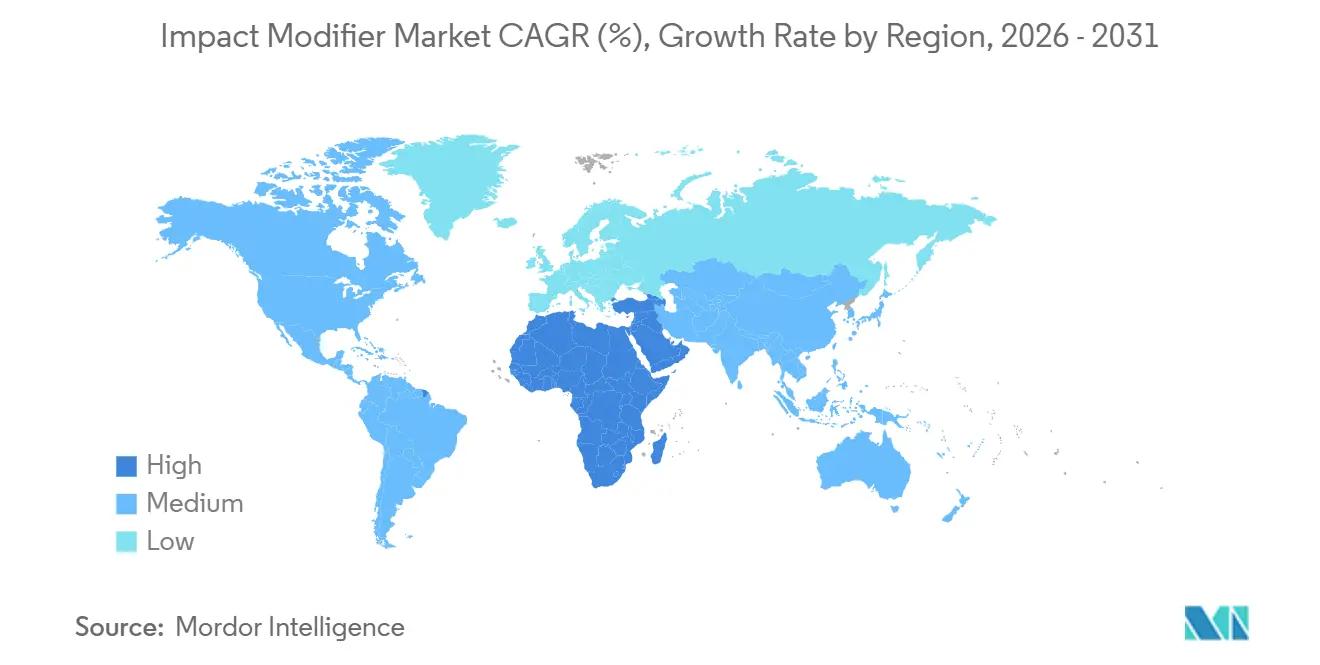
| Fastest Growing Market | Middle East and Africa |
| Largest Market | Asia Pacific |
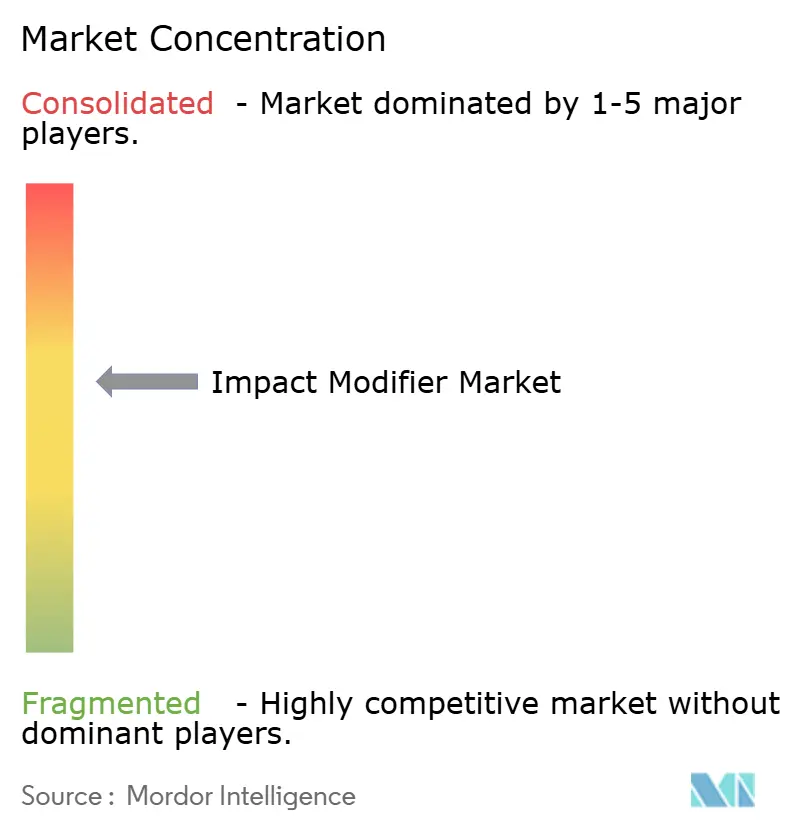
| Market Concentration | Medium |
Major Players *Disclaimer: Major Players sorted in no particular order Image © Mordor Intelligence. Reuse requires attribution under CC BY 4.0. | |
Impact Modifier Market Analysis by Mordor Intelligence
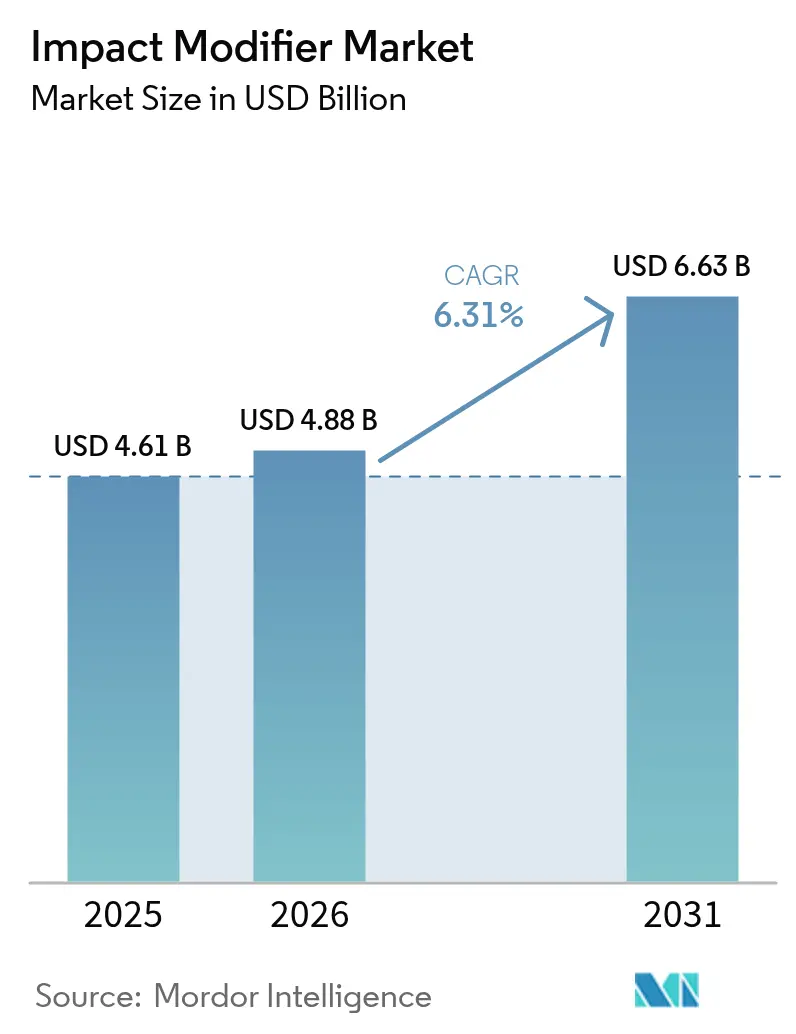
The Impact Modifier Market size is projected to expand from USD 4.61 billion in 2025 and USD 4.88 billion in 2026 to USD 6.63 billion by 2031, registering a CAGR of 6.31% between 2026 to 2031. Polyvinyl chloride (PVC) pipe networks are replacing aging metal infrastructure across emerging economies, while automotive original equipment manufacturers (OEMs) keep substituting steel with polymer composites to meet the 2027 U.S. fuel-economy target of 49 miles per gallon. In parallel, the European Union requires 30% recycled content in rigid plastic packaging by 2030, accelerating demand for compatibilizer-rich acrylic grades. Acrylonitrile butadiene styrene (ABS) led with 33.48% revenue share in 2025, yet acrylic impact modifiers are expanding faster because they enable transparent PVC window profiles that pass ISO 9227 salt-spray tests without yellowing.
Key Report Takeaways
- By type, Acrylonitrile Butadiene Styrene (ABS) held 33.48% of the impact modifier market share in 2025; Acrylic Impact Modifiers (AIM) are forecast to expand at a 6.42% CAGR through 2031.
- By application, Polyvinyl Chloride (PVC) captured 42.67% of the impact modifier market share in 2025. However, the growth of engineering plastics is expected to be at a CAGR of 6.63% during the forecast period (2026-2031).
- By end-user, construction led with 36.54% revenue share in 2025; automotive is projected to record the highest 6.45% CAGR to 2031.
- By geography, Asia-Pacific commanded a 47.26% share in 2025, while the Middle East & Africa region is poised for the fastest 6.58% CAGR through 2031.
Note: Market size and forecast figures in this report are generated using Mordor Intelligence’s proprietary estimation framework, updated with the latest available data and insights as of 2026.
Market Trends and Insights
Drivers Impact Analysis of Impact Modifier Market*
| Driver | (~) % Impact on CAGR Forecast | Geographic Relevance | Impact Timeline |
|---|---|---|---|
| Growing packaging demand | +1.2% | Global, concentrated in APAC and North America | Medium term (2-4 years) |
| PVC pipe & profile boom | +1.5% | India, China, ASEAN; spill-over to MEA and South America | Long term (≥4 years) |
| Construction-led resin uptake in APAC | +1.3% | China, India, ASEAN; Saudi Arabia, UAE | Long term (≥4 years) |
| Automotive lightweighting & safety focus | +0.9% | North America, Europe, Japan, South Korea | Medium term (2-4 years) |
| Recycled-content plastics need hybrids | +0.8% | Europe, North America, early urban APAC | Short term (≤2 years) |
| Source: Mordor Intelligence | |||
Growing Packaging Demand
Global e-commerce has tightened package-drop durability standards, lifting impact-modified resin offtake for rigid clamshells and tubs by 7.2% year over year in 2025[1]. Acrylic grades permit clear PET trays to retain transparency after repeated freeze–thaw cycles, a performance essential for North American meal-kit services that expanded 22% in 2025. Reusable-container legislation in 89 countries channels demand toward ethylene-propylene-diene-monomer (EPDM) modifiers that withstand 500 dish-washer cycles at 75°C. Food-contact rules published by the U.S. FDA in 2025 cap residual acrylate monomers at 50 parts per billion, prompting producers to adopt super-critical CO₂ extraction that raises manufacturing cost by USD 0.18 per kilogram. Larger producers with in-house extraction systems are therefore capturing share from contract blenders unable to absorb the added expense.
PVC Pipe & Profile Boom
Municipal programs across India, Indonesia and Vietnam accelerated the switch from galvanized iron to PVC, citing installed costs of USD 42 per meter for PVC versus USD 68 for ductile iron and a 50-year service-life guarantee. Chlorinated polyethylene (CPE) modifiers captured 62% of the pressure-pipe segment in 2025 because they retain weld-line strength above 85% of base-resin values, enabling joints to pass ISO 13953 hydrostatic tests at 2.5 MPa[2]. China’s 14th Five-Year Plan earmarked CNY 4.8 trillion (USD 670 billion) for urban water networks, absorbing 780,000 metric tons of impact-modified PVC in 2025. In Europe, triple-glazed PVC window profiles satisfying the Passive House 0.8 W/m²K standard consumed 290,000 metric tons of acrylonitrile-styrene-acrylate (ASA) in 2025. Certification under the EU Construction Products Regulation 2024 lifted third-party testing expenditure by EUR 0.09 per kilogram, favoring vertically integrated compounders able to amortize the added cost.
Construction-Led Resin Uptake in APAC
Ongoing megaprojects such as Indonesia’s Nusantara capital city and India’s Pradhan Mantri Awas Yojana collectively added 2.3 million metric tons of impact-modified polymers to regional demand in 2025. Methacrylate-butadiene-styrene (MBS) grades dominate exterior cladding because they pass ASTM D256 impact tests at –40 °C, a benchmark for northern China and South Korea. High humidity and 45 °C ambient temperatures along Southeast Asian rail corridors require UV-stabilized acrylic modifiers that cost USD 0.31 per kilogram more than conventional variants. ASEAN’s infrastructure funding shortfall of USD 210 billion per year through 2030 is therefore a sustained pull-through for durable PVC conduit and siding. From 2025, Japan, South Korea and Singapore made ISO 4892-2 xenon-arc weathering mandatory for exterior parts, boosting demand for premium light-stable chemistries.
Automotive Lightweighting & Safety Focus
Battery-electric vehicle (BEV) production reached 14.2 million units in 2025, each requiring 38 kilograms of impact-modified engineering plastics for battery enclosures and structural trim, 12 kilograms more than internal-combustion counterparts. The 2024 Corporate Average Fuel Economy final rule creates a 6.2% vehicle fuel-economy gain when 18 kilograms of steel are swapped for glass-fiber-reinforced nylon blended with 8-12% impact modifiers. Insurance Institute for Highway Safety protocols updated in 2025 demand 15% higher side-impact energy absorption, accelerating the use of core-shell acrylic modifiers that treble polybutylene-terephthalate (PBT) toughness while adding only 3% weight. Transparent interior bezels are shifting from ABS to acrylic modifiers able to survive 50,000 thermal cycles between –30°C and 80°C without hazing. Tier-1 suppliers in Germany and Japan filed 47 patents during 2024-2025 for modifiers compatible with carbon-fiber-reinforced thermoplastics, targeting mass-production BEV battery cases by 2027.
Restraints Impact Analysis of Impact Modifier Market*
| Restraint | (~) % Impact on CAGR Forecast | Geographic Relevance | Impact Timeline |
|---|---|---|---|
| Raw-material price volatility | –0.6% | Global, acute in Asian spot markets | Short term (≤2 years) |
| Tightening VOC & PVC regulations | –0.4% | Europe, North America, tier-1 Chinese cities, Japan, Korea | Medium term (2-4 years) |
| Processing issues with high-recycle streams | –0.3% | Europe, North America, early-stage urban APAC | Short term (≤2 years) |
| Source: Mordor Intelligence | |||
Raw-Material Price Volatility
Styrene spot prices swung between USD 950 per metric ton in January 2025 and USD 1,280 in September, a 35% intra-year spread triggered by Asian cracker outages and derivative-demand dips. Butadiene touched USD 1,520 per metric ton in Q4 2025 as U.S. Gulf Coast crackers favored ethane feedstocks that yield 40% less butadiene per ton of ethylene. Non-integrated compounders lacking long-term monomer contracts absorbed USD 0.41 per kilogram cost upticks, yet downstream PVC-pipe extruders kept pass-through below 3% because public tenders in India cap annual escalation at inflation plus one point. Vertically integrated producers representing 38% of global capacity preserved margins by internalizing feedstock swings, widening the competitive gap.
Tightening VOC & PVC Regulations
China’s 2024 update to GB 18581 sliced permissible VOC emissions from polymer plants to 50 milligrams per cubic meter, compelling 34% of Shandong and Jiangsu facilities to install thermal oxidizers costing as much as USD 2.8 million per line. The European Chemicals Agency added four phthalate plasticizers to REACH Annex XIV in 2025, nudging converters toward higher-cost non-phthalate impact modifiers. California’s Safer Consumer Products rule, effective 2025, classified styrene-containing additives used in rigid food packaging as Priority Products, elongating development cycles by up to two years. India’s proposed ban on single-use PVC packaging by 2028 creates demand uncertainty for modifiers tailored to flexible-film markets. Across Europe, ISO 16000-6 indoor-air-quality certification fees rose to EUR 8,500 per formulation, deterring small entrants.
*Our forecasts treat driver/restraint impacts as directional, not additive. The impact forecasts reflect baseline growth, mix effects, and variable interactions.
Impact Modifier Market Segment Analysis
By Type:
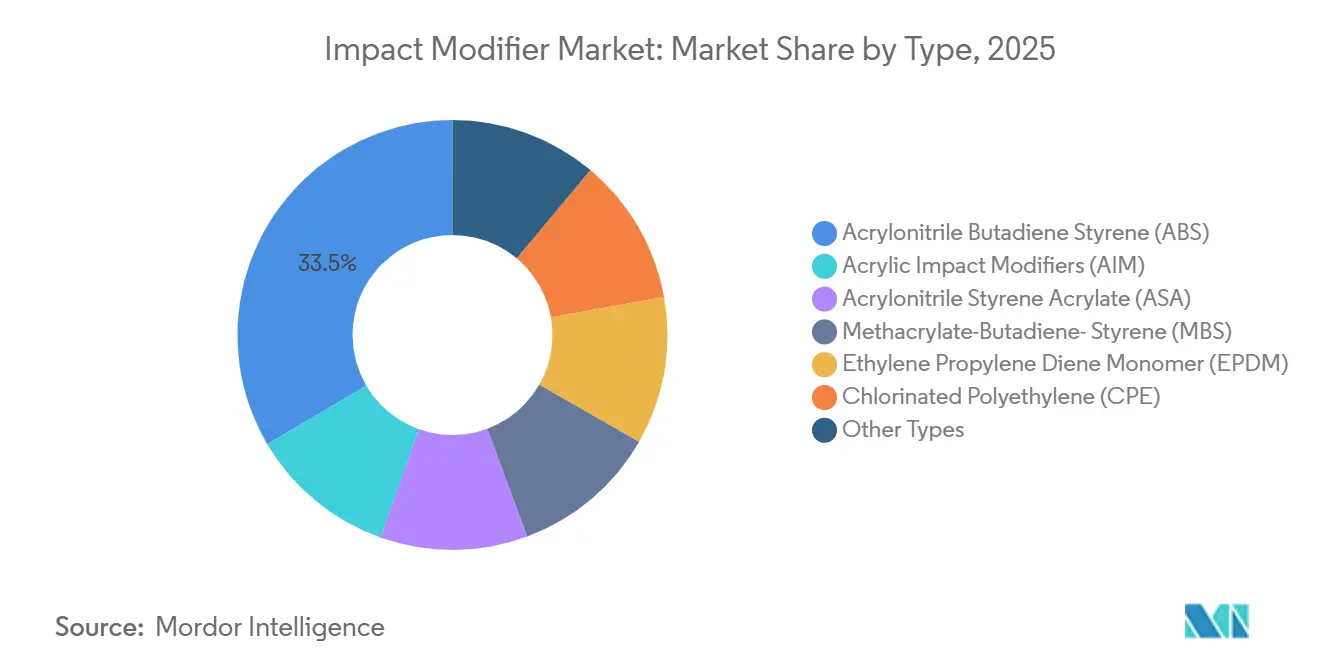
ABS Retains Lead while Acrylic Grades AccelerateABS commanded 33.48% of the impact modifiers market in 2025 on the back of cost-effective toughness for appliance housings and automotive interiors. Within this segment, ABS contributed USD 1.54 billion to the impact modifiers market size, reflecting broad acceptance where opaque finishes and 15 kJ/m² notched Izod impact strength are sufficient. Acrylic grades, though smaller, are growing at 6.42% CAGR because transparent PVC window profiles and PET clamshells demand weather-stable clarity after 500-hour QUV exposure. MBS occupied 22% of rigid-PVC pipe consumption in 2025 but faces price pressure as Chinese exporters undercut European equivalents by 14%.
Acrylonitrile-styrene-acrylate (ASA) expands for outdoor siding and automotive exterior panels where –30°C impact retention and UV durability are decisive. CPE secured a share owing to its ability to maintain ductility at 2.5 MPa hydrostatic stress for potable-water pipes. EPDM remains niche, yet its dishwasher-cycle endurance aligns with reusable-container mandates. Maleic-anhydride-grafted acrylic variants launched in 2025 now reclaim 92% of virgin toughness in PCR PVC, attracting a USD 0.90 per kilogram premium over standard grades.

By Application:
PVC Dominates, Engineering Plastics SurgePVC represented 42.67% of the impact modifiers market share in 2025, equivalent to USD 2.07 billion of the impact modifiers market size, with rigid pipes accounting for 58% of PVC demand. Engineering plastics, however, are forecast to grow at a 6.63% CAGR through 2031 as BEV battery packs require flame-retardant nylon housings that keep impact strength above 25 kJ/m² at 150°C. Glass-fiber-reinforced PA 66 blended with 9-13% modifiers is displacing steel in structural battery trays, shaving 18% mass.
Polybutylene-terephthalate (PBT) applications advanced in 2025, driven by autonomous-vehicle sensor housings that demand dimensional stability at 150°C. Polycarbonate blends for consumer electronics and safety glazing filled 14% of overall volume, posting growth as laptop makers adopted PC/ABS alloys that pass 1.2-meter drop tests. California’s styrene-additive scrutiny is restraining new PVC film grades, whereas IIHS side-impact revisions propel acrylic-modified PBT adoption.
By End-User Industry:
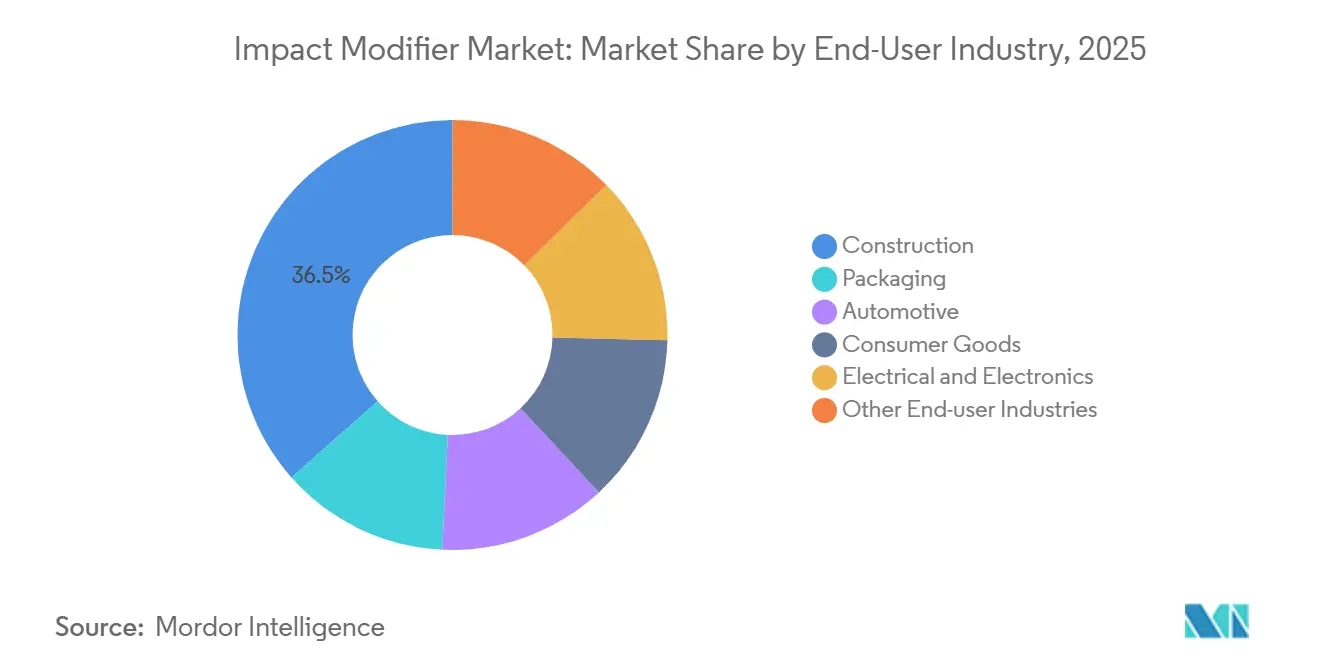
Construction Anchors, Automotive AcceleratesConstruction absorbed 36.54% of revenue in 2025, lifted by India’s household-water push and Southeast Asian housing booms. Each completed rural home in India incorporated 42 kilograms of impact-modified PVC conduit and plumbing as of 2025. Automotive is projected to log the steepest 6.45% CAGR because BEVs need 15% more impact-modified polymers than internal-combustion vehicles to protect lithium-ion cells from side-impact intrusion.
Consumer goods grew as reusable-container standards proliferated, demanding three-to-five-fold higher impact strength than single-use versions. Electrical and electronics applications share was centered on cable trays and junction boxes certified to UL 746C for 125°C thermal aging.
Geography Analysis
APAC Impact Modifier Market
Asia-Pacific controlled 47.26% of the impact modifiers market in 2025 and will compound at 6.35% through 2031. China alone produced 6.8 million metric tons of PVC pipes for Belt-and-Road projects, while India’s affordable-housing scheme consumed 470,000 metric tons of impact-modified PVC conduit. ASEAN nations placed 12,400 kilometers of rural water pipelines in 2025, with Vietnam and Thailand leading installations. Japan and South Korea filed 47 patents for carbon-fiber-compatible modifiers targeting mass-production BEV battery enclosures from 2027. Regulatory tightening under GB 18581 forced over one-third of Chinese modifier plants to install VOC oxidizers, consolidating capacity among integrated majors.
North America Impact Modifier Market
North America’s share expanded as the US EPA fuel-economy rule accelerated steel-to-polymer substitution. Canada upgraded potable-water systems, while Mexico’s USD 18 billion automotive near-shoring boom widened engineering-plastic demand. California’s Safer Consumer Products framework introduced additional testing layers for styrene-based additives, momentarily delaying rigid-packaging launches.
Europe Impact Modifier Market
Europe faces margin pressure from ECHA’s 2025 phthalate restrictions and the 30% PCR requirement under the Packaging and Packaging Waste Regulation. Germany, France and Italy jointly absorbed the majority of regional volumes, predominantly window-profile extrusion that must meet the Passive House 0.8 W/m² K threshold.
MEA and South America Impact Modifier Market
South America represented the lowest demand, with Brazil’s 7.8 million-unit housing shortfall fueling PVC uptake, and Argentina’s lithium operations specifying impact-modified liners for evaporation ponds. The Middle East and Africa are forecast to post the quickest CAGR as Saudi Arabia’s USD 3.2 trillion Vision 2030 pipeline specifies impact-modified polymers for 1.5 million homes and 8,500 kilometers of roads. Differential standards persist: SASO allows 120 mg/kg residual styrene versus the EU cap of 100 mg/kg, enabling Gulf producers to underprice European exporters by up to 12% for non-food applications.
Regulatory Landscape
Regulation is tightening around emissions, chemical content, and plastics handling, raising compliance and documentation demands for impact modifiers used in PVC, packaging, and engineering plastics. In China, the 2024 update to GB 18581 reduced permissible VOC emissions from polymer plants to 50 mg/m3, pushing many facilities in provinces such as Shandong and Jiangsu to install abatement systems and favoring integrated producers that can absorb capex and operating costs.
In the European Union, packaging and building-product compliance is shaping additive selection and testing. The EU Construction Products Regulation 2024 increased third-party testing for construction-linked PVC profiles, while REACH actions in 2025-2026 (including additional phthalate scrutiny and SVHC-related updates) are nudging converters toward non-phthalate solutions and tighter substance-management. In the United States, EPA activity under TSCA, including the December 2025 final risk evaluation for DEHP identifying unreasonable risks to workers, is increasing the need for reformulation, stewardship, and traceability programs in styrene- and plasticizer-adjacent value chains.
Value Chain Analysis
The value chain begins with upstream petrochemical feedstocks (styrene, butadiene, acrylates, methyl methacrylate, and polyethylene for chlorination) that are converted into modifier chemistries such as ABS-based modifiers, acrylic impact modifiers (AIM), MBS, ASA, CPE, and EPDM. These are produced by large integrated chemical groups and specialty additive suppliers (including industry leaders such as Arkema, Dow, Kaneka, LG Chem, and BASF), then sold as pellets or powders to compounders and directly to resin processors. Downstream, impact modifiers are incorporated into PVC (pipes, fittings, window profiles), packaging (rigid tubs, clamshells), and engineering plastics for automotive and electrical and electronics, where compound formulation and processing know-how are key differentiators.
Midstream formulation, QA/testing (ISO/ASTM/UL-linked performance and emissions), and regional distribution shape time-to-market and customer qualification cycles. Volatility in key monomers and energy costs can compress margins for non-integrated blenders, while integrated producers with captive feedstocks and larger compliance infrastructure preserve continuity. Capacity localization is also visible, for example Evonik localized the final production step of its POLYVEST ST-E 60 silane-functionalized polybutadienes in Shanghai (June 2025), supporting shorter lead times and supply security for Asia-based converters.
Competitive Landscape
The Impact Modifier market is moderately concentrated. Vertically integrated players with captive styrene and acrylate monomer lines maintained 6-8 percentage-point gross-margin cushions during 2025’s 35% styrene swing. Technology adoption is bifurcated. Integrated majors employ AI-enabled rheology controls that cut off-spec waste by up to 55%. Growth white-spaces cluster in bio-based acrylic monomers, plasma-oxidation pretreatment for recyclate, and core-shell architectures that treble toughness at minimal weight penalty.
Impact Modifier Industry Leaders
-
Arkema
-
Dow
-
Kaneka Corporation
-
LG Chem
-
BASF
- *Disclaimer: Major Players sorted in no particular order
Impact Modifier Market Companies Covered in this Report
- Arkema
- BASF
- SI Group, Inc.
- Akdeniz Kimya
- CLARIANT
- Dow
- Evonik Industries
- Formosa Plastics Corporation
- INEOS Styrolution Group GmbH
- Kaneka Corporation
- LANXESS
- LG Chem
- Mitsubishi Chemical Corporation
- Shandong Novista Chemicals Co.,Ltd.
- Plastics Color Corporation
- Shandong Ruifeng Chemical Cp.Ltd
- SONGWON
- Sundow Polymers Co., Ltd.
- Wacker Chemie AG
Market Opportunities and Future Outlook
Recycled-content mandates and tighter chemical and VOC requirements are creating whitespace for compatibilizer-rich acrylic and hybrid systems that restore toughness in PCR-containing PVC and packaging resins while meeting indoor-air-quality and food-contact constraints. The EU requirement for 30% recycled content in rigid plastic packaging by 2030 is a concrete pull for impact-modifier packages that maintain clarity and toughness in higher-variability recyclate streams, supporting premiumization where converters need consistent performance and certification-ready documentation.
Cold-climate durability and high-energy absorption use cases are also opening targeted product and R&D lanes. In May 2026, Zibo Yixing released an MBS grade (MBS-156) positioned for sub-zero PVC performance (down to about -20 C), aligning with outdoor construction profiles, cold-chain packaging, and pipe applications in colder regions that demand impact retention. On the technology front, mechanophore-based polymer design research published by MITs Kulik Research Group in 2026 highlighted pathways to materially increase energy dissipation at high strain rates, providing a longer-horizon route for next-generation modifier architectures in automotive safety and other high-impact engineering plastics applications.
Recent Industry Developments in Impact Modifier Market
- May 2026: Kaneka Corporation announced an additional price increase for its Kane Ace impact modifiers (including Kane Ace B, Kane Ace M, and Kane Ace FM), as well as processing aids and heat resistance resins, for shipments effective June 1, 2026. The move cited higher raw material and energy costs linked to Middle East instability, reinforcing pricing discipline and signaling continued cost pressure for downstream PVC and engineering-plastics compounders.
- December 2025: Arkema announced a proposed divestment of its global MBS impact modifier business and its European and Asian acrylic copolymer (AIMPA) impact modifier business to the Indian group Praana. The portfolio action, including the Vlissingen site in the Netherlands while retaining the Mobile, Alabama plant and American AIMPA activities, reshapes competitive positioning and supply options for PVC and packaging customers across regions.
- July 2024: Kaneka Corporation announced a price revision for its impact modifiers, including Kane Ace B, Kane Ace M, and Kane Ace FM. The adjustment aimed at improving profitability and supporting stable supply, with knock-on effects for procurement and formulation cost management across PVC processing and related end-use segments.
Impact Modifier Market Report Scope and Research Methodology
Market Definition and Coverage
For this study, the impact modifier market is defined as the value of polymer additives that are blended into plastics to improve toughness and impact resistance during compounding and processing, across major end-use industries and regions.
Scope exclusions: We exclude non-impact performance additives (such as fillers, plasticizers, stabilizers, and colorants) unless they are sold and used primarily as impact modifiers.
Segments Covered in This Report
- By Type
- Acrylonitrile Butadiene Styrene (ABS)
- Acrylic Impact Modifiers (AIM)
- Acrylonitrile Styrene Acrylate (ASA)
- Methacrylate-Butadiene- Styrene (MBS)
- Ethylene Propylene Diene Monomer (EPDM)
- Chlorinated Polyethylene (CPE)
- Other Types
- By Application
- Polyvinyl Chloride (PVC)
- Nylon
- Polybutylene Terephthalate (PBT)
- Engineering Plastics
- Other Applications
- By End-user Industry
- Packaging
- Construction
- Automotive
- Consumer Goods
- Electrical and Electronics
- Other End-user Industries
- By Geography
- Asia-Pacific
- China
- India
- Japan
- South Korea
- ASEAN Countries
- Rest of Asia-Pacific
- North America
- United States
- Canada
- Mexico
- Europe
- Germany
- United Kingdom
- France
- Spain
- Italy
- Russia
- NORDIC Countries
- Rest of Europe
- South America
- Brazil
- Argentina
- Rest of South America
- Middle-East and Africa
- Saudi Arabia
- South Africa
- Rest of Middle-East and Africa
- Asia-Pacific
Data Sources, Market Sizing, and Validation
Desk Research
Desk research set the starting structure for the market model, particularly around where impact modifiers are consumed and what drives volumes in plastics conversion. We referenced public sources such as USITC trade statistics, UN Comtrade, Eurostat, and national statistical agencies, and we also used polymer and plastics associations for demand indicators and application trends.
To keep assumptions realistic, we reviewed company annual reports and investor presentations for portfolio mix cues and regional exposure, and we checked reputed press coverage for capacity changes and pricing pressure. In a few places, paid subscriptions that track company financials and patent databases were used to validate product families and to reduce the risk of double counting similar modifier chemistries sold under different names. The sources listed here are illustrative only, and many other public documents and datasets were used for cross-checking, clarification, and validation.
Primary Interviews and Surveys
Primary work was used to pressure-test the desk assumptions on where impact modifiers are most used, how suppliers describe their sell-in by polymer application (like PVC and engineering plastics), and how pricing is typically reset through the year. We spoke with a mix of manufacturers, distributors, compounders, and large converters across the main consuming regions, so gaps in application split and near-term demand signals could be closed before finalizing the model.
Distribution of primary research fieldwork respondents
| Company type | Respondent position | Region |
|---|---|---|
| Top tier: 27% | CXOs: 13% | APAC: 45% |
| Mid tier: 58% | Functional/Unit leaders: 38% | EMEA: 34% |
| Smaller Players: 15% | Managers: 49% | Americas: 21% |
Market-Sizing & Forecasting
Sizing starts from a top-down demand pool build that connects plastics conversion activity to impact modifier usage in key applications, and then scales it across regions using trade and production signals. In practice, we map consumption around polymer families and downstream uses where modifiers are common, and the totals are subsequently checked against supplier-side approximations.
The model uses a small set of inputs that can be explained and repeated, such as PVC pipe and profile output trends, engineering plastics consumption in automotive and consumer goods, typical modifier loading rates for targeted performance, average selling price ranges by chemistry, and regional import-export movement that indicates supply gaps. Where primary feedback suggested that loading rates or application splits vary by geography, those parameters were adjusted and documented before being rolled into the final view.
For forecasting, scenario analysis is used around construction activity, vehicle production mix, and packaging demand, since these are the end markets that most often swing volume and pricing. Results are corroborated through selective bottom-up checks like sampled ASP multiplied by estimated volumes for a few major chemistries, and channel checks on tightness in supply, and then gaps are filled conservatively when supplier coverage is incomplete.
Data Validation & Update Cycle
Validation is done by comparing the outputs against independent signals, such as regional plastics processing indicators, major capacity additions, and observable trade flows, and then investigating any large variance before sign-off. If a region shows a jump that cannot be explained by construction, automotive, or packaging activity, we revisit the assumptions and, when needed, re-contact interviewees to confirm whether it is a temporary pricing swing or a real demand shift.
Before publication, the model goes through multi-step internal reviews where calculations, conversions, and scope logic are checked for consistency across years and regions. Reports are refreshed annually, and interim updates are made when material events occur, such as a large plant start-up, a major trade disruption, or a sharp feedstock-driven price reset. Right before delivery, a fresh analyst pass is completed so clients receive the latest updated view.
Mordor Intelligence's Impact Modifier Market Size Compared Against Other Published Estimates
Published market values for impact modifiers can look far apart because the scope lines are not always drawn the same way, and the price and volume assumptions are updated at different times. Differences also come from whether the estimate is tied to a clear demand pool (plastics processing and application use) or is mainly built from broad chemicals spending ratios.
The table shows a clear spread around the 2025 value, and in Mordor Intelligence's model the total reflects impact modifier revenues across the listed modifier chemistries and plastics applications, with application-level usage checks used to avoid folding in adjacent additive categories that are not sold as impact modifiers.
Benchmark comparison
| Source | Market Size | Gaps in Research Methodology |
|---|---|---|
| Mordor Intelligence | USD 4.61 B (2025) | |
| Global Consultancy A | USD 3.86 B (2025) | This estimate appears to lean more heavily on a narrower set of end-use applications and may apply conservative loading-rate assumptions for PVC and engineering plastics, which can compress the 2025 total. |
| Industry Publisher B | USD 4.05 B (2024) | The year differs and the revenue line may be based on earlier price points, and some application splits are reported using mixed volume and revenue views, which can shift the conversion to a single USD value. |
Reading the table together, the differences mostly trace back to what gets counted as an impact modifier versus a neighboring additive, plus how pricing is timed and carried forward into the base year. Our approach stays traceable because it is tied to plastics processing indicators, loading-rate logic, and repeatable ASP assumptions that can be checked and updated as market conditions change.
Key Questions Answered in the Report
What CAGR is projected for the impact modifiers market through 2031?
A 6.31% CAGR is forecast for 2026-2031, lifting value to USD 6.63 billion.
Which polymer type leads current demand?
ABS leads with 33.48% share, mainly in automotive interiors and appliances.
Why are acrylic impact modifiers growing fastest?
They enable transparent, weather-stable PVC and PET applications and comply with tougher recycled-content rules.
Which end-user segment will expand most rapidly?
Automotive is set for a 6.45% CAGR as BEVs require more impact-modified engineering plastics.
Which region offers the highest incremental opportunity?
Asia-Pacific remains largest, but the Middle East and Africa show the quickest growth at 6.58% CAGR under Vision 2030 infrastructure programs.