
Immunotherapy Drugs Market Size and Share
Market Overview
| Study Period | 2020 - 2031 |
|---|---|
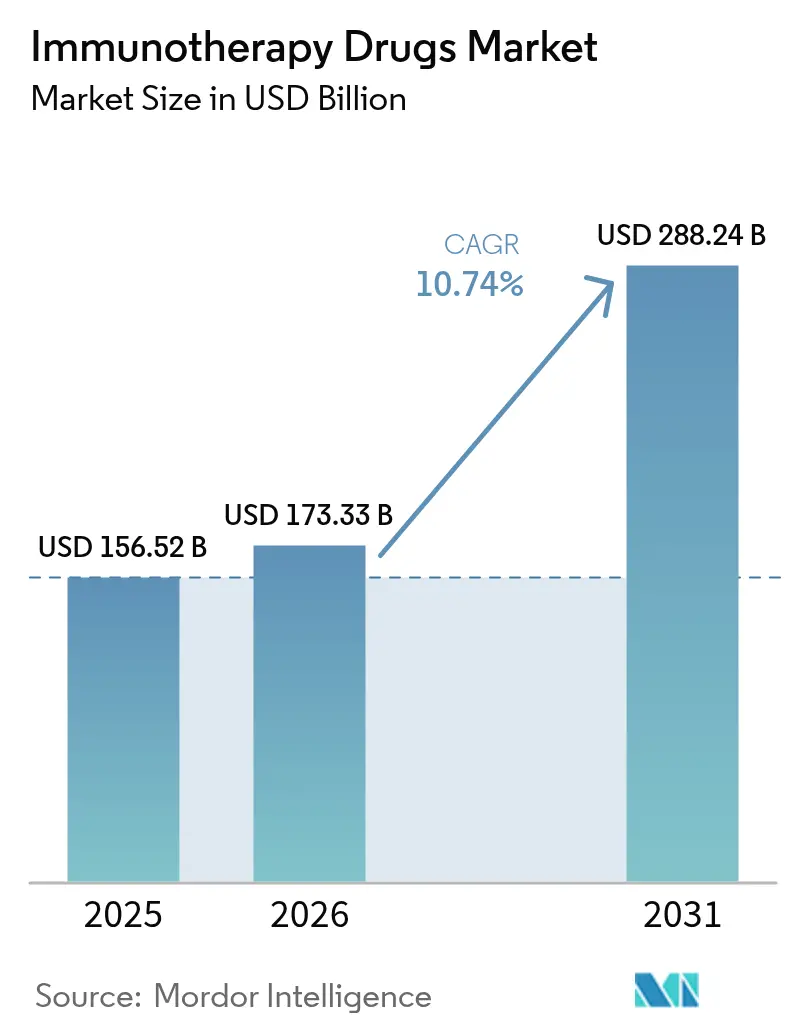
| Market Size (2026) | USD 173.33 Billion |
| Market Size (2031) | USD 288.24 Billion |
| Growth Rate (2026 - 2031) | 10.74 % |
| Fastest Growing Market | Asia Pacific |
| Largest Market | North America |
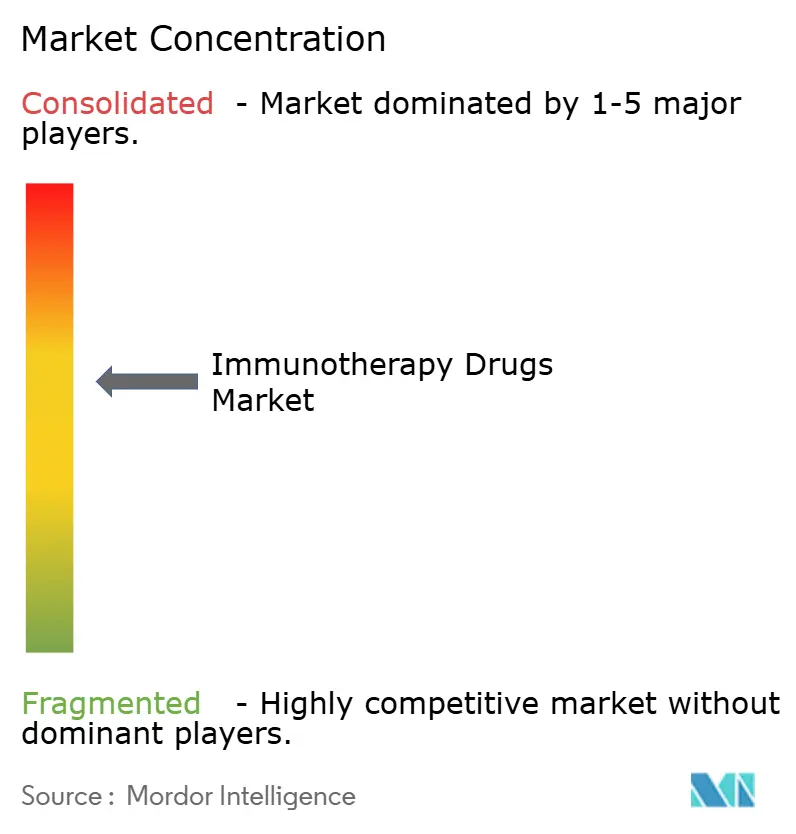
| Market Concentration | Medium |
Major Players *Disclaimer: Major Players sorted in no particular order Image © Mordor Intelligence. Reuse requires attribution under CC BY 4.0. | |
Immunotherapy Drugs Market Analysis by Mordor Intelligence
Global immunotherapy drugs market size in 2026 is estimated at USD 173.33 billion, growing from 2025 value of USD 156.52 billion with 2031 projections showing USD 288.24 billion, growing at 10.74% CAGR over 2026-2031. The surge originates from deeper checkpoint-inhibitor penetration, rapid maturation of T-cell engineering, and the routine use of artificial-intelligence platforms that shorten discovery cycles. Multi-modal regimens that merge monoclonal antibodies with precision biomarkers continue to dominate first-line protocols in solid tumors, while bespoke neoantigen vaccines graduate from early trials into pivotal studies in melanoma and lung cancer. Regulatory agencies simplify combination-therapy reviews, and outcomes-based payment pilots reduce upfront cost exposure for health systems. Manufacturing scale-ups in Asia–Pacific lower per-dose costs, and real-time pharmacovigilance networks improve adverse-event tracking, supporting broader geographic access for complex biologics.
Key Report Takeaways
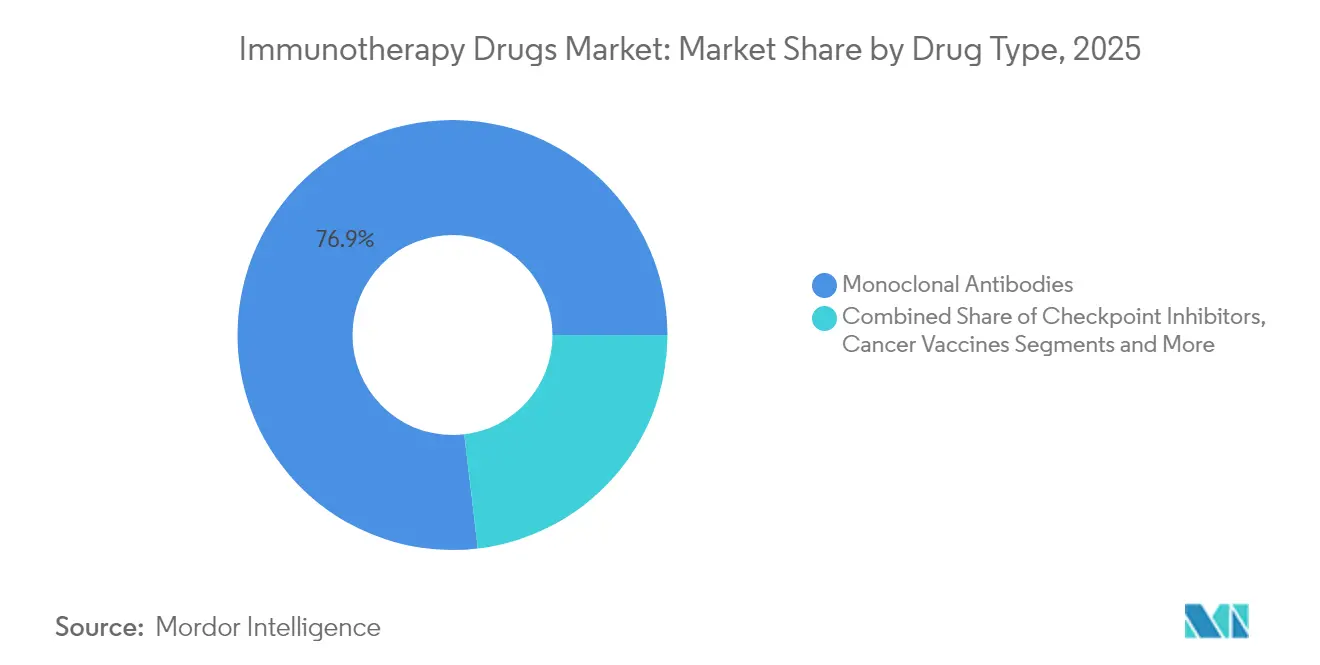
- By drug type, monoclonal antibodies led with 76.88% revenue share in 2025; T-cell therapies are on track to post the highest growth at an 17.62% CAGR through 2031.
- By therapy area, cancer accounted for 92.05% of the immunotherapy drugs market share in 2025, while autoimmune and inflammatory diseases exhibit a 13.74% CAGR to 2031.
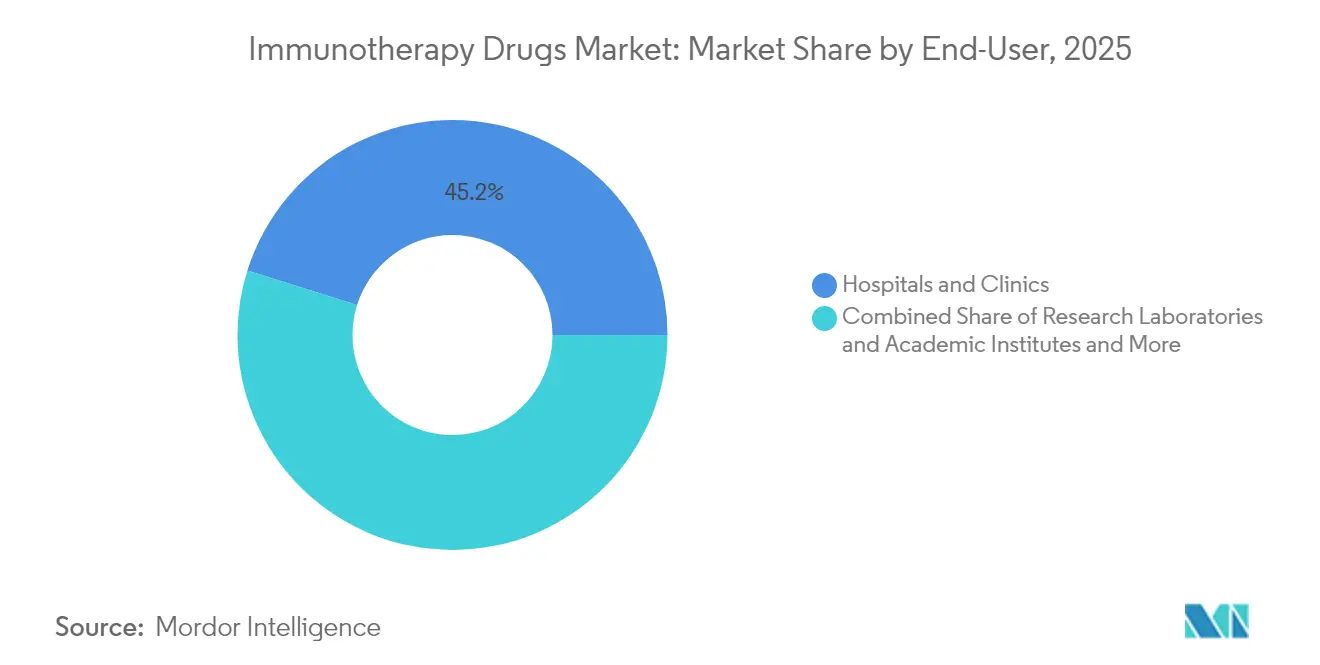
- By end-user, hospitals and clinics controlled 45.15% of 2025 spending, whereas research laboratories show the fastest expansion at a 13.08% CAGR.
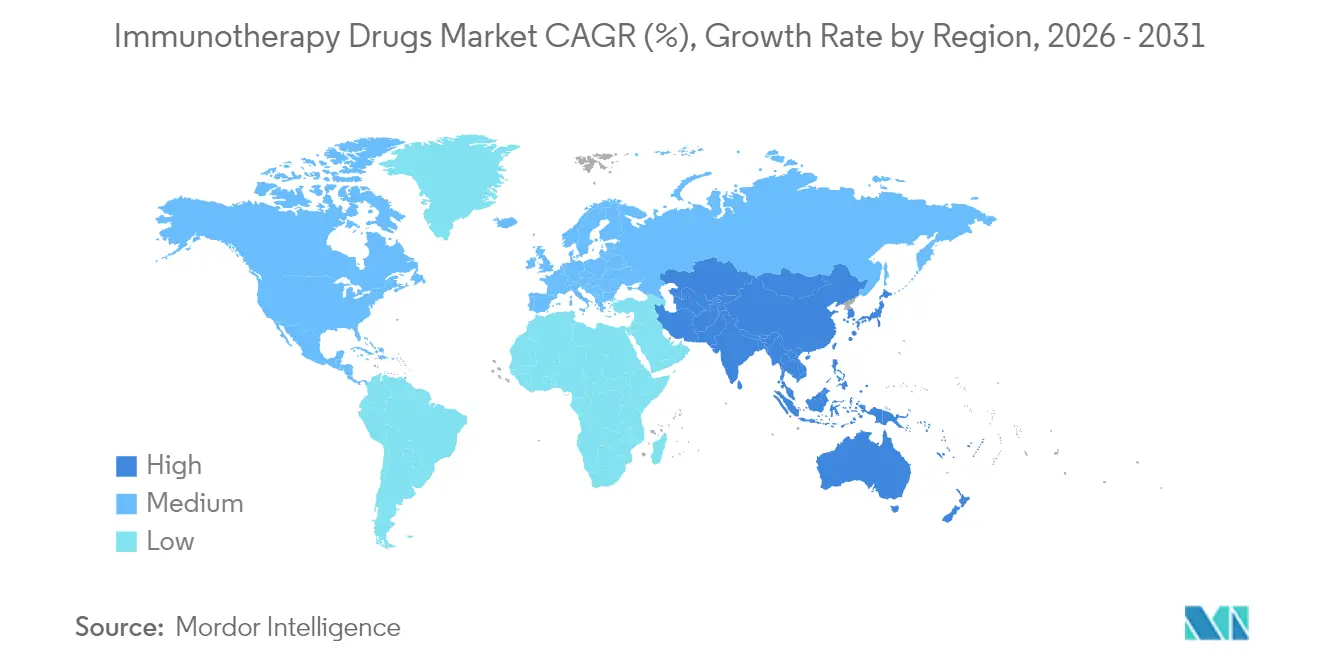
- By geography, North America held 48.10% of global sales in 2025; Asia–Pacific is projected to rise at a 13.79% CAGR through 2031.
Note: Market size and forecast figures in this report are generated using Mordor Intelligence’s proprietary estimation framework, updated with the latest available data and insights as of 2026.
Market Trends and Insights
Drivers Impact Analysis of Immunotherapy Drugs Market*
| Driver | (~) % Impact on CAGR Forecast | Geographic Relevance | Impact Timeline |
|---|---|---|---|
| Explosive Pipeline Of Immune-Checkpoint Inhibitors | +1.8% | Global, with concentration in North America & EU | Medium term (2-4 years) |
| Expanding Dominance Of Monoclonal Antibodies | +1.5% | Global, led by North America, expanding in APAC | Long term (≥ 4 years) |
| Rising Incidence Of Cancer & Chronic Diseases | +1.2% | Global, accelerated in aging populations of developed markets | Long term (≥ 4 years) |
| Biomarker-Driven Precision-Medicine Adoption | +1.0% | North America & EU leading, selective APAC markets | Medium term (2-4 years) |
| Bispecific Antibodies & Adcs Unlocking New Indications | +0.9% | Global, with regulatory leadership in US & EU | Short term (≤ 2 years) |
| AI-Enabled In-Silico Discovery Accelerating R&D | +0.8% | North America & EU core, spill-over to APAC | Medium term (2-4 years) |
| Source: Mordor Intelligence | |||
Explosive Pipeline of Immune-Checkpoint Inhibitors
Approvals of tislelizumab-jsgr and cosibelimab-ipdl in 2024 confirmed that PD-1, PD-L1, and CTLA-4 programs now pivot toward tumor-agnostic and rare-cancer settings, often as part of doublet or triplet regimens. Late-phase trials involving LAG-3, TIGIT, and TIM-3 candidates signal access to previously resistant populations, while adaptive trial designs shrink development timelines. Combination strategies such as nivolumab + ipilimumab secure higher complete-response rates in melanoma, underlining why regulators continue to grant breakthrough designations for synergistic protocols that deliver clear survival advantages over monotherapies[1].
Expanding Dominance of Monoclonal Antibodies
Iterative engineering upgrades—bispecific, trispecific, and antibody-drug conjugate (ADC) formats—preserve the 77.55% revenue grip held by antibodies. Tec¬listamab delivers a 63% overall response rate in late-line multiple myeloma, and Pfizer’s AI-guided ADC collaboration compresses lead-optimization windows from months to days. CD3-engaging bispecifics redirect T-cell cytotoxicity against solid-tumor antigens that remain out of reach for current CAR-T delivery mechanisms.
Rising Incidence of Cancer & Chronic Diseases
Global prevalence of malignancies rises as populations age, shifting immunotherapy from salvage status to first-line standard. Dostarlimab achieved a 100% complete-response rate in mismatch-repair-deficient rectal cancer, offering organ-preservation alternatives that reduce lifetime cost of care. Parallel breakthroughs in systemic lupus erythematosus and myasthenia gravis validate B-cell depletion via CD19 CAR-T cells, hinting at functional cures that replace decades of immunosuppressive maintenance[3].
Biomarker-Driven Precision-Medicine Adoption
Tumor mutational burden, microsatellite instability, and PD-L1 thresholds increasingly dictate regimen selection, preventing unnecessary toxicity and conserving payer budgets[2]. The UK’s draft rule set for individualized mRNA cancer vaccines formalizes bespoke manufacturing pathways, and circulating-tumor-DNA assays supply near-real-time feedback on therapeutic efficacy, widening precision-medicine uptake.
Restraints Impact Analysis of Immunotherapy Drugs Market*
| Restraint | (~) % Impact on CAGR Forecast | Geographic Relevance | Impact Timeline |
|---|---|---|---|
| High Treatment Costs & Reimbursement Hurdles | -1.4% | Global, most acute in emerging markets with limited healthcare budgets | Short term (≤ 2 years) |
| Manufacturing Complexity Of Biologics Supply Chains | -1.1% | Global, concentrated in regions with limited biomanufacturing capacity | Medium term (2-4 years) |
| Immune-Related Adverse-Event Management Burden | -0.8% | Global, requiring specialized healthcare infrastructure | Long term (≥ 4 years) |
| Price Erosion From Biosimilar Competition | -0.6% | Developed markets with established biosimilar pathways | Medium term (2-4 years) |
| Source: Mordor Intelligence | |||
High Treatment Costs & Reimbursement Hurdles
CAR-T price tags ranging from USD 373,000 to USD 4.25 million strain payer budgets; in response, CMS proposes a 17% base-payment increase and pilots outcomes-based contracts that refund non-responders. Medicaid’s CGT Access Model ties reimbursement to real-world durability metrics, yet emerging economies still struggle to afford premium biologics despite high unmet needs.
Manufacturing Complexity of Biologics Supply Chains
Contract development and manufacturing organizations average below-50% utilization because process variability in autologous cell lines resists standardization. Global capacity edges up to 17.4 million liters, but single-use bioreactors replace mega-plants to accommodate bespoke product runs. Workforce shortages and quality-assurance bottlenecks delay releases and push companies toward automation and AI-driven predictive maintenance.
*Our forecasts treat driver/restraint impacts as directional, not additive. The impact forecasts reflect baseline growth, mix effects, and variable interactions.
Immunotherapy Drugs Market Segment Analysis
By Drug Type:
Living-Cell Platforms Gain MomentumThe immunotherapy drugs market continues to be dominated by monoclonal antibodies, yet T-cell therapies represent the fastest-rising pillar with an 17.62% CAGR through 2031. The immunotherapy drugs market size allocated to T-cell therapies is forecast to expand from USD 15.2 billion in 2025 to USD 40.18 billion by 2031, underscoring their transformative impact on relapsed multiple myeloma and aggressive lymphomas. FDA approvals of idecabtagene vicleucel and ciltacabtagene autoleucel produce minimal-residual-disease negativity rates above 70%, while dual-target CAR constructs broaden tumor-antigen coverage. Checkpoint inhibitors gather steady share via combination approvals, and the pipeline for mRNA cancer vaccines accelerates on the back of breakthrough-therapy designations. Oncolytic viruses such as LOAd703 post 44% response rates when paired with atezolizumab, while IL-15 super-agonists like Anktiva secure approvals for lymphopenic settings, signaling gains for cytokine-based products within the broader immunotherapy drugs market.
Progress in generative chemistry compresses ADC payload discovery, raising potency without parallel toxicity. The immunotherapy drugs market thus transitions from standalone biologics to integrated, multimodal regimens that pair cell therapies with oncolytic platforms and targeted cytokines. Manufacturing automation reduces vein-to-vein time for autologous constructs, suggesting that living products will secure larger slices of future immunotherapy drugs market share once cost curves decline.

By Therapy Area:
Autoimmunity Shapes the Next Growth HorizonCancer retains 92.05% of 2025 revenues, but autoimmune diseases deliver a 13.74% CAGR, outpacing oncology’s high yet stabilizing growth. The immunotherapy drugs market size devoted to autoimmune indications is expected to rise from USD 5.8 billion in 2025 to USD 12.58 billion in 2031, reflecting durable remissions seen in systemic lupus erythematosus after CD19 CAR-T administration. Over 85 candidates target B-cell reset mechanisms, and programs for multiple sclerosis and rheumatoid arthritis implement both autologous and allogeneic platforms to counter cost and scalability concerns. Infectious-disease immunotherapy edges beyond HIV prophylaxis as bifunctional antibodies clear drug-resistant pathogens, opening ancillary revenue lines inside the wider immunotherapy drugs market.
Regulators now accept surrogate endpoints such as B-cell aplasia for accelerated autoimmune approvals, cutting development risk and inviting venture financing. European and Chinese authorities align on data-package requirements, enabling global launch sequences. With health systems quantifying the long-term savings from curative autoimmune interventions, payer resistance fades and access widens, further stimulating the immunotherapy drugs market.
By End-User:
Academic-Industry Synergy DeepensHospitals and clinics capture 45.15% of spending given their role as treatment hubs, yet research laboratories grow fastest at 13.08% CAGR as complex discovery workflows merge wet-lab experimentation with cloud-based AI analytics. The immunotherapy drugs market benefits when academic centers like Memorial Sloan Kettering co-create AI-designed antibodies; such alliances turn early-stage ideas into de-risked clinical assets that rapidly move into large hospital systems for commercial rollout. Government grants—such as the USD 3.27 million National Cancer Institute award for a pancreatic vaccine—further underwrite translational infrastructure.
Community hospitals invest in specialized infusion suites, but autologous manufacturing still concentrates in academic medical centers capable of real-time cell-handling and gene-editing oversight. Meanwhile, decentralized cell-therapy suites linked by digital quality-control platforms promise to democratize access, opening fresh revenue channels and broadening geographic penetration for the immunotherapy drugs market.
Geography Analysis
North America Immunotherapy Drugs Market
North America keeps a 48.10% revenue stake through 2025, anchored by a mature reimbursement framework, dense innovation clusters, and early adoption of outcomes-based contracting. The region’s biopharma incumbents acquire AI start-ups and manufacturing specialists, consolidating platform control while reducing batch-failure rates. Strategic onshoring incentives lower supply-chain exposure to geopolitical shocks, strengthening long-term competitiveness for the regional immunotherapy drugs market.
APAC Immunotherapy Drugs Market
Asia–Pacific records a 13.79% CAGR, the fastest worldwide, powered by regulatory harmonization, lower labor costs, and government-backed capacity expansions. China’s approval of Stapokibart, the first domestic IL-4Rα antagonist, reflects higher local regulatory sophistication and shortens launch lags versus Western benchmarks. Japan and South Korea refine conditional early-approval pathways, and India’s biomanufacturing corridors lure Western sponsors seeking cost-effective production slots, collectively lifting regional share in the global immunotherapy drugs market.
Europe Immunotherapy Drugs Market
Europe demonstrates steady mid-single-digit growth under the Advanced Therapy Medicinal Products regulation that standardizes cell- and gene-therapy review. Biosimilar competition tempers monoclonal-antibody pricing but widens access, keeping overall market value intact. Targeted digital-health initiatives link registries with pharmacovigilance portals, streamlining post-approval monitoring and reinforcing public confidence in immunotherapy safety profiles.
MEA and LATAM Immunotherapy Drugs Market
The Middle East and Africa gain momentum from flagship projects such as Saudi Arabia’s Cancer BioShield platform, which delivers immune-restorative regimens tailored to local genetic backgrounds. Multinational partnerships with regional sovereign funds finance precision oncology centers that function as hubs for nearby emerging markets. Latin America focuses on licensing ready-to-fill formulations and implementing risk-sharing reimbursement, gradually lifting therapy uptake in high-burden cancers like gastric carcinoma. Together, these advancements broaden the global footprint of the immunotherapy drugs market and reduce dependency on a handful of mature territories.
Competitive Landscape
Moderate consolidation characterizes the immunotherapy drugs market as Big Pharma acquires niche platform specialists while venture-financed start-ups challenge incumbents with disruptive modalities. Pfizer’s ADC pact with PostEra exemplifies a vertical-integration push combining AI design, clinical execution, and in-house manufacturing to compress cycle times. Novartis’ USD 1 billion AI-protein alliance underscores the premiums paid for computational lead-generation engines that slash attrition.
Private-equity funds enter cell-therapy contract manufacturing, betting that capacity scarcity will drive premium margins until standardization takes root. Meanwhile, the Alliance for Regenerative Medicine highlights in-vivo CAR-T editing and non-double-strand-break gene cutters as nascent technologies likely to reshape competitive hierarchies. Intellectual-property bundles now couple biologics with digital companions—patient-monitoring apps and AI image-analysis tools—that together form value-based contracting ecosystems.
Regional champions arise in China and South Korea, often spinning out of state-backed research institutes with advantaged access to local trials and fast-track approvals. Western firms respond by co-locating R&D units in Asia–Pacific to gain proximity to high-growth pools, thereby reinforcing innovation clusters and feeding competitive intensity inside the worldwide immunotherapy drugs market.
Immunotherapy Drugs Industry Leaders
-
Amgen Inc.
-
Novartis AG
-
AbbVie Inc.
-
F. Hoffmann-La Roche AG
-
GSK PLC
- *Disclaimer: Major Players sorted in no particular order
Immunotherapy Drugs Market Companies Covered in this Report
- Abbvie
- Amgen
- AstraZeneca
- Bristol-Myers Squibb
- Roche
- GlaxoSmithKline
- Johnson & Johnson
- Merck
- Novartis
- Pfizer
- Bayer
- Sanofi
- Boehringer Ingelheim
- Gilead Sciences
- UbiVac
- Regeneron Pharmaceuticals
- Eli Lilly and Company
- Seagen
- BeiGene Ltd.
Market Opportunities and Future Outlook
Manufacturing and delivery innovations create room to expand immunotherapy use beyond tertiary centers. Regulatory actions that improve convenience, including FDA approvals of pembrolizumab and berahyaluronidase alfa-pmph in July 2026, and FDA approval of nivolumab and hyaluronidase-nvhy as a subcutaneous injection, support differentiated product positioning through site-of-care flexibility and reduced chair time, which is particularly relevant while hospitals and clinics remain a core end-user channel. At the same time, automation and closed-system processing for cell therapies are moving from proof-of-concept toward scalable workflows, supported by 2026 research on microfluidic deterministic lateral displacement approaches for CAR-T processing that targets higher recovery with less manual handling.
A second opportunity cluster is centered on capacity build-out and localization of complex biologics and cell therapy supply chains. Disclosed investments such as Johnson & Johnsons more-than-USD 1 billion next-generation cell therapy manufacturing facility investment in Pennsylvania (announced in 2026), Celltrions KRW 1.2 trillion Songdo drug substance capacity expansion (adding 180,000 liters), and Aurobindo Pharmas TheraNym biologics facility in Telangana with MSD as an anchor customer indicate active efforts to reduce bottlenecks and improve resilience for antibody and advanced-therapy production. This expansion activity aligns with cost and reimbursement pressure points, creating whitespace for CDMOs, single-use systems, digital quality control, and regional fill-finish and drug-substance ecosystems that can shorten lead times for monoclonal antibodies, ADCs, and cell-based immunotherapies.
Recent Industry Developments in Immunotherapy Drugs Market
- July 2026: Novartis agreed to acquire Myricx Bio for USD 1.1 billion upfront, with up to USD 400 million in milestones, to strengthen its next-generation antibody-drug conjugate (ADC) pipeline with a novel payload approach. The transaction reflects sustained strategic appetite for differentiated ADC technology that can expand immunotherapy combination regimens and improve selectivity in oncology development.
- June 2026: AbbVie entered into a definitive agreement to acquire Apogee Therapeutics for USD 10.9 billion, expanding its exposure to inflammatory and immunological disease programs. The deal reinforces competitive intensity in immunology portfolios and increases the premium placed on clinically advanced assets that can address treatment cost and durability questions in chronic immune-mediated conditions.
- July 2025: AbbVie and Ichnos Glenmark Innovation (IGI) announced an exclusive global licensing agreement for ISB 2001, a first-in-class CD38xBCMAxCD3 trispecific antibody candidate. The licensing move points to continued investment in multi-specific formats designed to deepen response rates in hematologic malignancies and sustain monoclonal antibody leadership through next-wave engineering.
Immunotherapy Drugs Market Report Scope and Research Methodology
Market Definition and Coverage
This market covers revenues generated from approved immunotherapy drug products that treat diseases by activating, suppressing, or re-directing the immune response, and they are counted based on commercial sales in each geography.
Scope exclusions: We exclude pre-approval pipeline therapies, procedures without a drug product component, and general immunosuppressants used mainly for transplant rejection management.
Segments Covered in This Report
- By Drug Type
- Monoclonal Antibodies
- Checkpoint Inhibitors
- Cancer Vaccines
- Interferons Alpha/Beta
- Interleukins
- Oncolytic Viral Therapies
- T-Cell Therapies (CAR-T, TCR, TIL)
- Cytokines & Immunomodulators
- Other Drug Types
- By Therapy Area
- Cancer
- Autoimmune & Inflammatory Diseases
- Infectious Diseases
- Other Therapy Areas
- By End-User
- Hospitals & Clinics
- Research Laboratories & Academic Institutes
- Pharmaceutical & Biotechnology Companies
- Geography
- North America
- United States
- Canada
- Mexico
- Europe
- Germany
- United Kingdom
- France
- Italy
- Spain
- Rest of Europe
- Asia-Pacific
- China
- Japan
- India
- South Korea
- Australia
- Rest of Asia-Pacific
- Middle East and Africa
- GCC
- South Africa
- Rest of Middle East and Africa
- South America
- Brazil
- Argentina
- Rest of South America
- North America
Data Sources, Market Sizing, and Validation
Desk Research
Desk work was used to set the market map, define what counts as an immunotherapy drug, and lock the main demand and pricing signals before the model was run. We leaned on public sources such as the US FDA drug labels and approvals database, the US National Cancer Institute (NCI) updates, WHO disease and treatment context, and published clinical literature in journals that report therapy uptake and outcomes.
To pressure-test country level assumptions, we also referred to sources such as OECD health statistics, national health agency publications, and customs or trade releases where relevant for biologics flows. Company annual reports, earnings decks, and regulatory filings were used to understand reported therapy mix, key launches, and regional revenue patterns. Paid subscriptions were used selectively for company financial intelligence and patent landscaping so the same drug class naming and ownership could be tracked consistently. This list is illustrative, and many other public sources were checked for data collection, cross-verification, and clarification.
Primary Interviews and Surveys
Primary work helped us confirm what is actually prescribed, how fast switching happens after label expansions, and how price and access rules affect net sales by country. We spoke with a mix of clinicians, hospital pharmacy stakeholders, payers, distributors, and industry roles across major regions so assumptions on patient pools, treatment duration, and adoption timing could be corrected where desk sources stayed broad.
Distribution of primary research fieldwork respondents
| Company type | Respondent position | Region |
|---|---|---|
| Top tier: 34% | CXOs: 14% | APAC: 43% |
| Mid tier: 50% | Functional/Unit leaders: 32% | EMEA: 33% |
| Smaller Players: 16% | Managers: 54% | Americas: 24% |
Market-Sizing & Forecasting
Sizing starts with a top-down build where disease burden and treated patient pools are reconstructed by major indications. We then translate those pools into therapy volumes using line-of-therapy placement and real-world uptake. Those volumes are valued using average selling price progressions that reflect mix shifts across established biologics, newer checkpoint regimens, and cell-based approaches, before totals are rolled up by country and then by region.
To keep the numbers grounded, we corroborate totals using selective bottom-up checks such as sampled product sales disclosures, channel discussions on hospital versus retail mix, and implied revenue derived from therapy volume and plausible net price bands. Inputs that materially move the model include incidence and prevalence of eligible cancers, diagnostic and biomarker testing penetration for checkpoint therapies, label expansion timing, treatment duration and discontinuation behavior, and changes in reimbursement access or tender outcomes in key markets. For forecasting, we run scenario analysis alongside simple multivariate relationships so adoption curves can be flexed under different approval and access assumptions that primary respondents considered realistic. Where a bottom-up signal is missing for smaller countries, we bridge gaps using peer-country analogs based on healthcare spend, oncology infrastructure, and recent launch timing, then we re-check the implied per-patient spend for reasonableness.
Data Validation & Update Cycle
Validation happens in steps, and the model is not signed off until totals reconcile with independent signals. We compare outputs against external anchors such as oncology drug spending direction, biologics price movement signals, and reported regional revenue splits from public company disclosures, then investigate any large variance before the final totals are accepted.
Anomaly checks include sudden step-changes in a country series, unrealistic treatment duration outcomes, and pricing that drifts away from observed list-to-net behavior. If gaps persist, experts are re-contacted to confirm whether the issue is access policy, label change timing, or a modeling assumption that needs adjustment. Reports are refreshed annually, with interim updates when material events happen, including major approvals, safety actions, or reimbursement shifts. Before delivery, an analyst performs a final refresh pass so clients receive the latest updated view.
Mordor Intelligence's Immunotherapy Drugs Market Estimate Compared With Other Published Estimates
Published market sizes for immunotherapy drugs can vary widely, even when sources appear to cover the same topic. The main reasons usually come down to what each source counts as an immunotherapy drug, which diseases are included, and how net pricing and access constraints are handled across countries.
In some studies, broader immunology biologics or supportive regimens are folded into the total, and the value can also rise quickly if list prices are used without adjusting for rebates, discounts, and payer controls. Differences also come from base-year choice and how fast adoption is assumed for newer modalities like cell therapies, especially when launch timing and capacity limits are not checked against real prescribing behavior and reimbursement readiness. A key spread driver is whether only approved, revenue-earning therapies are counted across oncology plus select autoimmune and infectious uses, an approach applied here after checking treated-patient logic and price realization patterns, then carrying it through the roll-up, which is where the model diverges, including for Mordor Intelligence.
Benchmark comparison
| Source | Market Size | Gaps in Research Methodology |
|---|---|---|
| Mordor Intelligence | USD 173.33 B (2026) | |
| Global Research Publisher A | USD 285.73 B (2025) | The higher figure aligns with a broader counted scope and a different base year, and it can also reflect more aggressive inclusion across indications, which increases totals when pricing is closer to list levels rather than net realized values. |
| Industry Research Group B | USD 260.70 B (2025) | This estimate uses a 2025 value anchored to a 2024 base-year series, and the scope emphasizes major immunotherapy classes, which can produce a higher total if discounting, access lags, and country-level uptake limits are treated more lightly. |
Across the three figures, the gap mostly traces back to scope breadth, base year selection, and how quickly uptake and price realization are assumed to move across geographies. Our approach keeps the build traceable to treated patients, therapy duration, and realistic pricing adjustments, which makes the final total easier to reproduce and explain when users need to align strategy with what is actually reimbursed and prescribed.
Key Questions Answered in the Report
What is the current size and growth rate of the immunotherapy drugs market?
Global revenues reach USD 173.33 billion in 2026 and are projected to advance at a 10.74% CAGR to USD 288.24 billion by 2031.
Which drug class contributes the largest share of immunotherapy sales?
Monoclonal antibodies hold 76.88% of 2025 revenues, driven by bispecific, trispecific, and antibody-drug-conjugate upgrades.
Where is the fastest regional growth expected?
Asia–Pacific shows a 13.79% CAGR through 2031, supported by regulatory harmonization and expanding biomanufacturing capacity.
What therapy areas are gaining momentum beyond oncology?
Autoimmune and inflammatory diseases post a 13.74% CAGR, fueled by CD19 CAR-T successes in systemic lupus erythematosus and multiple sclerosis.
How are high treatment costs being addressed?
Outcomes-based payment models such as the CMS CGT Access Model link reimbursement to real-world durability metrics, easing payer burden on therapies priced between USD 373,000 and USD 4.25 million per patient.
Which end-user segment is expanding fastest?
Research laboratories grow at a 13.08% CAGR as academic-industry alliances deploy artificial-intelligence discovery platforms and accelerate translational studies.