
Immunohematology Market Size and Share
Market Overview
| Study Period | 2020 - 2031 |
|---|---|
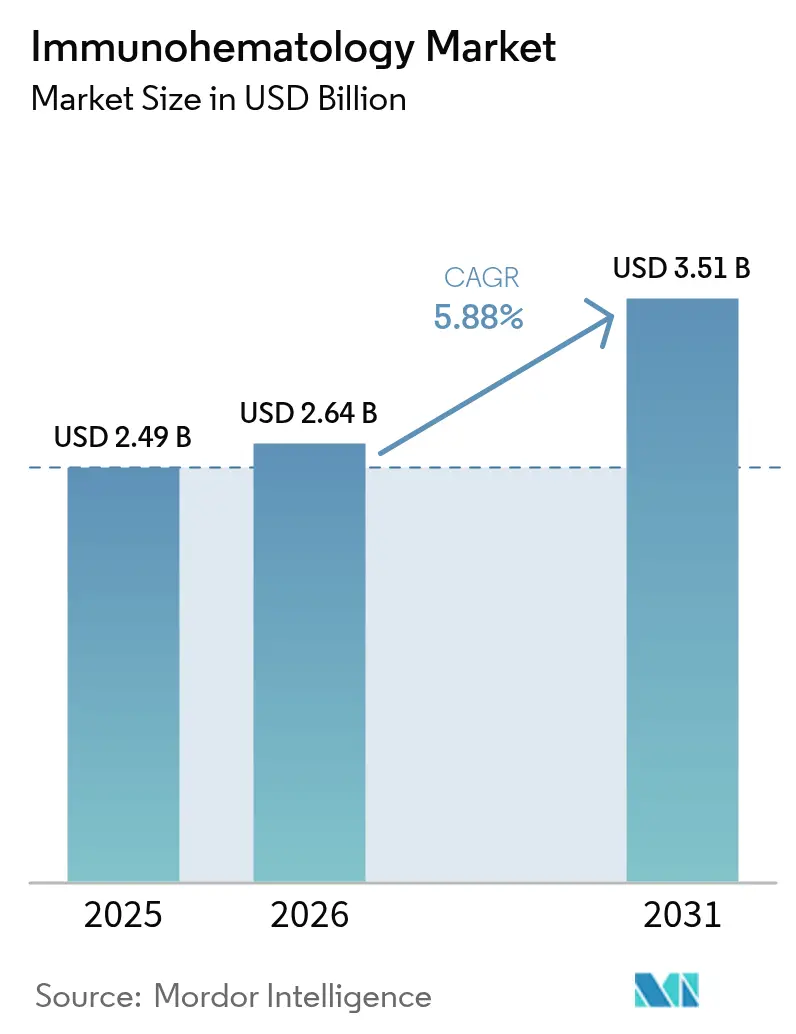
| Market Size (2026) | USD 2.64 Billion |
| Market Size (2031) | USD 3.51 Billion |
| Growth Rate (2026 - 2031) | 5.88 % |
| Fastest Growing Market | Asia Pacific |
| Largest Market | North America |
| Market Concentration | Medium |
Major Players *Disclaimer: Major Players sorted in no particular order Image © Mordor Intelligence. Reuse requires attribution under CC BY 4.0. | |
Immunohematology Market Analysis by Mordor Intelligence
The immunohematology market size is expected to grow from USD 2.49 billion in 2025 to USD 2.64 billion in 2026 and is forecast to reach USD 3.51 billion by 2031 at 5.88% CAGR over 2026-2031. This steady trajectory is supported by the aging global population, a rising burden of trauma and hemoglobinopathies, universal antibody-screening mandates, and rapid analyzer automation. The immunohematology market is also influenced by upgraded regulatory frameworks for laboratory-developed tests, which are accelerating the standardization of transfusion services. Vendors are capturing opportunities created by high-throughput analyzers, AI-driven interpretation software, and monoclonal reagent innovations, while addressing supply-chain vulnerabilities that surfaced during recent reagent shortages. Competitive dynamics remain moderate, with global leaders differentiating on technology depth and compliance expertise, and regional suppliers expanding in Asia-Pacific where healthcare infrastructure investment is robust. Strategic acquisitions, partnerships, and portfolio expansions continue to shape the immunohematology market as stakeholders race to offer integrated analyzer–reagent ecosystems.
Key Report Takeaways
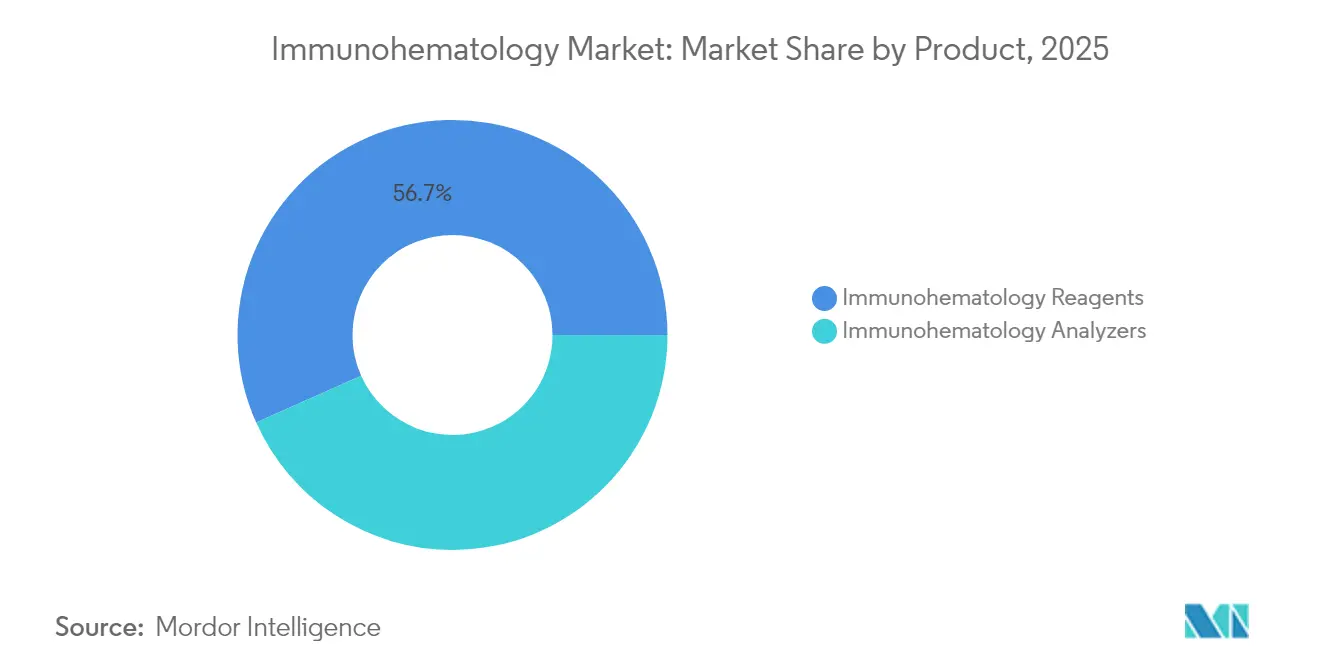
- By product, reagents captured 56.68% of immunohematology market share in 2025, whereas analyzers are forecast to record an 11.05% CAGR through 2031.
- By application, blood grouping accounted for 47.10% of the immunohematology market size in 2025, while antibody screening and identification is advancing at a 12.10% CAGR to 2031.
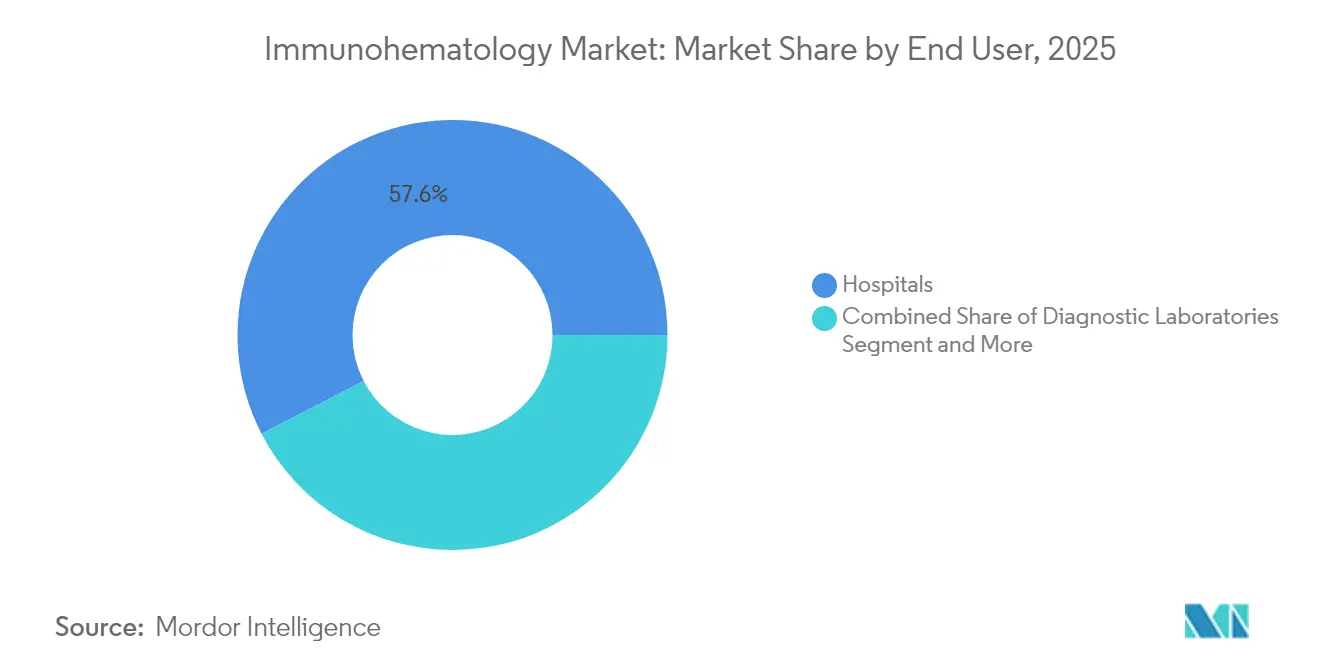
- By end user, hospitals held 57.60% revenue share in 2025, whereas diagnostic laboratories are set to expand at a 10.20% CAGR over the same period.
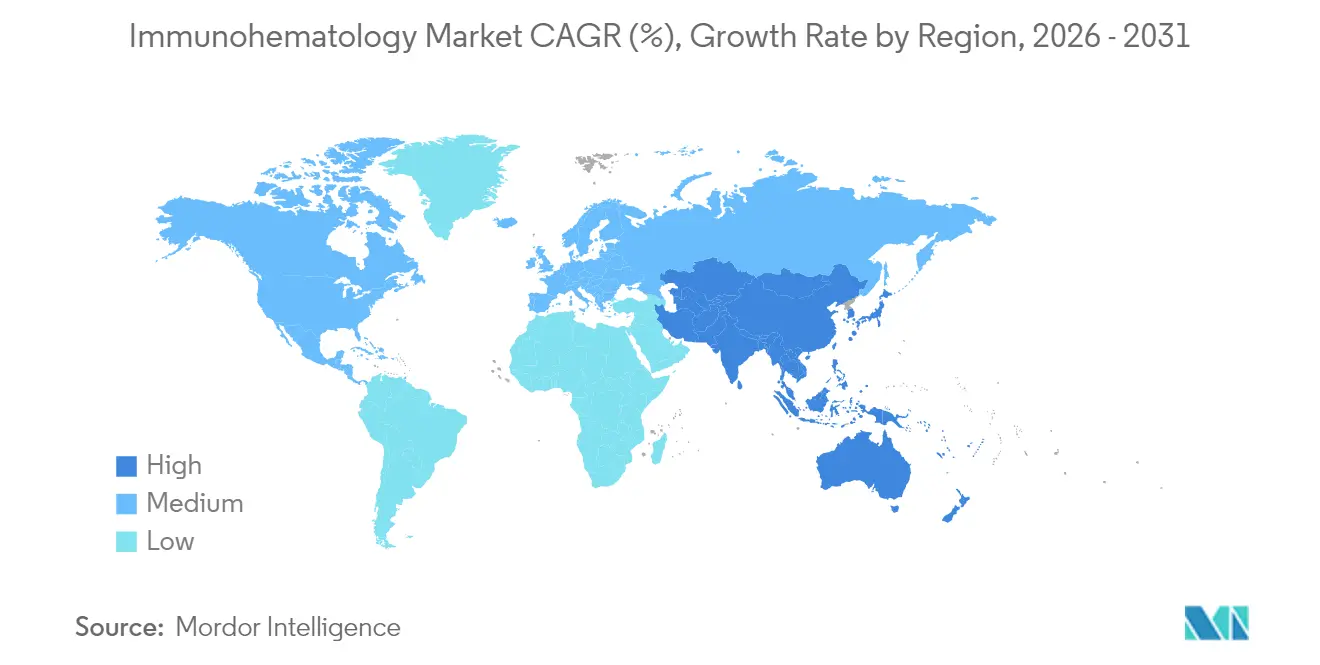
- By geography, North America dominated with 35.50% share in 2025, whereas Asia-Pacific is poised for the fastest 9.40% CAGR to 2031.
Note: Market size and forecast figures in this report are generated using Mordor Intelligence’s proprietary estimation framework, updated with the latest available data and insights as of 2026.
Market Trends and Insights
Drivers Impact Analysis of Immunohematology Market*
| Driver | (~) % Impact on CAGR Forecast | Geographic Relevance | Impact Timeline |
|---|---|---|---|
| Aging-related growth in surgical procedures | +1.2% | Global, concentrated in North America & Europe | Long term (≥ 4 years) |
| Rising trauma & hemoglobinopathies incidence | +0.8% | Global, higher impact in Asia-Pacific & MEA | Medium term (2-4 years) |
| Mandated universal antibody screening in transfusion services | +0.9% | Global, led by North America & Europe | Short term (≤ 2 years) |
| AI-enabled fully automated analyzers cutting TAT | +0.7% | Early adoption in North America & Europe, Asia-Pacific following | Medium term (2-4 years) |
| Transition from polyclonal to monoclonal reagent formulations | +0.6% | Global, faster uptake in developed markets | Long term (≥ 4 years) |
| Demand for molecular immunohematology (genotyping) | +0.5% | North America & Europe leading, gradual Asia-Pacific penetration | Long term (≥ 4 years) |
| Source: Mordor Intelligence | |||
Aging-related growth in surgical procedures
An expanding elderly cohort is raising the number and complexity of cardiovascular and orthopedic operations that rely on meticulous blood-compatibility checks. Hospitals anticipate longer inpatient stays and heavier transfusion needs from older patients, driving sustained reagent consumption and prompting investment in fully automated analyzers that can clear rising test volumes without compromising accuracy. Minimally invasive surgery, although reducing intra-operative blood loss, paradoxically increases per-case immunohematology workloads because surgeons demand tighter compatibility margins to minimize adverse events. Larger facilities have begun scaling AI-enabled analyzers to handle these workloads smoothly, ensuring consistent turnaround times for high-acuity geriatric cases.
Rising trauma & hemoglobinopathies incidence
Emergency departments are treating more complex trauma cases that require rapid cross-matching and massive transfusion protocols. Simultaneously, hemoglobinopathies such as sickle-cell disease necessitate specialized antibody screens for safe chronic transfusion support. University Hospitals reported a 7% rise in blood-bank samples and 12,000 additional tests in 2025, underscoring the growing need for fast, reliable immunohematology workflows. Field adoption of whole-blood programs and point-of-care testing is intensifying demand for portable analyzers capable of delivering accurate serologic or genotypic results in minutes, especially in rural areas that previously lacked transfusion services.
Mandated universal antibody screening in transfusion services
Regulators now require antibody screens on every patient sample, regardless of transfusion history[1]. Laboratories must therefore scale capacity rapidly, migrating toward high-throughput analyzers that batch hundreds of tests hourly while maintaining stringent quality standards. Universal screening also boosts demand for broad reagent panels that detect antibodies once reserved for complex cases. Health systems weigh the incremental cost of universal protocols against the sharp drop in transfusion reactions, often favoring automation that offsets added reagent expenses through labor savings.
AI-enabled fully automated analyzers cutting TAT
Artificial intelligence modules embedded in next-generation analyzers interpret agglutination patterns, flag mixed-field results, and suggest reflex tests, slashing review times for technologists. Early adopters report higher throughput, lower error rates, and improved clinician confidence in complex antibody identification. Continuous machine-learning loops fine-tune reaction grading and augment technologist training by providing visual explanations. AI success is encouraging procurement teams to standardize across enterprise-wide labs, strengthening vendor lock-in but ensuring consistency in transfusion protocols.
Restraints Impact Analysis of Immunohematology Market*
| Restraint | (~) % Impact on CAGR Forecast | Geographic Relevance | Impact Timeline |
|---|---|---|---|
| High capital & maintenance cost of automated analyzers | -0.4% | Global, higher impact in LMICs | Short term (≤ 2 years) |
| Short shelf-life of certain rare-cell reagents | -0.3% | Global, affecting smaller laboratories | Medium term (2-4 years) |
| Scarcity of certified immunohematologists in LMICs | -0.2% | Primarily LMICs, spillover into underserved regions elsewhere | Long term (≥ 4 years) |
| Reimbursement gaps for advanced antibody panels | -0.1% | North America & Europe | Medium term (2-4 years) |
| Source: Mordor Intelligence | |||
High capital & maintenance cost of automated analyzers
Fully automated platforms often exceed USD 500,000, with service contracts adding another 10–15% annually, stretching budgets of community hospitals and independent labs. Facilities struggling to justify such expenditure either delay upgrades or outsource testing, which can increase turnaround time and patient risk. Financial hurdles are steering procurement toward shared-service models and reagent-rental agreements where vendors bundle hardware with reagent commitments, attempting to balance initial outlay and long-term consumable spend.
Short shelf-life of certain rare-cell reagents
Rare-cell panels vital for identifying uncommon antibodies typically expire within weeks. Labs must stock adequate volumes to avoid canceled procedures yet risk wastage when panels expire unused. These hurdles are driving remote sample-sharing networks and digital referencing services that reduce on-site rare-panel inventories while still guaranteeing rapid identification for complex cases.
*Our forecasts treat driver/restraint impacts as directional, not additive. The impact forecasts reflect baseline growth, mix effects, and variable interactions.
Immunohematology Market Segment Analysis
By Product:
Reagents Dominate Despite Analyzer InnovationImmunohematology reagents accounted for 56.68% of 2025 revenue, confirming the consumable core of every test procedure in the immunohematology market. Analyzers, though only a one-time capital purchase, are growing at an 11.05% CAGR because hospitals need automation to manage rising volumes. The immunohematology market size for reagents will continue to overshadow hardware spending yet is directly linked to analyzer penetration, since each automated test consumes multiple reagent vials. Red-cell reagents underpin routine ABO/Rh typing, while antisera panels increasingly rely on monoclonal specificity to minimize false-positive flags. Roche’s 2025 FDA clearance for a highly sensitive lymphoma assay underscores the push for reagent innovation that pairs with sophisticated detection systems.
Laboratories in high-volume settings migrate toward fully automated analyzers that integrate barcode tracking, reflex testing, and LIS interfacing. Semi-automated instruments retain relevance in smaller labs looking to reduce manual pipetting without incurring premium maintenance contracts. Vendors offering reagent-rental structures bundle analyzer placement with guaranteed consumable purchases, shifting capital expenditure toward operating expenditure and smoothing adoption in resource-constrained environments.

By Application:
Blood Grouping Leads While Screening AcceleratesBlood grouping controlled 47.10% of 2025 revenue, largely because every transfusion begins with ABO/Rh confirmation, reinforcing the core role of this application within the immunohematology market. Antibody screening and identification, however, is projected to rise at a 12.10% CAGR as universal screening and chronic transfusion cases expand. Cross-matching remains essential in surgical scenarios, but its incremental growth trails antibody screening, indicating a pivot toward advanced serologic and molecular protocols. The immunohematology market share for antibody screening will therefore climb steadily, driven by patients with complex transfusion histories and alloimmunization risks.
Prenatal and neonatal testing benefits from broader maternal-fetal medicine programs aimed at preventing hemolytic disease of the fetus and newborn. University Hospitals digitized three decades of antibody panels to inform high-risk obstetric cases, demonstrating the growing intersection of data analytics and transfusion safety. Emerging molecular immunohematology applications promise even sharper resolution for rare-type identification, paving the way for genotype-matched transfusions that limit alloimmunization.
By End User:
Hospitals Dominate While Labs AccelerateHospitals generated 57.60% of 2025 revenue because they integrate transfusion services into surgical, trauma, and intensive-care workflows, ensuring immediate access to compatibility testing. Diagnostic laboratories, in contrast, will post a 10.20% CAGR as health systems centralize testing to leverage scale advantages. Outsourcing routine panels allows small hospitals to sidestep analyzer capital costs, concentrating on emergency cross-matching while forwarding complex screens to specialized labs. The immunohematology market size flowing to diagnostic laboratories reflects this centralization trend and the efficiency gains it delivers.
Blood banks and transfusion centers maintain pivotal roles in donor management, component preparation, and regional supply coordination. Research institutes, though a minor end-user segment, drive assay innovation and validate next-generation reagents. CMS’s classification of blood administration as an advanced life-support service may improve reimbursement for ambulance-based transfusions, indirectly boosting demand for rapid test kits in prehospital environments.
Geography Analysis
North America Immunohematology Market
North America led with 35.50% revenue share in 2025 due to sophisticated healthcare infrastructure, stringent FDA oversight, and high adoption of AI-enabled analyzers. The United States accounts for the bulk of regional spending, while Canada contributes through Canadian Blood Services modernization programs. The FDA’s 2025 draft guidances on communicable-disease risk underscore the region’s influence on global transfusion standards.
APAC Immunohematology Market
Asia-Pacific is the immunohematology market’s fastest-growing arena, projected at 9.40% CAGR through 2031. China and India are scaling hospital networks and blood-bank capacity, while Japan and South Korea deploy cutting-edge automation. Resource differentials across the region create stratified adoption: urban tertiary centers champion AI analyzers, whereas district hospitals rely on semi-automated systems. Workforce shortages in specialized roles propel demand for walk-away instruments that require minimal human intervention.
Europe Immunohematology Market
Europe remains a mature market characterized by rigorous EMA and national regulations, comprehensive hemovigilance networks, and hospital consolidation. Germany, the United Kingdom, and France field advanced laboratory information systems and routinely pilot molecular immunohematology projects. Southern and Eastern European nations are modernizing, offering growth pockets for mid-range analyzers and reagent rental contracts.
MEA Immunohematology Market
The Middle East displays bifurcation: Gulf Cooperation Council states invest in state-of-the-art blood centers, while many North African and sub-Saharan nations still grapple with infrastructure shortfalls. International aid projects and public-private partnerships are expanding basic reagent availability, setting the stage for gradual analyzer deployment.
Competitive Landscape
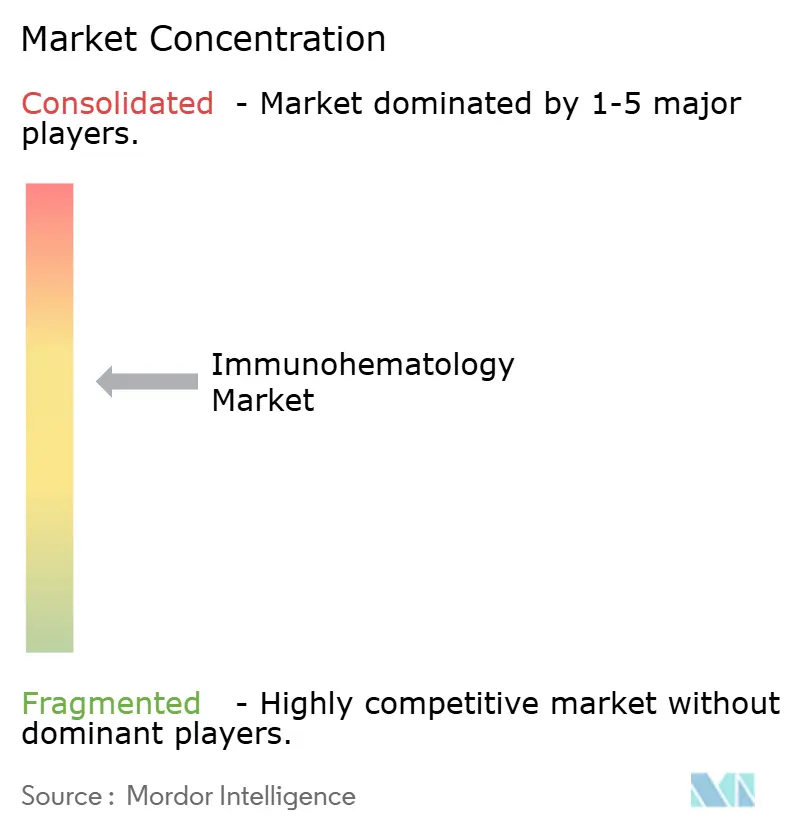
The immunohematology market features a moderate concentration, with a handful of multinational companies supplying integrated analyzer-reagent portfolios and a long tail of regional specialists. Leading firms emphasize closed-system architectures that secure consumable revenues while ensuring regulatory compliance. AI-enhanced analyzers and genotyping modules are the main axes of product differentiation. Strategic acquisitions continue; for instance, several diagnostic conglomerates absorbed niche reagent manufacturers in 2024 to bolster antibody panel breadth.
Geographic expansion strategies target Asia-Pacific and selected Middle-East markets where infrastructure growth is strongest. Vendors establish local service hubs and regulatory-affairs teams to navigate country-specific approvals. Point-of-care solutions are moving from pilot to commercial launch as trauma programs push blood products into ambulances and rural clinics. The FDA’s 2024 approved list highlights new automated cell-separation devices that complement advanced immunohematology workflows[3].
Disruptive entrants focus on molecular platforms that shorten turnaround for genotype-matched blood and on reagent cartridges that combine serology with digital imaging. Established manufacturers respond by adding genotyping add-ons to existing analyzers, bundling them into reagent-rental frameworks that lock in multi-year consumable contracts.
Immunohematology Industry Leaders
-
Grifols S.A.
-
Immucor Inc.
-
Thermo Fisher Scientific
-
Merck KGaA
-
Abbott Laboratories
- *Disclaimer: Major Players sorted in no particular order
Immunohematology Market Companies Covered in this Report
- Abbott Laboratories
- Beckton Dickinson
- Becton Dickinson & Co.
- Bio-Rad Laboratories
- Cardinal Health
- Roche
- Grifols
- Immucor
- Merck
- Ortho Clinical Diagnostics
- Siemens Healthineers
- Thermo Fisher Scientific
- bioMérieux
- DiaSorin
- Quotient Limited
- Fresenius
- BAG-Diagnostics GmbH
- Inno-Train Diagnostik
- Tulip Diagnostics
- HemoCue AB (Radiometer)
Market Opportunities and Future Outlook
Automation is pushing more standardization across transfusion services, creating room for modular, track-enabled immunohematology systems and lab-wide connectivity that cut manual steps and support universal antibody-screening workflows. Grifols introduced Evanzys IH in June 2026 as a modular, fully automated system, and its March 2025 partnership with Inpeco to integrate FlexLab X robotics and software points to a stronger buying preference for integrated analyzer-reagent-automation ecosystems rather than standalone instruments. For sites that cannot support fully automated analyzer capex, reagent-rental and shared-service models are broadening the practical customer base for mid-to-high throughput platforms when those offerings bundle service, connectivity, and reagents.
Molecular immunohematology and high-resolution typing are also moving beyond niche reference labs into wider workflows for complex patients, including multi-transfused and transplant-linked pathways, where faster resolution and better matching are needed. Werfen launched NanoTYPE HLA-11 Plus CE in May 2026, and CareDx introduced AlloSeq Nano in April 2026, both reinforcing demand for genotyping-enabled solutions alongside serology for antibody investigation and donor-recipient matching. Near-term compliance requirements continue to shape investment priorities: EU steps to enforce key EUDAMED modules by May 2026 increase focus on UDI/device registration and post-market processes for IVD portfolios, which tends to favor suppliers that can operationalize connectivity, documentation, and lifecycle surveillance across instruments and reagents.
Recent Industry Developments in Immunohematology Market
- June 2026: Grifols launched Evanzys IH, a modular, fully automated, track-enabled immunohematology system introduced at the ISBT Congress. The launch advances total lab automation and connected workflows in transfusion medicine laboratories. It also supports the shift toward integrated analyzer and reagent ecosystems that can be scaled by site volume.
- October 2025: Grifols began manufacturing DG Gel cards and reagent red blood cells (RRBCs) at its new San Diego, California facility following FDA approval. Localized production is intended to improve supply resilience for high-volume routine testing where reagents are the largest spend line item. It also improves responsiveness for US customers that standardize on closed-system consumables.
- October 2024: Werfen completed the acquisition of Omixon, a Hungary-based next-generation sequencing company focused on transplant diagnostics. The deal expands Werfen's capabilities in sequencing-based typing that complements immunohematology and complex matching workflows. It reinforces the convergence between serology-driven transfusion testing and molecular methods for higher-resolution characterization.
Immunohematology Market Report Scope and Research Methodology
Market Definition and Coverage
For this study, the immunohematology market covers the products used to determine blood group antigens and clinically relevant antibodies that support safe transfusion and related testing in routine lab workflows.
Scope exclusions: We exclude blood collection, blood storage consumables, transfusion bags, and blood screening for infectious diseases.
Segments Covered in This Report
- By Product
- Immunohematology Analyzers
- Semi-Automated
- Fully Automated
- Immunohematology Reagents
- Red-Cell Reagents
- Antisera Reagents
- Enhancement & Control Solutions
- Immunohematology Analyzers
- By Application
- Blood Grouping (ABO/Rh)
- Antibody Screening & Identification
- Cross-Matching
- Prenatal & Neonatal Testing
- By End User
- Hospitals
- Diagnostic Laboratories
- Blood Banks & Transfusion Centers
- Research & Academic Institutes
- Geography
- North America
- United States
- Canada
- Mexico
- Europe
- Germany
- United Kingdom
- France
- Italy
- Spain
- Rest of Europe
- Asia-Pacific
- China
- Japan
- India
- South Korea
- Australia
- Rest of Asia-Pacific
- Middle East and Africa
- GCC
- South Africa
- Rest of Middle East and Africa
- South America
- Brazil
- Argentina
- Rest of South America
- North America
Data Sources, Market Sizing, and Validation
Desk Research
Desk work started with mapping the demand pool, where transfusion activity and testing intensity were used as practical anchors for volumes and utilization. We reviewed public sources such as WHO blood safety and blood supply publications, CDC materials on transfusion safety, and national blood service reports that summarize collections, transfusions, and testing practices by country.
To translate demand signals into market value, we reviewed product descriptions, pipeline notes, and pricing cues from publicly available regulatory and technical references, including FDA databases, EUDAMED, and EU guidance pages, along with peer-reviewed hematology and transfusion medicine journals. Company filings, investor presentations, and reputable press were also used to cross-check product mix, automation trends, and geographic exposure. When needed, a paid subscription focused on company financials and news was used only to confirm reported revenue splits and recent expansion announcements. These desk sources are illustrative, and we also relied on other public documents to verify figures and clarify assumptions.
Primary Interviews and Surveys
Primary interviews and short surveys focused on blood bank leaders, hospital lab managers, diagnostic lab supervisors, and distributor teams who can describe ordering patterns and workflow shifts. We used this respondent input to validate how quickly automation is being adopted, how reagent menus are changing, and how pricing differs by region, then cross-checked those statements against the modeled volumes and value totals.
Distribution of primary research fieldwork respondents
| Company type | Respondent position | Region |
|---|---|---|
| Top tier: 26% | CXOs: 17% | APAC: 47% |
| Mid tier: 56% | Functional/Unit leaders: 40% | EMEA: 33% |
| Smaller Players: 18% | Managers: 43% | Americas: 20% |
Market-Sizing & Forecasting
We sized the market using a top-down build that reconstructs testing demand from transfusion activity and lab workload indicators, then translates those inputs into instrument utilization and reagent consumption. After building the initial totals, we used selective bottom-up approximations as a check, for example by linking sampled ASP to estimated annual test volumes for common workflows and using distributor-led channel checks for high-penetration countries.
Key model inputs included annual transfusion volume trends, the share of testing performed in hospitals versus stand-alone labs, automation penetration by end user, average tests per patient episode (including repeat and confirmatory steps), and reagent menu mix across ABO/Rh typing, antibody screening and identification, and crossmatching. When a country had limited disclosure on installed base or workflow intensity, we used proxy ratios from comparable healthcare systems, then validated those proxies with primary feedback to ensure they stayed aligned with ground-level practice.
For forecasting, we used scenario analysis because analyzer adoption cycles and reagent pull-through can shift quickly with procurement budgets and safety guidelines. The scenarios were anchored on expected transfusion demand, automation upgrade timing, and realistic ASP progression, and then refined with the consensus ranges shared by interviewees for each major region.
Data Validation & Update Cycle
Before finalizing results, we ran consistency checks across regions to confirm that instrument value, reagent value, and implied tests per analyzer stayed consistent with known lab throughput norms. Outliers were flagged early, and the assumptions behind them were re-reviewed, followed by targeted re-contacts when variance could not be explained using public signals.
A second analyst review ensured each input had a clear source trail and that the final totals reconcile across the main demand indicators. Reports refresh annually, and interim updates are triggered when material events occur (for example, major regulatory shifts or large procurement waves). Right before delivery, we do a fresh pass to incorporate the latest public releases and confirm the market model still aligns with the most recent demand and pricing cues.
Mordor Intelligence's Immunohematology Market Size Compared Against Other Published Estimates
Published market values for immunohematology can vary widely because the scope can shift between adjacent testing areas, and because pricing and utilization assumptions are not always fully disclosed. Differences also come from whether companies treat instruments separately from reagent pull-through, and from the year and currency timing used for conversions.
Infectious disease blood screening tests and related NAT assay kits sit outside Mordor Intelligence's scope here, which narrows the value pool versus estimates that bundle transfusion diagnostics more broadly. The spread is also influenced by how analyzer pricing is modeled using procurement-heavy years, whether reagent ASP is escalated uniformly or by region, and how quickly automation penetration is assumed to move in smaller labs where adoption tends to be slower.
Benchmark comparison
| Source | Market Size | Gaps in Research Methodology |
|---|---|---|
| Mordor Intelligence | USD 2.64 B (2026) | |
| Trade Journal A | USD 2.98 B (2026) | Uses a broader transfusion diagnostics definition that can pull in infectious disease screening and related consumables, and it applies a single global ASP uplift without separating hospital and blood bank purchase patterns. |
| Industry Portal B | USD 2.45 B (2024) | Reports an earlier-year value and does not clearly adjust for the analyzer replacement cycle, which can understate years with higher capital spending and the reagent pull-through that follows new placements. |
The table shows that most gaps are explained by what gets counted alongside immunohematology, followed by how pricing is carried forward between years. By keeping the value tied to test-demand signals and checked against utilization and pricing realities shared in interviews, we arrive at a market size that is easier to replicate and update.
Key Questions Answered in the Report
How large is the immunohematology market in 2026?
The immunohematology market size is USD 2.64 billion in 2026 and is forecast to grow at a 5.88% CAGR over 2026-2031.
Which region is growing the fastest for immunohematology?
Asia-Pacific is projected to expand at a 9.40% CAGR thanks to healthcare infrastructure investment, broader access to diagnostics, and rising surgical volumes.
What product segment dominates immunohematology revenues?
Reagents lead with 56.68% revenue share in 2025 because every test consumes multiple reagent vials.
Why are AI-enabled analyzers gaining popularity?
AI modules interpret antibody reactions quickly, cut turnaround time, and reduce error rates, making them attractive amid workforce shortages and rising test volumes.
What is driving demand for antibody screening?
Universal screening mandates, multi-transfused patient populations, and rising hemoglobinopathy cases are pushing antibody screening and identification to a 12.10% CAGR.
How does analyzer cost affect smaller laboratories?
Fully automated analyzers can exceed USD 500,000, leading smaller labs to delay adoption or outsource testing to centralized facilities.