
Immunoglobulin Market Size and Share
Market Overview
| Study Period | 2020 - 2031 |
|---|---|
| Market Size (2026) | USD 18.39 Billion |
| Market Size (2031) | USD 25.15 Billion |
| Growth Rate (2026 - 2031) | 6.46 % |
| Fastest Growing Market | Asia Pacific |
| Largest Market | North America |
| Market Concentration | Medium |
Major Players *Disclaimer: Major Players sorted in no particular order Image © Mordor Intelligence. Reuse requires attribution under CC BY 4.0. | |
Immunoglobulin Market Analysis by Mordor Intelligence
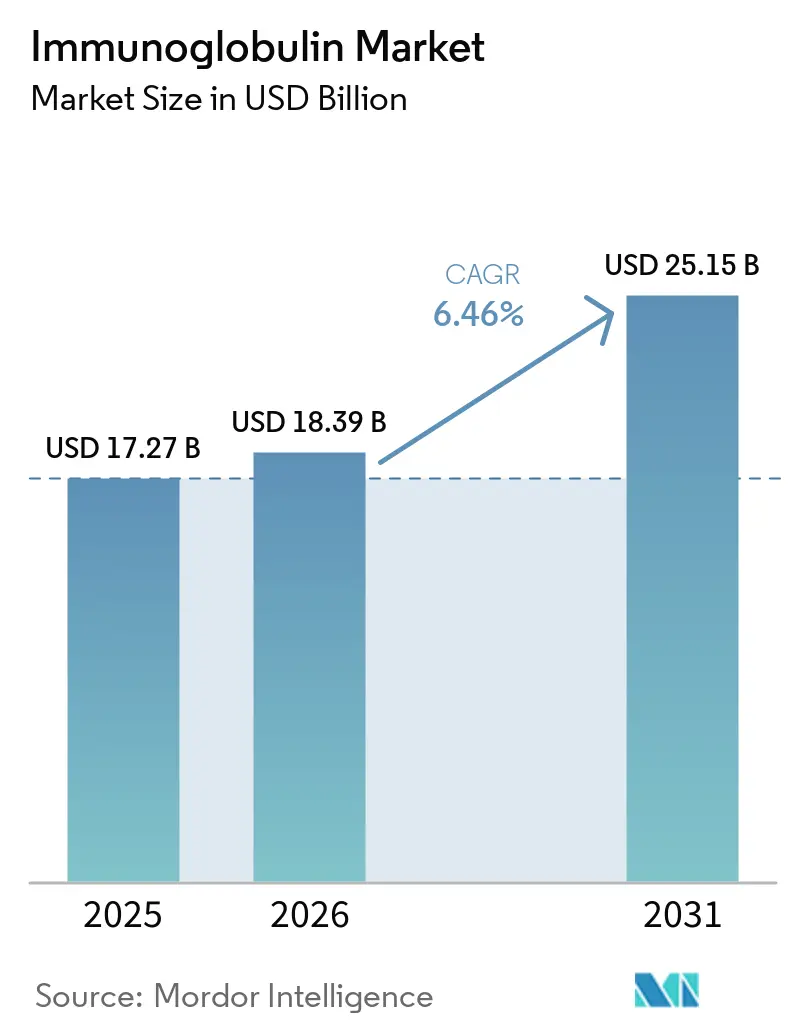
The Immunoglobulin Market size is projected to expand from USD 17.27 billion in 2025 and USD 18.39 billion in 2026 to USD 25.15 billion by 2031, registering a CAGR of 6.46% between 2026 to 2031.
Sustained demand stems from early genetic diagnosis of primary immunodeficiency, payer-backed migration to home-based treatment, and high-concentration subcutaneous formulations that shorten infusion time. Vertical integration of plasma collection protects supply yet raises capital intensity, while AI-enabled donor recruitment is lifting center utilization in North America and Europe. On the competitive front, Takeda, CSL Behring, and Grifols are expanding fractionation footprints ahead of anticipated neurology-driven volume spikes. Meanwhile, Fc-engineered monoclonal antibodies threaten intravenous immunoglobulin’s share in select autoimmune indications but remain cost-constrained niche options.
Key Report Takeaways
- By product category, IgG led with 43.55% of Immunoglobulin market share in 2025. IgE formulations are forecast to expand at a 9.85% CAGR through 2031.
- By mode of delivery, intravenous immunoglobulin accounted for 64.53% share in 2025. Subcutaneous immunoglobulin is advancing at a 8.24% CAGR to 2031.
- By application, primary immunodeficiency disease captured 28.15% revenue share in 2025. Chronic inflammatory demyelinating polyneuropathy is the fastest-growing indication at a 10.82% CAGR to 2031.
- By distribution channel, hospital pharmacies held 64.52% share in 2025. Online and home-infusion providers are rising at a 9.12% CAGR over the forecast period.
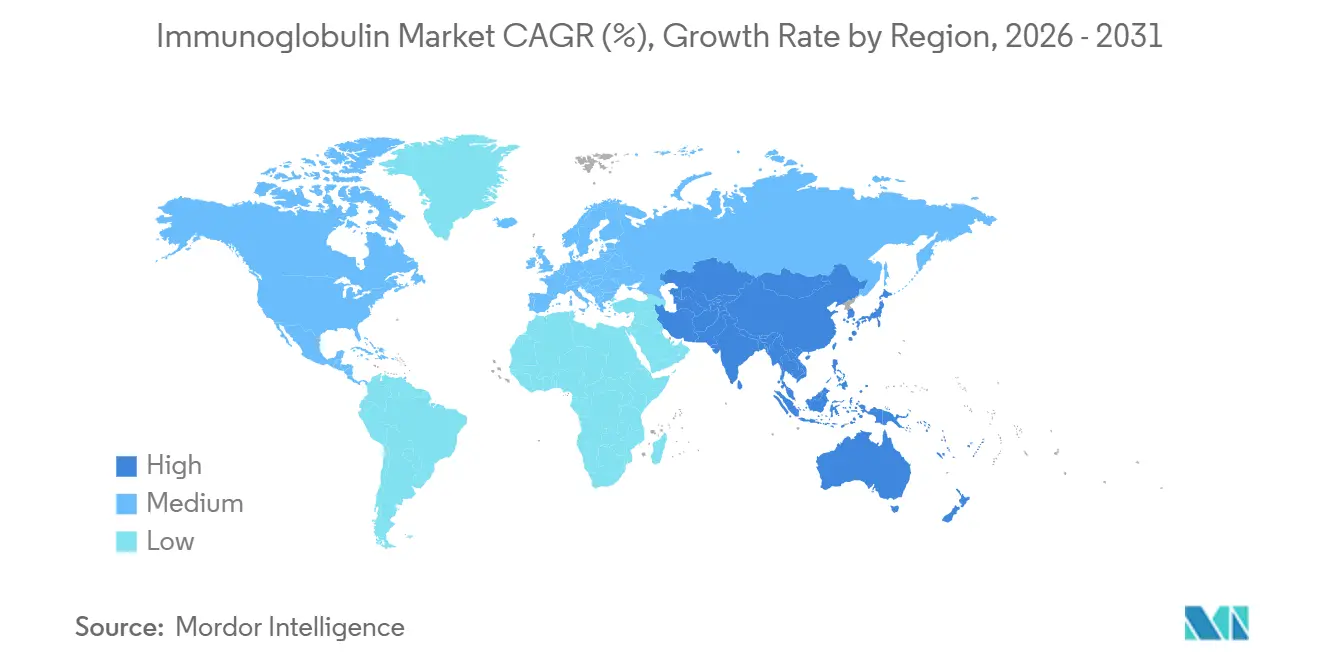
- By geography, North America led with 44.55% revenue share in 2025. Asia-Pacific is set to grow at a 7.72% CAGR through 2031.
Note: Market size and forecast figures in this report are generated using Mordor Intelligence’s proprietary estimation framework, updated with the latest available data and insights as of 2026.
Market Trends and Insights
Drivers Impact Analysis of Immunoglobulin Market*
| Driver | ( ) % Impact on CAGR Forecast | Geographic Relevance | Impact Timeline |
|---|---|---|---|
| Rising prevalence of primary immunodeficiency diseases | +1.2% | North America, Europe, emerging Asia-Pacific | Medium term (2-4 years) |
| Growing IVIG use in neurology | +1.5% | North America, Europe, Japan, South Korea | Medium term (2-4 years) |
| Expansion of global plasma-fractionation capacity | +1.8% | China, Japan, spill-over to North America | Long term (≥ 4 years) |
| Favorable reimbursement and diagnostics uptake | +0.9% | North America, Western Europe, Australia | Short term (≤ 2 years) |
| AI-driven plasma-supply optimization | +0.7% | Pilot centers in North America and Europe | Medium term (2-4 years) |
| On-body high-concentration SCIG devices | +1.1% | Japan, Germany, United States | Short term (≤ 2 years) |
| Source: Mordor Intelligence | |||
Rising Prevalence of Primary Immunodeficiency Diseases
Newborn screening and next-generation sequencing are revealing 40% more primary immunodeficiency cases than earlier estimates, expanding the eligible patient pool for lifelong replacement therapy. Insurance mandates in the United States and Western Europe cut time-to-diagnosis from eight years to under 18 months, yet Asia-Pacific lags by up to seven years despite China’s pilot programs that may add 15,000-20,000 new diagnoses annually by 2029. Earlier detection lowers per-dose volumes but extends treatment duration, magnifying cumulative plasma demand. The resulting strain reinforces manufacturer investment in collection centers even as reimbursement shifts care out of hospitals. Sustaining this driver beyond 2028 will depend on ongoing declines in genetic testing costs and parallel reimbursement expansion.
Growing IVIG Use in Neurology (CIDP, GBS, MMN)
FDA guideline updates in early 2025 positioned IVIG ahead of corticosteroids for chronic inflammatory demyelinating polyneuropathy, Guillain-Barré syndrome, and multifocal motor neuropathy. Japan’s December 2024 approval of HYQVIA enabled monthly home dosing that bypasses intravenous access, accelerating neurologist uptake[1]. Off-label adoption in stiff-person syndrome and autoimmune encephalitis is broadening demand, though high doses intensify plasma-supply competition and elevate annual therapy costs to USD 80,000-120,000. European payers now require head-to-head data versus rituximab, which could temper growth after 2028. Near-term, neurology adds 1.5 percentage points to the Immunoglobulin market CAGR.
Expansion of Global Plasma-Fractionation Capacity
Takeda’s USD 670 million Osaka expansion will deliver 1.2 million liters of new capacity by 2027, cutting Japan’s reliance on North American imports by 35%. Shanghai RAAS and Hualan Biological gained export-quality certifications, allowing them to pivot toward higher-margin IgG production for domestic demand. While Asia-Pacific plants operate below capacity today, commissioning and GMP validation require four to six years, delaying meaningful relief until after 2028. In the interim, allocation shortages remain likely if neurology uptake outpaces supply additions.
On-Body High-Concentration SCIG Devices for Home Therapy
Wearable pumps delivering 20% immunoglobulin solutions have trimmed infusion time below 60 minutes and eliminated hospital visits for many patients. Health-system savings of USD 25,000-35,000 per patient annually underpin payer incentives, yet upfront device costs of USD 3,000-5,000 slow adoption, especially among elderly users uncomfortable with self-injection. Regulatory guidance for combination products is still emerging, causing manufacturers to navigate country-specific approval pathways. Despite these hurdles, SCIG technology is poised to accelerate site-of-care migration and improve adherence.
Restraints Impact Analysis of Immunoglobulin Market*
| Restraint | (~) % Impact on CAGR Forecast | Geographic Relevance | Impact Timeline |
|---|---|---|---|
| High therapy cost and reimbursement gaps | -0.8% | Latin America, Middle East, rural Asia | Short term (≤ 2 years) |
| Stringent donor-screening regulations | -0.5% | Divergent FDA, EMA, PMDA frameworks | Long term (≥ 4 years) |
| Fc-engineered monoclonal antibody substitutes | -0.6% | North America, Europe | Medium term (2-4 years) |
| Carbon-intensity scrutiny of cold-chain logistics | -0.3% | Europe first, then North America | Medium term (2-4 years) |
| Source: Mordor Intelligence | |||
High Therapy Cost & Reimbursement Gaps
Annual immunoglobulin therapy costs range from USD 50,000 for maintenance immunodeficiency to USD 120,000 for high-dose neurology, leaving most patients in Latin America and parts of Asia without coverage[2]. Argentina’s reimbursement queue stretches up to nine months, and Brazil rationed supply during 2024-2025 shortages. Because 70% of manufacturing expense arises before final fill-finish, price cuts are structurally difficult. Payers in developed markets now mandate home infusion to shave 30-40% off facility fees, but the underlying plasma cost persists, deterring new capacity investment.
Fc-Engineered Monoclonal Antibodies as Therapeutic Substitutes
Efgartigimod won FDA approval in 2024 for generalized myasthenia gravis and is in late-stage trials for other autoimmune indications. By accelerating pathogenic IgG clearance without plasma inputs, it removes supply constraints; yet its USD 150,000-180,000 price caps uptake to refractory cases. Substitution risk through 2031 is therefore limited to roughly one-fifth of addressable volume, but continued success of similar biologics could erode intravenous immunoglobulin’s foothold in neurologic care over the long term.
*Our forecasts treat driver/restraint impacts as directional, not additive. The impact forecasts reflect baseline growth, mix effects, and variable interactions.
Immunoglobulin Market Segment Analysis
By Product:
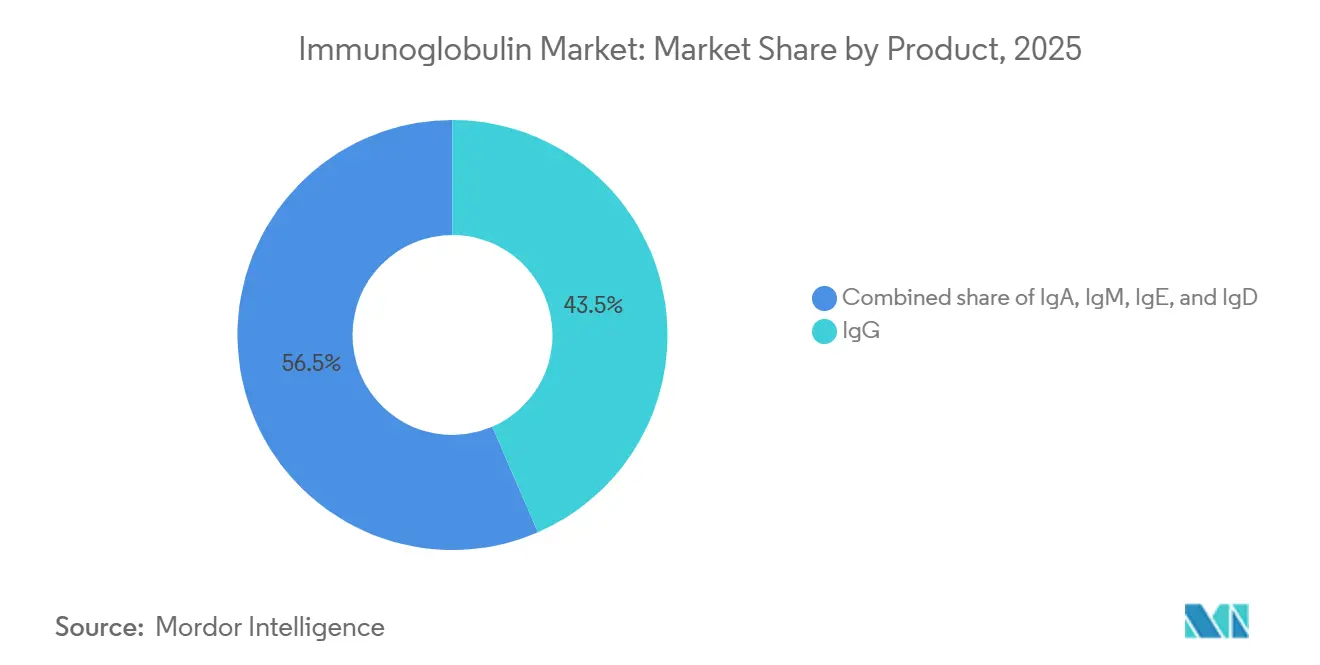
IgG Anchors Revenue, IgE Gains MomentumIgG held 43.55% of Immunoglobulin market share in 2025 on the strength of entrenched use across immunodeficiency and hematologic disorders. High-concentration IgG formulations such as Cuvitru reduce infusion time by half, boosting home-based adherence. IgE therapies, though nascent, are projected to outpace the broader Immunoglobulin market at a 9.85% CAGR on emerging eosinophilic applications. IgA and IgM remain niche but benefit from selective IgA deficiency cohorts that cannot tolerate standard products. Limited regulatory clarity for IgE endpoints tempers near-term launch certainty.
Manufacturers with advanced purification can command premium pricing for stable 20% products, yet hyaluronidase co-formulation adds USD 500-800 per dose, complicating payer negotiations. Regulatory lag for novel IgE and IgM programs may delay revenue until after 2029, but pipeline diversity positions the product mix for gradual broadening beyond IgG dominance.

By Mode of Delivery:
SCIG Disrupts IVIG HegemonyIntravenous immunoglobulin retained 64.53% revenue share in 2025, thanks to decades of clinician familiarity and hospital infusion infrastructure. Nevertheless, subcutaneous immunoglobulin is forecast to expand at 8.24% CAGR, reflecting payer push to lower facility costs and patient preference for at-home convenience. The Immunoglobulin market size linked to SCIG is poised to grow steadily as device interoperability standards mature.
Reimbursement misalignment slows transition: U.S. Medicare pays 20-30% less for subcutaneous products, and prior-authorization resets add bureaucracy. Patient self-training costs and real-time temperature monitoring further squeeze margins for specialty pharmacies. Despite these headwinds, weekly self-administration and lower adverse-event incidence support ongoing mode-shift momentum.
By Application:
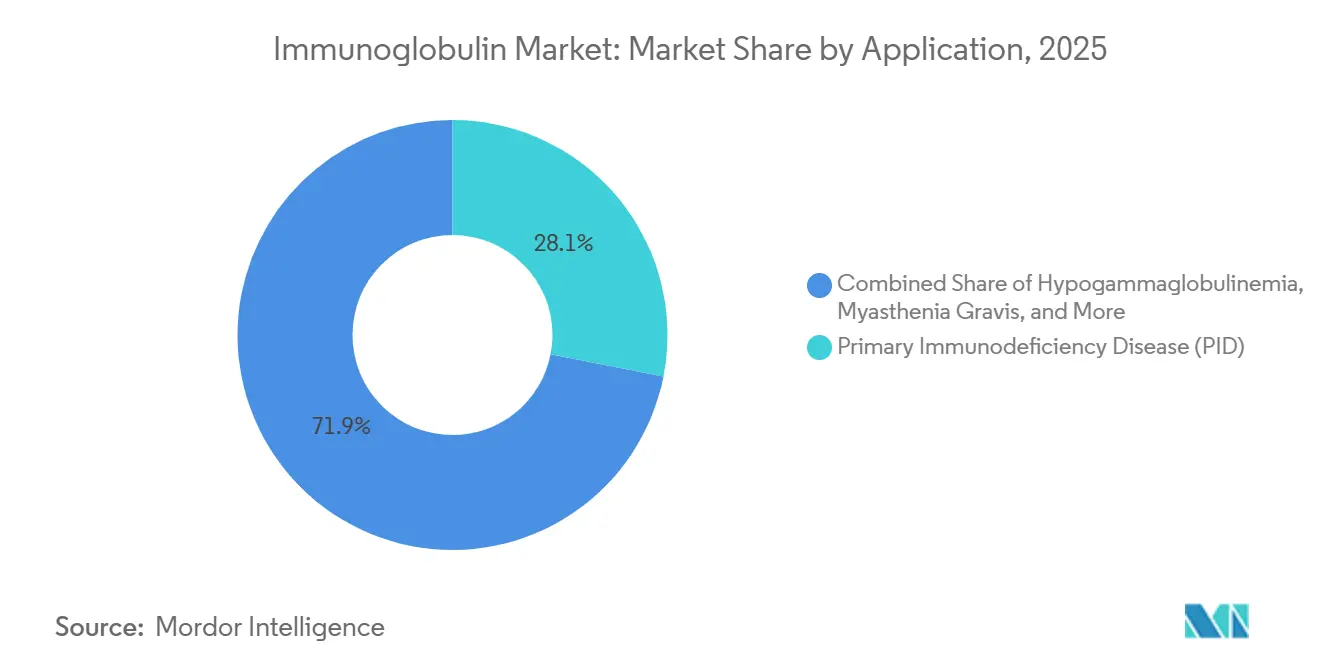
CIDP Outpaces Legacy IndicationsPrimary immunodeficiency retained 28.15% revenue share in 2025, but chronic inflammatory demyelinating polyneuropathy is steering the fastest growth at 10.82% CAGR. FDA guidance positioning IVIG as first-line therapy elevated neurological demand and widened dosing schedules. Myasthenia gravis faces competition from efgartigimod, pressuring IVIG growth in that subset.
Guillain-Barré and multifocal motor neuropathy create acute demand spikes that stretch plasma allocations. Hypogammaglobulinemia growth remains moderate yet stable. As neurology’s share rises, per-patient gram utilization lifts the Immunoglobulin market size disproportionately, straining fractionation capacity and distribution logistics.
By Distribution Channel:
Home Infusion Captures ShareHospital pharmacies commanded 64.52% of sales in 2025, but online and home-infusion providers are climbing at 9.12% CAGR. Payers realize 30-40% cost savings by shifting stable patients out of hospital suites, reinforcing SCIG adoption. Specialty pharmacies sit between channels, serving rural areas lacking logistics infrastructure.
Cold-chain delivery at 2-8 °C costs USD 150-300 per shipment and no-show waste erodes profitability. Tighter FDA temperature-excursion guidance will require IoT trackers, adding 10-15% to distribution costs. Nonetheless, embedded nurse support and digital adherence tools position home-infusion networks to capture incremental share as self-administration confidence grows.
Geography Analysis
North America and Europe Immunoglobulin Market
North America remained the largest regional contributor with 44.55% revenue share in 2025 on unrivaled per-capita usage and over 900 licensed plasma centers. Growth is moderating to mid-single digits as donor saturation and payer pressure constrain expansion. Europe follows, where EMA’s 2024 pathogen-safety upgrade lengthened batch-release cycles by up to six weeks and lifted spot prices 15-20%[3].
APAC Immunoglobulin Market
Asia-Pacific is the fastest-growing territory at 7.72% CAGR, propelled by China’s new export-quality certifications and Japan’s CIDP-focused HYQVIA launch. India’s Immunoglobulin market faces infrastructure and affordability gaps, limiting rural reach. Australia and South Korea track mature-market trends at 4-5% growth while expanding newborn screening.
MEA and South America Immunoglobulin Market
South America and the Middle East trail amid funding constraints, though Gulf Cooperation Council countries are widening rare-disease budgets. Supply rationing in Brazil and Argentina underscores cost barriers and justifies manufacturers’ vertical-integration push. Africa’s demand is small but rising with concentrated initiatives in South Africa and Nigeria to address severe combined immunodeficiency.
Regulatory Landscape
In the United States, IVIG and SCIG products are regulated as biologics under FDA CBER, with availability reflected through the agency's immune globulins listings and ongoing lifecycle oversight for marketed BLAs such as QIVIGY (BLA 125822) and YIMMUGO (BLA 125810). Payer utilization also shapes access, as large plans refine medical policy criteria for IVIG coverage and site-of-care requirements while home infusion and specialty pharmacy dispensing expand.
In Europe, regulatory actions increasingly emphasize safety standards and supply continuity. In March 2026, the EMA adopted Revision 2 updates to its scientific guidance for clinical investigation of human normal immunoglobulin for subcutaneous/intramuscular administration and the related core SmPC guidance, tightening expectations for evidence packages supporting SCIg/IMIg use. Separately, the EMA and the Heads of Medicines Agencies (HMA) Executive Steering Group on Shortages and Safety of Medicinal Products (MSSG), alongside EDQM initiatives, have highlighted vulnerabilities in Anti-D immunoglobulin supply chains and continued reliance on plasma collected outside Europe, keeping regulatory focus on resilience and plasma sustainability.
Competitive Landscape
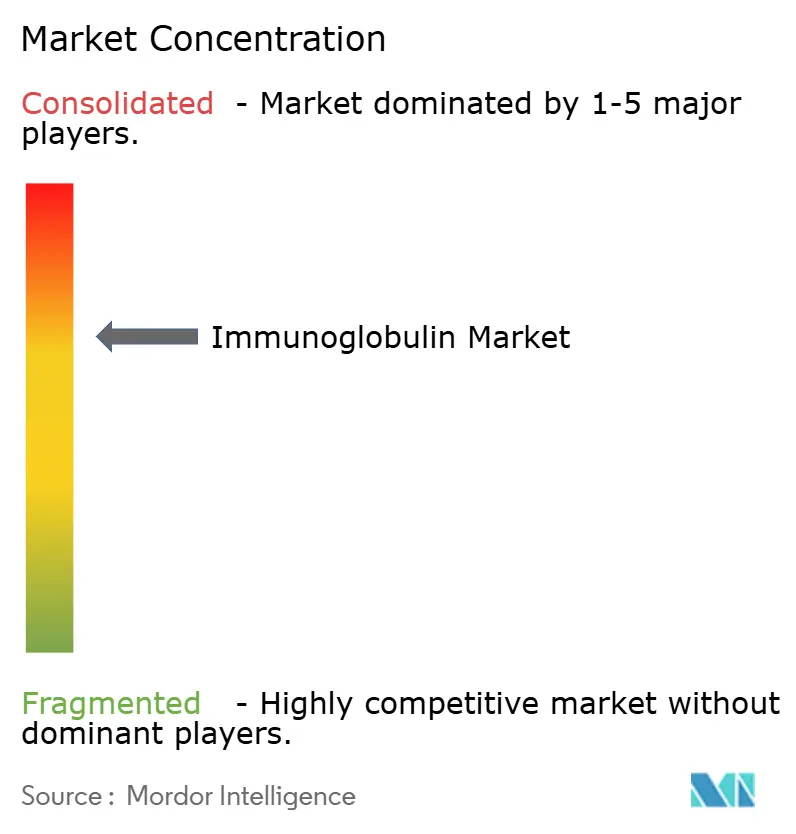
The Immunoglobulin market is moderately concentrated: the top five players—CSL Behring, Takeda, Grifols, Octapharma, and Baxter—account for a significant share of global revenue. Each operates extensive plasma-collection networks, with CSL’s fleet topping 300 centers worldwide. Takeda’s Osaka upgrade adds 1.2 million liters of capacity by 2027, while CSL’s Kankakee, Illinois, site will add 800,000 liters in 2025.
AI-based donor scheduling boosts utilization 12-18%, an edge incumbents are scaling quickly. Regional champions like Shanghai RAAS focus on domestic Asia-Pacific demand, insulated by limited cross-border plasma flows. Absence of biosimilar pathways preserves pricing but invites scrutiny from payers seeking alternatives; monoclonal antibodies such as efgartigimod offer the first credible non-plasma substitute albeit at premium cost.
Subcutaneous innovation is a competitive hotspot: HYQVIA’s Japanese label extension validated high-concentration home dosing, prompting rivals to accelerate similar programs. Smaller firms including ADMA Biologics pursue hyper-immune niches that command 2-3× revenue per liter but face scale constraints. Harmonized FDA-EMA-PMDA safety standards shorten global launch lag to under two years, favoring multiregional players equipped for simultaneous filings.
Immunoglobulin Industry Leaders
-
Baxter International Inc.
-
CSL Behring
-
Grifols S.A.
-
Takeda Pharmaceutical Co.
-
Octapharma AG
- *Disclaimer: Major Players sorted in no particular order
Immunoglobulin Market Companies Covered in this Report
- ADMA Biologics
- Baxter
- Bio Products Laboratory (BPL)
- Biotest
- China Biologic Products
- CSL Behring
- Emergent Bio Solutions
- GC Biopharma
- Green Cross Corp.
- Grifols
- Hualan Biological Engineering
- Kamada Ltd.
- Kedrion Biopharma
- LFB Group
- Octapharma
- Pfizer
- Sanquin
- Shanghai RAAS Blood Products
- Takeda Pharmaceutical Co.
Market Opportunities and Future Outlook
Manufacturing yield and plasma processing scale represent key white-space as suppliers operate within constrained plasma feedstock while neurology and home-based use broaden demand. Incumbents' capital programs also point to a multi-year buildout cycle: CSL Behring began a major expansion in Kankakee, Illinois in March 2026 that incorporates Horizon 2 technology to increase immunoglobulin output from existing plasma volumes, while Kedrion announced a EUR 150 million investment in May 2026 to expand its Bolognana, Italy hub with a stated goal of tripling annual plasma processing capacity to 3.3 million liters. Grifols also communicated a EUR 160 million investment in July 2025 for a new site in Llica de Vall, Spain to expand European fractionation capacity, aligning with market needs to reduce exposure to regional shortages and lengthy batch-release cycles.
Beyond replacement therapy, product and use-case expansion creates additional opportunity pockets. In Europe, CSL's Privigen gained European Commission authorization in June 2026 for measles pre- and post-exposure prophylaxis in individuals where vaccination is contraindicated, adding demand tied to public health needs rather than only chronic immunology. On the modality side, high-concentration subcutaneous regimens and hyaluronidase-enabled options continue to shift administration toward home settings, and Takeda's May 2026 pivotal readout for TAK-881 (SCIG 20% with recombinant human hyaluronidase) supports ongoing development aimed at reducing infusion volume and improving at-home feasibility. This supports home-infusion providers and cold-chain distribution networks as adoption expands.
Recent Industry Developments in Immunoglobulin Market
- June 2026: The European Commission granted marketing authorization for CSL's Privigen for measles pre- and post-exposure prophylaxis in individuals where vaccination is contraindicated. This broadens immunoglobulin demand into outbreak-response and preventive use cases, expanding the addressable market beyond chronic replacement therapy.
- October 2025: Grifols and Biotest launched Yimmugo in the United States, supported by supply from Biotest's FDA-certified Next Level production facility in Dreieich, Germany. The launch strengthens competitive intensity in IVIG while underscoring how certified fractionation and fill-finish infrastructure translates into commercial access in major markets.
- July 2024: Grifols received an expanded US label for XEMBIFY, its subcutaneous immunoglobulin, strengthening its SCIG portfolio. The update supports continued site-of-care migration toward home therapy and increases choice in high-concentration subcutaneous options for long-term management.
Immunoglobulin Market Report Scope and Research Methodology
Market Definition and Coverage
For this study, the immunoglobulin market covers revenue from therapeutic immunoglobulin products used in clinical care, across major routes of administration and healthcare settings, and counted at the point of sale into the healthcare system by geography.
Scope exclusions: We exclude non-therapeutic lab reagents, diagnostic-only immunoglobulin uses, and blood collection services that are not part of the finished immunoglobulin product value.
Segments Covered in This Report
- By Product
- IgG
- IgA
- IgM
- IgE
- IgD
- By Mode of Delivery
- Intravenous (IVIG)
- Subcutaneous (SCIG)
- Intramuscular
- By Application
- Hypogammaglobulinemia
- Primary Immunodeficiency Disease (PID)
- Chronic Inflammatory Demyelinating Polyneuropathy (CIDP)
- Myasthenia Gravis
- Immune Thrombocytopenia Purpura (ITP)
- Other Applications
- By Distribution Channel
- Hospital Pharmacies
- Specialty / Retail Pharmacies
- Online & Home-Infusion Providers
- Geography
- North America
- United States
- Canada
- Mexico
- Europe
- Germany
- United Kingdom
- France
- Italy
- Spain
- Rest of Europe
- Asia-Pacific
- China
- India
- Japan
- Australia
- South Korea
- Rest of Asia-Pacific
- Middle East and Africa
- GCC
- South Africa
- Rest of Middle East and Africa
- South America
- Brazil
- Argentina
- Rest of South America
- North America
Data Sources, Market Sizing, and Validation
Desk Research
Desk work starts by mapping how immunoglobulin supply is created and allocated, since plasma collection, fractionation capacity, and country-level access rules shape the available demand pool. We review public health sources such as the World Health Organization, the US FDA, and the European Medicines Agency to track product approvals, safety updates, and label expansions that can shift demand by indication.
To ground volume and access assumptions, we also refer to sources such as the US CDC and national health ministries for diagnosis and treatment patterns in immune deficiency and key neurology use cases, followed by trade and customs statistics where available to sanity check cross-border flows of plasma-derived therapies. Company annual reports, investor decks, and reputable press are then used to capture capacity additions, plasma center expansion, and pricing commentary. Where coverage is thin, a paid subscription focused on company financials and another on shipment-level import and export data may be used to fill gaps. The desk sources listed are illustrative only, and many other public and paid references are used during data collection, cross-checking, and clarification.
Primary Interviews and Surveys
Primary work is used to pressure-test what we learned from public material, especially on demand drivers that are hard to observe directly, such as shifts from IV to subcutaneous therapy, home-infusion adoption, and hospital formulary preferences. We speak with a mix of stakeholders across plasma-derived therapy supply, specialty distribution, and prescribing or infusion settings, and we cover perspectives across APAC, EMEA, and the Americas so regional access and reimbursement differences are reflected in the assumptions.
Distribution of primary research fieldwork respondents
| Company type | Respondent position | Region |
|---|---|---|
| Top tier: 34% | CXOs: 22% | APAC: 45% |
| Mid tier: 44% | Functional/Unit leaders: 23% | EMEA: 37% |
| Smaller Players: 22% | Managers: 55% | Americas: 18% |
Market-Sizing & Forecasting
Sizing is built using both top-down and bottom-up logic, starting with a demand pool reconstructed from treated patients and typical dosing across the major immunoglobulin use cases, then shaped by access constraints. For immunoglobulin, we focus on a few practical inputs, including diagnosed prevalence for primary immunodeficiency and selected neurology conditions, the split between IV and subcutaneous administration, average grams per patient per year, and the share of patients treated in hospitals versus home infusion, since that affects channel pricing and utilization.
Those demand signals are then converted into value using observed price bands and mix shifts, with extra care around currency timing and inflation effects that can distort year-on-year comparisons. To corroborate the totals, we use selective bottom-up approximations, such as supplier revenue splits by therapy area, country-level channel checks, and sampled price per gram multiplied by estimated grams consumed. Where data gaps remain, we proxy from clinically similar markets and then re-check with experts.
For forecasting, scenario analysis is used because supply growth is constrained and step changes can occur when new fractionation capacity comes online or when reimbursement expands. The forward view is guided by expected plasma collection growth, capacity utilization ramp-up, label expansions, and the likely pace of SCIG uptake, and these are reconciled with what respondents describe as realistic over the next 3 to 5 years.
Data Validation & Update Cycle
Validation is done in layers so the model does not rely on a single data series. We compare outputs against independent signals such as route mix trends, regional revenue shares, and publicly visible capacity additions, and we investigate large variances before internal sign-off.
If assumptions shift materially, such as a major safety update, a capacity disruption, or a meaningful reimbursement change, experts are re-contacted and the affected parts of the model are recalculated. Reports are refreshed annually, with interim updates when market-moving events occur, followed by a final pre-delivery review so the client receives the most current view.
Mordor Intelligence's Immunoglobulin Market Estimate Compared With Other Published Estimates
Published immunoglobulin market values can vary quite a bit because the market boundary is not always treated the same, and because the underlying demand pool is difficult to observe directly. Differences in whether routes, settings of care, and indications are fully counted, and how pricing is carried forward, usually explain most of the spread.
By tracking grams-per-patient assumptions, route-of-administration mix, and annual pricing refreshes, Mordor Intelligence keeps the value model tied to treated demand and avoids mixing adjacent plasma-derived categories into the same total. Some publications also use longer forecast windows or more aggressive scenario paths, which can lift the reported current-year value when back-casting is not aligned to the same set of capacity and access constraints.
Benchmark comparison
| Source | Market Size | Gaps in Research Methodology |
|---|---|---|
| Mordor Intelligence | USD 17.27 B (2025) | |
| Global Consultancy A | USD 22.15 B (2025) | This estimate appears to assume a broader priced demand pool in 2025, which can happen when homecare expansion and indication coverage are generalized across regions without the same access and utilization constraints. |
| Industry Publisher B | USD 15.35 B (2025) | This estimate likely leans on a more conservative 2025 base by applying tighter pricing or slower uptake assumptions for high-dose neurology use and route switching, which reduces implied grams consumed and the resulting value. |
The table shows that the gap is mainly created by how demand is translated into grams and then into revenue, and by how quickly price and mix are updated across regions. Our approach stays repeatable by tying each year to a small set of observable healthcare and supply signals, and then adjusting only where interviews confirm a real change.
Key Questions Answered in the Report
What is the current value of the Immunoglobulin market?
The Immunoglobulin market size reached USD 17.27 billion in 2025 and is on track for USD 18.39 billion in 2026.
How fast will global Immunoglobulin demand grow over the next five years?
Demand is projected to rise at a 6.46% CAGR from 2026 to 2031 as diagnostics broaden and home infusion gains traction.
Which product class leads sales?
IgG accounts for 43.55% of revenue, far ahead of other immunoglobulin isotypes.
Why is subcutaneous delivery gaining share?
High-concentration formulations and wearable pumps let patients self-administer at home, cutting facility costs by up to 40%.
Which region will post the fastest growth?
Asia-Pacific is forecast to expand at 7.72% CAGR thanks to China's new fractionation capacity and Japans neurology approvals.
Are monoclonal antibodies a real threat to IVIG?
Fc-engineered antibodies like efgartigimod can replace IVIG in select autoimmune diseases but currently cost 30-50% more, limiting near-term impact.