
Image Guided Therapy System Market Size and Share
Market Overview
| Study Period | 2020 - 2031 |
|---|---|
| Forecast Data Period | 2026 - 2031 |
| Market Size (2026) | USD 5.67 Billion |
| Market Size (2031) | USD 7.27 Billion |
| Growth Rate (2026 - 2031) | 5.12 % |
| Fastest Growing Market | Asia Pacific |
| Largest Market | North America |
Major Players *Disclaimer: Major Players sorted in no particular order Image © Mordor Intelligence. Reuse requires attribution under CC BY 4.0. | |
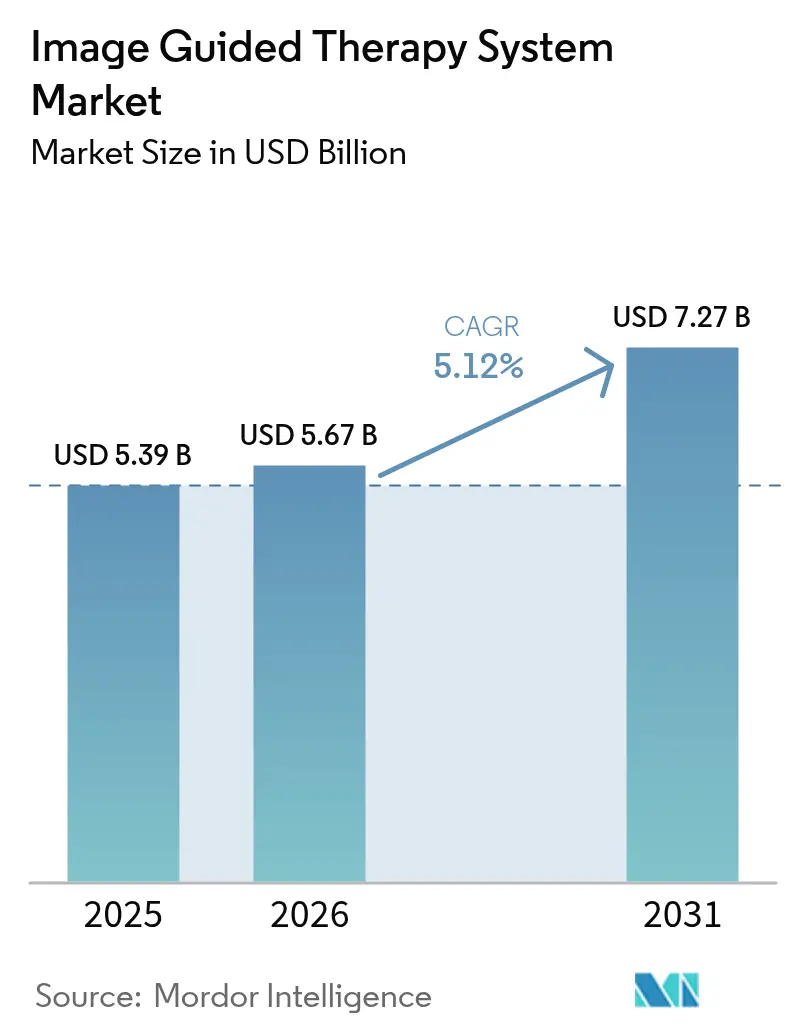
Image Guided Therapy System Market Analysis by Mordor Intelligence
The Image Guided Therapy System market size is expected to grow from USD 5.39 billion in 2025 to USD 5.67 billion in 2026 and is forecast to reach USD 7.27 billion by 2031 at 5.12% CAGR over 2026-2031. Growth now stems from deeper platform integration, where AI-enhanced, multi-modality suites replace stand-alone imaging units. Software-centric innovation sharpens procedural accuracy, while regulatory alignment around interoperability and device cybersecurity lowers switching costs for health systems. Capital flows concentrate on hybrid operating rooms (ORs) that merge electromagnetic navigation, real-time MRI and robotic manipulation. Training bottlenecks for the 14-person teams often required inside hybrid ORs temper near-term growth, yet long-run demand benefits from an aging population, rising chronic-disease incidence and the clinical push toward minimally invasive care.
Key Report Takeaways
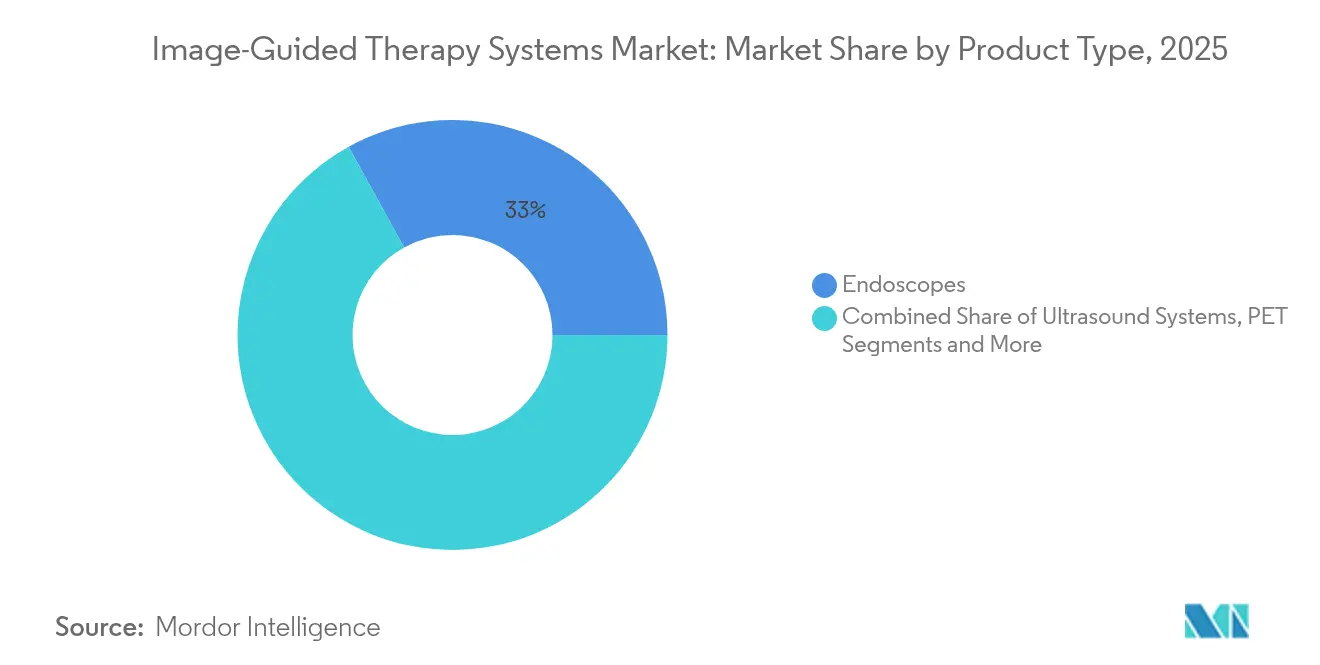
- By product category, endoscopes held 33.02% of the Image Guided Therapy System market share in 2025; MRI systems are projected to grow at 5.60% CAGR through 2031.
- By technology, electromagnetic navigation accounted for 29.94% revenue share in 2025, while robotic-assisted imaging guidance is set to advance at a 6.13% CAGR to 2031.
- By application, cardiac surgery & structural heart dominated with 32.01% share of the Image Guided Therapy System market size in 2025; neurosurgery is poised to rise at a 6.25% CAGR.
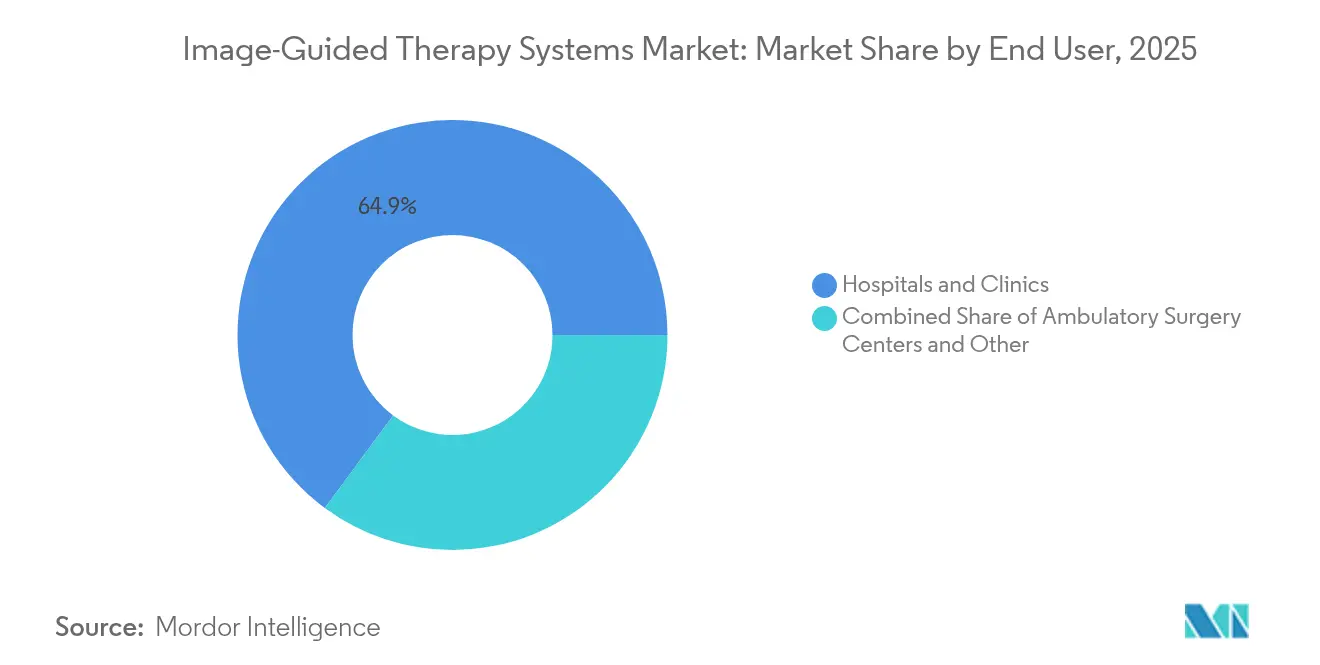
- By end-user, hospitals and clinics captured 64.88% revenue share in 2025 as ambulatory surgery centers expand the fastest at 5.80% CAGR.
- By modality portability, fixed systems held 53.64% of the Image Guided Therapy System market size in 2025, whereas hand-held/portable units lead growth at 5.82% CAGR.
Note: Market size and forecast figures in this report are generated using Mordor Intelligence’s proprietary estimation framework, updated with the latest available data and insights as of 2026.
Global Image Guided Therapy System Market Trends and Insights
Drivers Impact Analysis*
| Driver | (~) % Impact on CAGR Forecast | Geographic Relevance | Impact Timeline |
|---|---|---|---|
| Growing geriatric population | +1.2% | Global, North America & Europe dense | Long term (≥ 4 years) |
| Rising burden of chronic diseases | +1.1% | Global, faster in Asia-Pacific | Medium term (2-4 years) |
| Shift to minimally invasive, image-guided procedures | +0.9% | North America & EU lead | Short term (≤ 2 years) |
| Expansion of hybrid operating rooms | +0.8% | North America & Europe core | Medium term (2-4 years) |
| Regulatory convergence on interoperability | +0.6% | EU & North America | Long term (≥ 4 years) |
| Venture funding for MRI/US-guided robotics | +0.4% | Global, North America focus | Short term (≤ 2 years) |
| Source: Mordor Intelligence | |||
Growing geriatric population
Patients aged 65+ now constitute the fastest-growing surgical cohort, prompting wider adoption of precise electromagnetic navigation that limits tissue trauma and speeds recovery. MRI-guided focused ultrasound lets fragile elders avoid open craniotomy for essential tremor, improving quality-adjusted life years while trimming readmissions. Health-system budget holders recognize that upfront imaging costs offset downstream postoperative expenses.
Rising burden of chronic diseases
Cardiovascular, oncologic and neurologic disorders collectively drive over 70% of deaths worldwide, making repeatable, image-guided interventions essential. Deep-learning ECG analytics reach 95% accuracy in detecting structural heart disease, fueling earlier referrals to catheter-based repair guided by real-time 3D imaging [1]National Institutes of Health, “Deep Learning for Cardiovascular Imaging,” nih.gov . Fiscal strain from chronic illness sharpens the case for technologies that reduce lifelong care volumes.
Rapid shift to minimally invasive, image-guided procedures
Ambulatory centers complete most U.S. surgeries today, cutting costs up to 50% and wait times by 20% while favoring compact imaging units that fit smaller suites. Robotic navigation shortens transforaminal lumbar fusion times and lowers revision rates, and augmented-reality overlays let surgeons track subsurface anatomy without breaking sterility.
Expansion of hybrid operating rooms in tertiary hospitals
A hybrid OR merges angiography, CT or MRI with surgical tables, letting clinicians alternate between diagnosis and therapy in a single session. Each room can demand USD 2-5 million in capital, yet payback arrives in 3-5 years owing to higher case throughput and fewer transfers. Staffing complexity—often 14 specialists—remains the prime constraint.
Regulatory convergence enabling multi-modality interoperability
The U.S. FDA and the EU Medical Device Regulation now accept common DICOM-based cybersecurity test suites, reducing vendor-lock penalties and enabling hospitals to mix best-of-breed components.
Restraints Impact Analysis*
| Restraint | (~) % Impact on CAGR Forecast | Geographic Relevance | Impact Timeline |
|---|---|---|---|
| High capital cost of integrated systems | -1.4% | Global, emerging markets acute | Medium term (2-4 years) |
| Radiation & electromagnetic exposure concerns | -0.8% | Global regulatory focus | Long term (≥ 4 years) |
| Shortage of hybrid-OR-trained specialists | -0.7% | North America & Europe | Short term (≤ 2 years) |
| Cyber-security and data-integration hurdles | -0.5% | Global | Medium term (2-4 years) |
| Source: Mordor Intelligence | |||
High capital cost of integrated systems
Comprehensive suites that blend navigation, robotics and AI imaging cost USD 1-3 million plus 15–20% annual service fees, deterring mid-tier hospitals with thin margins. Leasing and outcome-based contracts soften this barrier but cannot erase scale advantages enjoyed by academic centers.
Radiation & electromagnetic exposure concerns
The U.S. CDC links 2% of annual cancers to medical imaging radiation, prompting stricter dose-tracking mandates and preference for non-ionizing guidance such as MRI and ultrasound [2]Centers for Disease Control and Prevention, “Ionizing Radiation in Medical Imaging,” cdc.gov . Electromagnetic interference fears add shielding expenses and testing delays.
*Our forecasts treat driver/restraint impacts as directional, not additive. The impact forecasts reflect baseline growth, mix effects, and variable interactions.
Segment Analysis
By Product Type: Endoscopes sustain leadership while MRI accelerates
Endoscopes retained 33.02% of the Image Guided Therapy System market in 2025 as their flexibility spans gastroenterology, urology and pulmonology. Hospitals integrate electromagnetic tracking probes through existing endoscope channels, trimming incremental spend. MRI systems, though smaller in volume, are forecast to expand 5.60% annually as focused ultrasound, laser ablation and deep-brain neuromodulation migrate into real-time MRI suites. Vendors now offer intra-operative 1.5 T magnets with robotic accessories that pivot seamlessly between scan and incision.
Ultrasound platforms gain momentum among ambulatory centers because portable carts need lower room shielding and cost fractions of fixed CT. X-ray C-arms stay vital for high-volume angiography despite radiation scrutiny. Hybrids such as PET-MRI tackle oncology staging in single sessions, blurring lines between diagnostic and therapeutic imaging.


By Technology: Electromagnetic navigation dominance meets robotic challenge
Electromagnetic navigation commanded 29.94% revenue in 2025 owing to line-of-sight independence and sub-millimeter accuracy in spine and cranial work. Segment revenue hit USD 1.61 billion, representing the highest slice of the Image Guided Therapy System market size that year. Robotic-assisted imaging guidance is poised to climb 6.13% CAGR through 2031 as AI route-planning and automated drilling cut operating times.
Real-time 3D/4D AI visualization halves targeting error versus manual fluoroscopy, according to multicenter trials. Augmented reality headsets project CT data onto the surgical field, refining implant alignment. Optical trackers remain economical for orthopedic extremity work yet lose precision in deep cavities.
By Application: Cardiac dominance balances neurosurgical innovation
Cardiac surgery & structural heart held 32.01% of 2025 revenue as TAVR, mitral repair and left-atrial appendage closure demand fused fluoroscopy–echo guidance. At USD 1.73 billion, cardiac uses formed the biggest slice of the Image Guided Therapy System market share in 2025. Neurosurgery grows fastest at 6.25% CAGR atop MRI-guided focused ultrasound for tremor and Parkinson’s.
Orthopedic and spine suites deploy robotic arms with CT navigation to raise screw placement accuracy, lowering revision rates. Oncology embraces microwave and cryo-ablation under CT-US fusion, benefiting frail patients unsuitable for open excision.
By End-user: Hospital consolidation versus ASC agility
Hospitals and clinics absorbed 64.88% of 2025 revenue, favored for complex, capital-intensive caseloads. Their purchasing consortia negotiate fleet upgrades, bundling service and cybersecurity into multiyear contracts. Ambulatory surgery centers expand 5.80% CAGR by focusing on lower-acuity procedures where portable ultrasound or compact CT suffices. Reimbursement parity for outpatient TAVR and complex spine accelerates ASC adoption.
Specialist centers that concentrate on one or two high-volume lines—such as electrophysiology or minimally invasive spine—often secure dedicated image-guided theaters, boosting throughput beyond general hospitals.
By Modality Portability: Fixed system stability meets portable innovation
Fixed suites provided 53.64% of sales in 2025, prized for superior detector size, cooling and image fidelity demanded in neuro-oncology and hybrid ORs. Portable scanners, however, will post 5.82% CAGR. Hand-held ultrasound probes stream AI-enhanced images to tablets, enabling trauma surgeons to place chest drains at the bedside. Mobile C-arms now feature 3D cone-beam and navigation packages once reserved for fixed angiography labs, compressing footprint without sacrificing guidance accuracy.
Geography Analysis
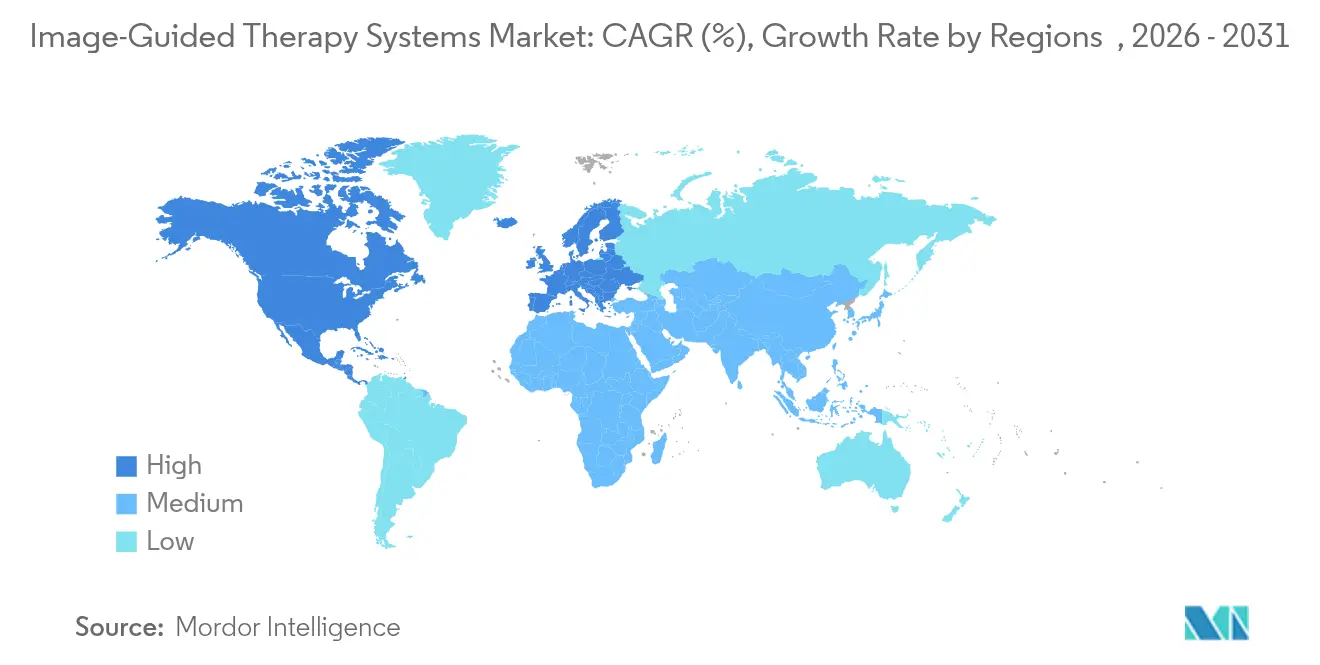
North America led with 45.18% revenue in 2025 as academic health systems, supportive reimbursement and dense vendor presence speed adoption. The FDA’s 2024 cybersecurity final rule clarified premarket requirements, letting suppliers certify multi-modality suites more quickly. U.S. venture investment in surgical robotics surpassed USD 2 billion in 2024, intensifying domestic competition. While payers pressure hospitals to justify capital spend, consolidation affords network-wide rollouts that spread cost over higher procedure volumes.
Asia-Pacific is projected to rise 6.55% CAGR through 2031. China’s public-hospital reform funnels budget toward high-end imaging, and the Healthy China 2030 plan subsidizes minimally invasive cardiology labs. Japan’s super-aged society raises demand for low-trauma therapy; local makers pioneer MRI-compatible robotics that fit small urban hospitals. India’s private chains deploy portable ultrasound and navigation bundles to tap medical tourism, while Korea combines domestic manufacturing strength with heavy R&D tax incentives.
Europe remains a technology proving ground under the Medical Device Regulation. Health-technology assessment agencies such as NICE evaluate cost-utility, nudging suppliers to document outcome gains. Germany hosts clusters of mid-sized imaging OEMs that supply modular components worldwide. EU AI Act rules, effective 2025, require transparent algorithm logs for surgical guidance software, lengthening validation cycles yet offering first-mover advantage for compliant vendors . Elsewhere, Brazil and Saudi Arabia upgrade trauma networks with hybrid cath-lab–OR complexes, opening late-adopter avenues.

Regulatory Landscape
Regulation for image-guided therapy systems continues to tighten around software, interoperability, and clinical cybersecurity as platforms shift from stand-alone imaging to integrated, AI-assisted suites. In January 2025, the US FDA issued draft guidance on artificial intelligence-enabled device software functions, reinforcing lifecycle management expectations that affect AI-enabled navigation, fusion, and decision-support modules embedded in therapy platforms. Device-level approvals also continue to anchor commercialization pathways, including an FDA 510(k) clearance (K254184) in April 2026 for Siemens Medical Solutions USA, Inc. covering image-guided surgery, fusion, and navigation functionality.
Global standardization activity is increasingly aligned with multi-vendor connectivity and robotics safety in the interventional suite. ISO published ISO 12052:2026 in February 2026, updating DICOM requirements that underpin image exchange and workflow integration across interventional radiology, surgery, and related therapy environments. IEC activity also advanced with a June 2026 ballot for IEC/DIS 80601-2-77 addressing basic safety and essential performance for robotically assisted surgical equipment. IEC 60601-2-68:2025 (published February 2025) updated requirements for X-ray-based image-guided radiotherapy equipment, supporting harmonized expectations for electrical safety and performance in complex, image-driven therapy settings.
Value Chain Analysis
The value chain for image-guided therapy systems centers on high-value R&D and software development (AI visualization, navigation, and workflow integration), followed by component sourcing, system integration and assembly, regulatory and clinical validation, channel distribution, installation, and recurring service. OEMs such as Siemens Healthineers, GE HealthCare, Philips, Medtronic, Stryker, and Brainlab integrate imaging hardware (CT/MRI/angiography/ultrasound/endoscopy) with navigation workstations and therapy-enabling software, while relying on specialized upstream suppliers for optics, sensors, polymers and metals, precision machining, and semiconductors that shape availability and lead times for advanced detector and compute subsystems.
Downstream value realization is increasingly driven by ecosystem integration, training, and post-sale uptime rather than by hardware alone, reflecting hybrid-OR and interventional-suite workflow needs. This shows up in integration-led collaborations announced in 2026, including GE HealthCare enabling digital integration between its bkActiv intraoperative ultrasound system and the Medtronic Stealth AXiS navigation system (April 2026), and Medtronic partnering with KARL STORZ to integrate Stealth AXiS ENT with KARL STORZ endoscopy and visualization (June 2026). Parallel partnerships, including AiM Medical Robotics interfacing an MRI-compatible stereotactic neurosurgery robot with Siemens Magnetom MRI (May 2026) and Mentice co-marketing Ankyras decision-support integration with Siemens ARTIS icono angiography (June 2026), reinforce how software, connectivity, and interoperability help move systems from capital purchases to integrated procedural platforms.
Competitive Landscape
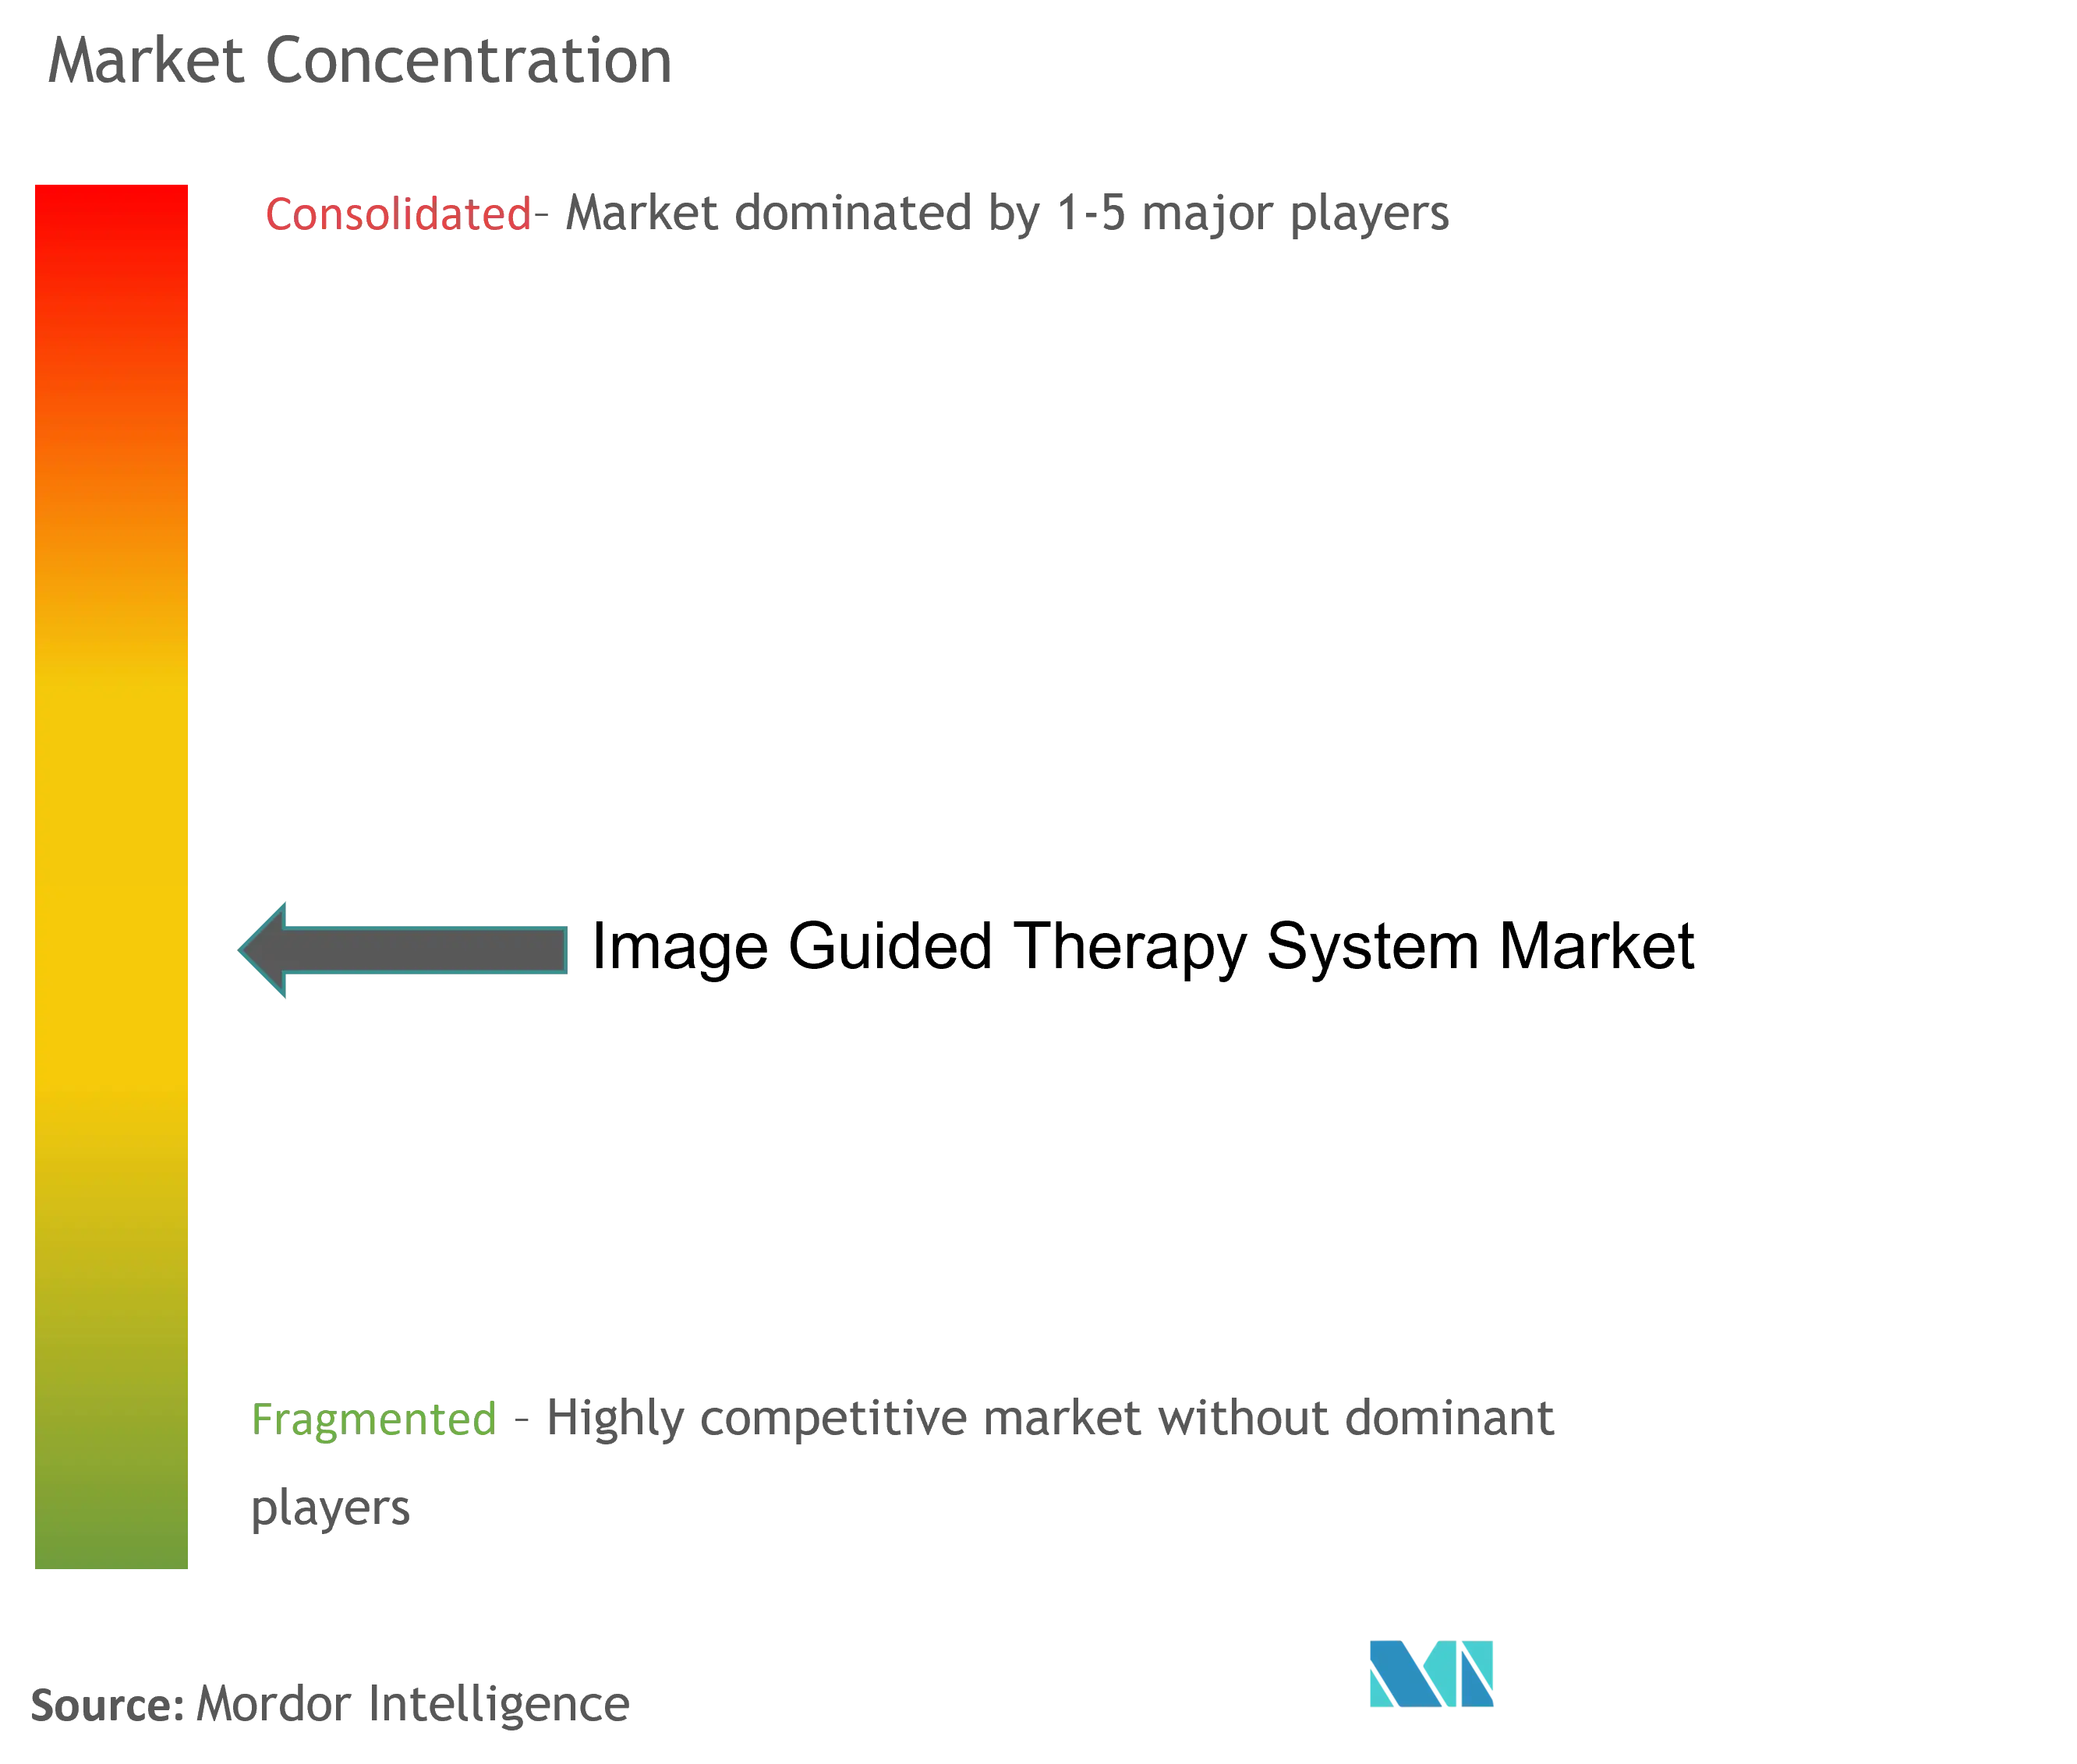
The Image Guided Therapy System market shows moderate concentration: the top five firms account for roughly 55% of global revenue. Siemens Healthineers, GE HealthCare and Philips anchor portfolios with CT, MRI and angio labs, adding AI navigation layers via in-house code or partnerships. Stryker and Brainlab focus on orthopedic and cranial navigation, integrating third-party imaging for full-procedure ecosystems. Strategic deals emphasize software: GE’s 2024 buyout of an AI segmentation startup embedded auto-contouring in its Innova platform, while Medtronic teamed with Siemens Healthineers to feed intra-op CBCT into its Mazor spine robots.
Start-ups tackle gaps in portability and cost. Hyperfine’s point-of-care MRI targets neurocritical care beds, and Clarius markets wireless ultrasound probes for ambulatory sites. Cybersecurity has moved from checkbox to differentiator; vendors that achieve FDA’s Secure Product Development Framework earn procurement preference among U.S. hospital groups. Distributors in emerging markets bundle leasing, service and surgeon training to lower entry friction.
Image Guided Therapy System Industry Leaders
Koninklijke Philips N.V.
Brainlab
Siemens Healthineers
General Electric Company (GE Healthcare)
Altaris Capital Partners, LLC (Analogic Corporation)
- *Disclaimer: Major Players sorted in no particular order

Market Opportunities and Future Outlook
Opportunities are concentrated in software-led upgrades and cross-modality workflow integration that improve utilization of existing installed bases while reducing friction for multi-vendor environments. A visible 2026 proof point is the wave of AI-enabled interventional guidance releases and clearances across major OEMs, including Philips launching IntraSight Plus (March 2026) and receiving FDA 510(k) clearance for EchoNavigator R5.0 with DeviceGuide for mitral TEER guidance (March 2026), alongside Abbott securing FDA clearance and CE Mark for Ultreon 3.0 AI-powered coronary imaging guidance on OCT (April 2026). These introductions broaden the addressable upgrade path from capital imaging rooms into recurring software, service, and workflow modules that can be standardized across hospital networks and interventional labs.
A second whitespace area is broader access to advanced image guidance outside traditional fixed labs, supported by mobility and automation in C-arms and CT reconstruction, along with clinical validation for MRI-guided adaptive workflows. GE HealthCare received FDA 510(k) clearance and CE Mark for Allia Moveo, a cable-free C-arm with AI-powered guidance (February 2026), while Canon Medical Systems USA introduced CLEAR Motion and PIQE 1024 Matrix deep learning reconstruction across its CT portfolio (July 2026), supporting throughput and image-quality gains that fit both high-acuity and space-constrained settings. On the clinical adoption side, MRI-guided adaptive stereotactic ablative radiotherapy research progressed with the REGULUS Phase II trial initiated at Stanford University in January 2026 (NCT07223307), reinforcing demand for real-time plan adaptation and integrated imaging-therapy workflows that align with the market shift toward minimally invasive, image-guided procedures.
Recent Industry Developments
- May 2026: Brainlab received CE marking and launched Elements Spine Planning in the EU, expanding its spine software portfolio within image-guided therapy workflows. The release strengthens preoperative planning standardization and supports tighter integration between planning, navigation, and intraoperative imaging for spine cases.
- September 2025: Brainlab received FDA 510(k) clearance and launched Spine Mixed Reality Navigation in the United States. Bringing mixed reality into navigation workflows adds a software-centric differentiation lever for hospitals upgrading guidance capabilities without replacing core imaging hardware.
- November 2024: Philips India unveiled the Azurion image-guided therapy suite with table-side 3D switching and AI-based remote diagnostics. The update underscores OEM focus on integrated interventional platforms and service-enabled uptime features that can improve procedure throughput and system utilization.


Research Methodology Framework and Report Scope
Market Definition and Coverage
For this study, the market is the revenue earned from image guided therapy systems used to support minimally invasive procedures, where real time imaging and guidance tools help physicians plan, navigate, and confirm treatment inside the procedure room.
Scope exclusions: stand-alone diagnostic imaging scanners, external beam radiotherapy linear accelerators, and post-processing software sold on its own are excluded from this market sizing.
Segmentation Overview
- By Product Type
- Ultrasound Systems
- Endoscopes
- Magnetic Resonance Imaging (MRI)
- X-ray Fluoroscopy / C-arms
- Positron Emission Tomography (PET)
- Single-Photon Emission CT (SPECT)
- Others
- By Technology
- Electromagnetic Navigation
- Robotic-assisted Imaging Guidance
- AI-Enhanced Real-time 3D/4D Imaging
- Augmented / Mixed-Reality Visualization
- Optical & Laser-based Tracking
- By Application
- Neurosurgery
- Cardiac Surgery & Structural Heart
- Orthopedic & Spine
- Urology
- Oncology & Ablation
- Others
- By End-user
- Hospitals and Clinics
- Ambulatory Surgery Centers
- Others
- By Modality Portability
- Fixed Systems
- Mobile C-arms
- Hand-held / Portable
- By Geography
- North America
- United States
- Canada
- Mexico
- Europe
- Germany
- United Kingdom
- France
- Italy
- Spain
- Rest of Europe
- Asia-Pacific
- China
- Japan
- India
- Australia
- South Korea
- Rest of Asia-Pacific
- Middle East & Africa
- GCC
- South Africa
- Rest of Middle East & Africa
- South America
- Brazil
- Argentina
- Rest of South America
- North America
Data Sources, Market Sizing, and Validation
Desk Research
Desk work starts by mapping where demand is created, which is mainly procedure volumes and the installed base of interventional suites, and then linking it to system shipments and replacement cycles. Public sources help anchor these inputs, such as the World Health Organization for health system indicators, the OECD for procedure and hospital statistics in covered countries, the US FDA device databases for approvals and safety notices, and the US Centers for Medicare and Medicaid Services for reimbursement signals tied to image guided procedures.
We also use peer-reviewed clinical journals for adoption trends by procedure type, trade and customs statistics for cross checking high value imaging equipment flows, plus company annual reports and investor presentations to understand product mix and regional exposure. When needed, paid subscriptions are used only for company financials and patent landscapes, and then the figures are checked against what is visible in public records. The desk sources listed here are illustrative, and many other public documents were also reviewed for data collection, validation, and clarification.
Primary Interviews and Surveys
Primary work is used to validate the demand pool and price logic, because procurement behavior varies by hospital type and by how hybrid operating rooms are funded. Interviews covered hospitals and ambulatory centers, distributors and service partners, and industry experts across APAC, EMEA, and the Americas, so gaps from desk findings could be filled and assumptions could be rechecked before finalizing the model.
Distribution of primary research fieldwork respondents
| Company type | Respondent position | Region |
|---|---|---|
| Top tier: 31% | CXOs: 13% | APAC: 45% |
| Mid tier: 53% | Functional/Unit leaders: 31% | EMEA: 36% |
| Smaller Players: 16% | Managers: 56% | Americas: 19% |
Market-Sizing & Forecasting
Sizing starts with a top-down build where procedure volumes, the installed base of interventional rooms, and planned capital spending are used to reconstruct system demand by region. Once the demand pool is set, it is translated into revenue using variables such as average selling prices by system class, mix shifts between fixed and mobile configurations, replacement timing for aging systems, service and software attachment where bundled, and regulatory or reimbursement signals that affect purchasing cycles.
To keep totals realistic, we corroborate the outcome with selective bottom-up approximations, including sampled shipment patterns from suppliers and distributors, channel checks on typical deal sizes, and limited roll ups for a few high visibility countries where data is clearer. When a country level input is missing, proxies are applied using hospital infrastructure and procedure intensity, and then the direction is confirmed with interview feedback. Forecasting is done using scenario analysis supported by trend lines in procedure growth, capital equipment cycles, and expert views on how fast navigation and hybrid suite adoption will expand.
Data Validation & Update Cycle
Before numbers are finalized, outputs are triangulated against independent signals like imaging equipment import trends, hospital capex indicators, and the pace of new suite openings, which helps catch values that do not fit the real world. Variance checks are run at region and country levels, and unusual jumps are reviewed by another analyst so model logic is consistent across the time series.
If interviews or public updates suggest a material change, such as a reimbursement adjustment or a major product recall, the assumptions are re-contacted and tuned before sign-off. Reports are refreshed annually, and interim updates are made when events are large enough to shift demand, pricing, or supply availability. Right before delivery, a final pass is completed so clients receive the most current view available.
Mordor Intelligence's Image Guided Therapy System Market Estimate Compared With Other Published Estimates
Published numbers for this market often vary because the scope lines are drawn differently, the base year differs, and pricing assumptions are not always consistent across regions. Timing also matters, since procedure recovery patterns and capital budgets can shift year to year, which changes the same forecast window.
Stand-alone diagnostic scanners sit outside Mordor Intelligence's scope here, and that single exclusion can move totals when other estimates blend therapy guidance platforms with broader imaging equipment revenue. Differences also come from whether service and software are counted only when bundled with a system sale, how ASP erosion is treated as systems mature, and how currency conversion is timed for multi-region rollups.
Benchmark comparison
| Source | Market Size | Gaps in Research Methodology |
|---|---|---|
| Mordor Intelligence | USD 5.67 B (2026) | |
| Industry Publisher A | USD 5.13 B (2024) | Uses a 2024 base year and a different forecast window, and product grouping can be wider, which may blend adjacent imaging categories with therapy guidance systems in some splits. |
| Market Publisher B | USD 5.40 B (2024) | Reports a 2024 value and a longer horizon to 2034, and the scope may include broader modality revenue without clearly separating stand-alone imaging from procedure-room guidance platforms. |
Overall, the spread is mainly explained by base year and what gets counted as an image guided therapy platform versus general imaging equipment. By tying the model to procedure demand, installed base behavior, and realistic ASP progression checks, the estimate stays traceable to inputs that can be re-validated during updates.


Key Questions Answered in the Report
What is the current Global Image Guided Therapy System Market size?
The market stood at USD 5.67 billion in 2026 and is projected to reach USD 7.27 billion by 2031.
Who are the key players in Global Image Guided Therapy System Market?
Koninklijke Philips N.V., Brainlab, Siemens Healthineers, General Electric Company (GE Healthcare) and Altaris Capital Partners, LLC (Analogic Corporation) are the major companies operating in the Global Image Guided Therapy System Market.
Which segment holds the largest Image Guided Therapy System market share?
Endoscopes led with 33.02% revenue share in 2025.
Which region has the biggest share in Global Image Guided Therapy System Market?
In 2025, the North America accounts for the largest market share in Global Image Guided Therapy System Market.
Page last updated on:


 Your data is secure and never sold or shared.


