| Study Period | 2017 - 2030 |
| Base Year For Estimation | 2024 |
| Forecast Data Period | 2025 - 2030 |
| Market Size (2025) | USD 92.52 Billion |
| Market Size (2030) | USD 111.8 Billion |
| CAGR (2025 - 2030) | 3.87 % |
| Market Concentration | Low |
Major Players*Disclaimer: Major Players sorted in no particular order |

Ice Cream Market Analysis
The Ice Cream Market size is estimated at 92.52 billion USD in 2025, and is expected to reach 111.8 billion USD by 2030, growing at a CAGR of 3.87% during the forecast period (2025-2030).
The global ice cream market continues to evolve with changing consumer preferences and ice cream consumption patterns across regions. In 2022, ice cream consumption patterns varied significantly by region, with New Zealand leading at 28.4 liters per capita, followed by the United States at 20.8 liters, and Australia at 18.0 liters. This variation in consumption reflects different cultural approaches to ice cream consumption, with some markets treating it as a regular dessert while others view it as a premium indulgence. The ice cream industry has also seen a shift toward premium and artisanal offerings, particularly in developed markets where consumers are increasingly seeking unique and high-quality products.
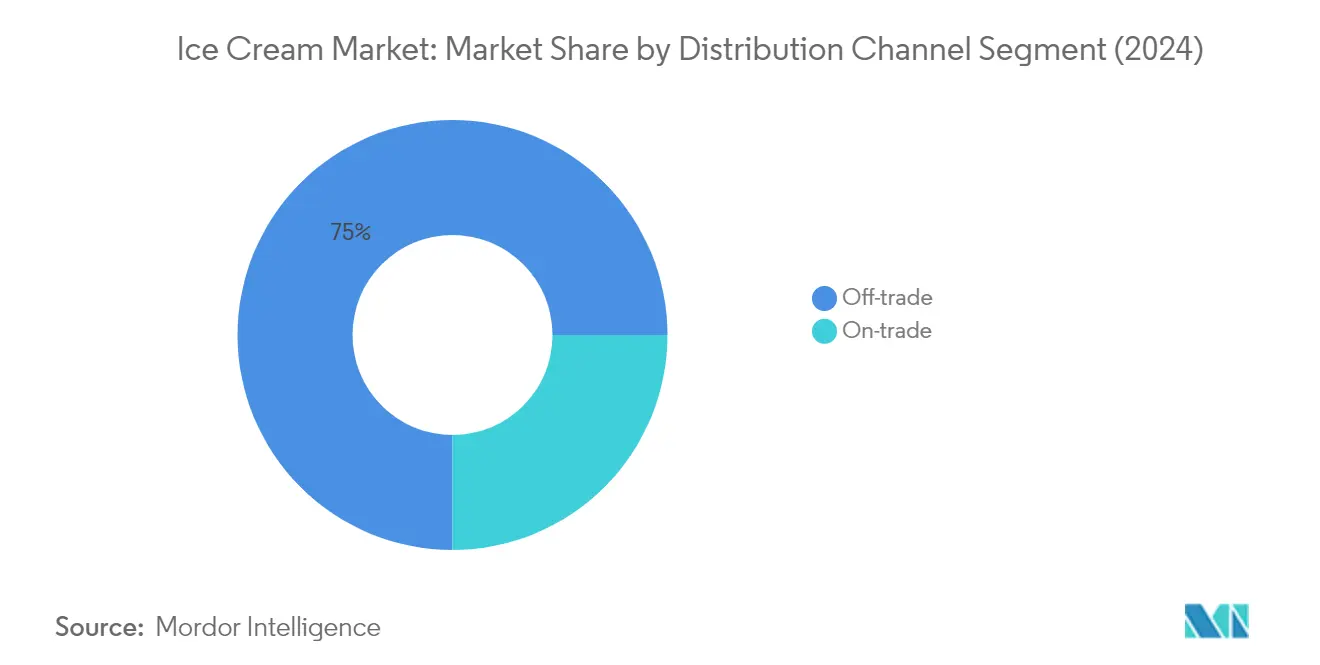
Distribution channels are undergoing significant transformation, with off-trade channels dominating the market landscape, accounting for 74% of overall sales in 2023. The evolution of retail formats has particularly benefited convenience stores, which have emerged as the second-largest channel for ice cream sales after supermarkets and hypermarkets. The extended operating hours of convenience stores have created additional selling opportunities, while the foodservice sector has also shown robust growth, with 47% of consumers consuming ice cream at restaurants in 2022.
Product innovation and flavor preferences continue to shape ice cream trends, particularly in mature markets like North America, where premium and regular ice cream segments hold 80% of the market share. Consumer preferences have become increasingly sophisticated, with chocolate-flavored ice cream being preferred by 16% of North American consumers in 2022, followed by cookies and cream at 13% and vanilla at 12%. The industry has responded with innovations in both flavors and formats, with particular attention to premium ingredients and unique flavor combinations that cater to evolving consumer tastes.
Manufacturing and supply chain considerations have become increasingly important, particularly regarding product shelf life and storage requirements. In the Middle East, where temperature control is crucial, ice cream products maintain a shelf life ranging from 12 to 24 months depending on storage conditions. This has led to innovations in cold chain management and packaging technologies to maintain product quality. Production capabilities have also expanded significantly, with major manufacturing hubs emerging in Asia-Pacific, where companies are investing in advanced production facilities to meet growing demand and maintain product quality standards.
Global Ice Cream Market Trends
The strong penetration of ice cream parlors, the availability of diverse flavors, and the consumer preference for indulgent and healthier dessert options are driving the consumption of ice cream.
- Ice cream is the most widely consumed dairy dessert globally, with strong penetration across different countries. The demand for ice cream is driven by the significant number of ice cream parlors and scoop shops emerging in response to the high consumer spending on different flavors of ice creams. Europe is a significant consumer of ice cream globally. In 2022, Germany, the United Kingdom, Italy, and Spain collectively covered 29.28% of the overall ice cream consumption.
- Developed markets like the United States, the United Kingdom, Germany, and Australia are witnessing rising health concerns. Thus, consumers across the region prefer ice cream products that are GMO-free, preservative-free, dairy-free, low in calories, and organic and fat-free.
- The Asian ice cream market is growing, with brands tapping into the ice cream trend from an indulgence and a health perspective. For example, per capita consumption of ice cream in India is expected to increase by 5.90% from 2023-2024. The growing consumer expenditure on food and beverages, the introduction of new flavors, increasing impulse purchasing, and strong demand for healthy ice cream products among consumers are some of the primary factors increasing the consumption of ice cream. 75% of consumers in Asia often try new or different varieties when purchasing ice cream products.

Understand The Key Trends Shaping This Market
Download PDF
OTHER KEY INDUSTRY TRENDS COVERED IN THE REPORT
- The growing demand for processed dairy products followed by increasing prices globally is emerged to be the major factors impacting the production of milk
Segment Analysis: Distribution Channel
Off-Trade Segment in Ice Cream Market
The off-trade segment dominates the global ice cream market segmentation, commanding approximately 75% of the total ice cream market share in 2024. This segment encompasses various ice cream distribution channels, including supermarkets/hypermarkets, convenience stores, online retail, specialist retailers, and other distribution channels. Within the off-trade segment, supermarkets and hypermarkets emerge as the largest distribution channel, accounting for nearly 45% of off-trade sales due to their widespread presence and ability to offer a diverse range of ice cream products. The segment's dominance is further reinforced by its projected strong growth trajectory of around 4.3% CAGR from 2024 to 2029, driven by factors such as increasing consumer preference for take-home consumption, rising penetration of organized retail, and the growing trend of online grocery shopping. The expansion of cold chain infrastructure and increasing deep freezer penetration across retail stores have also contributed significantly to strengthening the off-trade ice cream distribution network.
On-Trade Segment in Ice Cream Market
The on-trade segment, comprising fast-food chains, full-service restaurants, cafeterias, and other foodservice outlets, represents the remaining portion of the ice cream market segmentation. This channel plays a crucial role in serving ice cream as desserts and specialty items, particularly in cafes and restaurant chains. The segment's growth is primarily driven by the increasing trend of out-of-home consumption, rising disposable incomes, and the expanding network of foodservice establishments globally. The foodservice sector's focus on offering unique ice cream flavors, premium varieties, and innovative serving formats has helped maintain consumer interest in on-trade consumption. Additionally, the growing cafe culture and the rising number of ice cream parlors specializing in artisanal and premium ice creams have further strengthened the on-trade distribution channel's position in the market.
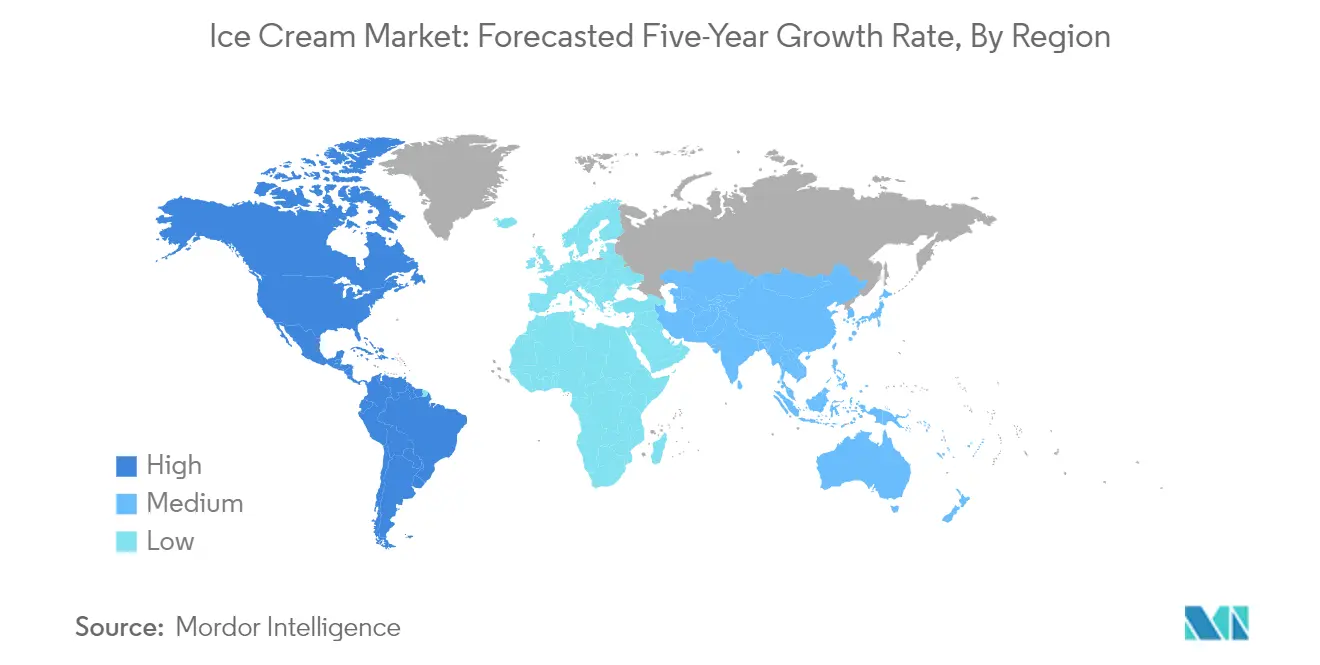
Ice Cream Market Geography Segment Analysis
Ice Cream Market in Africa
The African ice cream market demonstrates significant growth potential driven by changing consumer preferences and rising disposable incomes across the region. Egypt, Nigeria, and South Africa represent the key markets, each with distinct consumption patterns and market dynamics. The region shows increasing demand for both traditional and innovative ice cream flavors, with manufacturers focusing on product development to cater to local tastes and preferences.
Ice Cream Market in Egypt
Egypt stands as the largest ice cream market in Africa, commanding approximately 47% of the ice cream market share in 2024. The country's market is characterized by strong consumer preference for traditional ice cream flavors like "ashta," made with clotted cream and flavored with rose water and orange water. Egyptian consumers increasingly favor ice cream products with unique textures and innovative flavors, while manufacturers focus on extending product shelf life to meet consumer storage preferences. The market shows particular strength in off-trade retail channels, with supermarkets and hypermarkets playing a dominant role in distribution.
Ice Cream Market in South Africa
South Africa emerges as the fastest-growing ice cream market in Africa, with an expected growth rate of approximately 3% during 2024-2029. The country's market is distinguished by its diverse range of ice cream formats, textures, and shapes, including unique local flavors like Rooibos, Amarula, and Milk Tart. South African consumers show increasing interest in premium and artisanal ice cream products, with specialty stores like Tapi Tapi Café in Cape Town offering distinctive African-inspired flavors. The market benefits from a well-developed retail infrastructure and growing consumer awareness of premium ice cream products.
Ice Cream Market in Asia-Pacific
The Asia-Pacific region is a significant contributor to the global ice cream industry, with China leading the ice cream market in terms of volume, reaching 2,370,131 tonnes in 2024. India, on the other hand, exhibits the highest growth potential with a projected CAGR of 9.13%. The region's market dynamics are influenced by a growing middle class and increasing ice cream consumption, with a preference for both traditional and innovative flavors.
Ice Cream Market in Europe
Europe's ice cream market is characterized by diverse consumer preferences and a strong emphasis on quality. Germany holds the largest market size based on a 2024 volume of 603,073 tonnes, while Belgium is the fastest-growing market with a CAGR of 7.55% from 2023 to 2029. The region's market is driven by a combination of traditional flavors and innovative product offerings, catering to a wide range of consumer tastes.
Ice Cream Market in the Middle East
In the Middle East, the ice cream market is led by Saudi Arabia, which showcases a robust market size due to its large population and increasing disposable incomes. The region's market is characterized by a growing demand for premium and innovative ice cream products, with consumers showing a preference for both local and international brands.
Ice Cream Market in North America
North America's ice cream industry is dominated by the United States, which holds the largest market size in the region. The market is driven by a high level of ice cream consumption and a strong preference for premium and artisanal products. The US market is characterized by a wide variety of flavors and formats, catering to diverse consumer preferences.
Ice Cream Market in South America
In South America, Brazil leads the ice cream market with a significant market size. The region's market dynamics are influenced by a growing middle class and increasing demand for both traditional and innovative ice cream products. The market shows potential for growth, driven by rising consumer interest in premium and artisanal offerings.
Get Analysis on Important Geographic Markets
Download PDF
Ice Cream Industry Overview
Top Companies in Ice Cream Market
The global ice cream market is characterized by intense product innovation and strategic expansion initiatives from leading players. Companies are focusing on developing premium and health-conscious offerings, including low-fat, lactose-free, and gluten-free variants to cater to evolving consumer preferences. Operational agility is demonstrated through investments in manufacturing capabilities and cold chain infrastructure to ensure product quality and wider distribution reach. Strategic moves in the industry are primarily centered around partnerships with retail chains and food service operators to enhance market presence. Companies are also expanding their geographical footprint through acquisitions and establishing new production facilities in emerging markets. Digital transformation and e-commerce integration have become crucial aspects of competitive strategy, with manufacturers developing direct-to-consumer channels and partnering with online delivery platforms.
Market Led By Global Consumer Conglomerates
The ice cream industry exhibits a moderately consolidated structure dominated by multinational consumer goods conglomerates with diverse product portfolios. These global players leverage their extensive distribution networks, brand equity, and research capabilities to maintain market leadership. Regional and local players maintain a significant presence in specific markets through their understanding of local tastes and established distribution channels. The industry is characterized by a mix of large-scale manufacturers with multiple ice cream brands and specialized premium ice cream producers focusing on artisanal and niche segments.
The market has witnessed considerable merger and acquisition activity as larger companies seek to expand their product portfolios and geographical presence. Consolidation trends are particularly evident in emerging markets where established players acquire local brands to gain market access and consumer insights. Companies are also forming strategic alliances with ingredient suppliers and technology providers to enhance their production capabilities and develop innovative products. The competitive landscape is further shaped by vertical integration strategies, with some players establishing their own retail presence and others focusing on strengthening relationships with existing distribution channels.
Innovation and Distribution Drive Market Success
Success in the ice cream market increasingly depends on companies' ability to innovate while maintaining operational efficiency. Incumbents can strengthen their position by investing in research and development to create unique flavors and healthier alternatives, while also optimizing their production and distribution networks. Building strong relationships with retailers and food service operators remains crucial for maintaining market share. Companies must also focus on sustainability initiatives and transparent sourcing practices to meet growing consumer expectations while developing robust digital capabilities to enhance direct consumer engagement.
For contenders looking to gain ground, focusing on specific market segments or geographical regions offers opportunities for growth. Success factors include developing distinctive product offerings, establishing efficient cold chain logistics, and building strong local distribution partnerships. Companies must also consider potential regulatory changes regarding labeling requirements and food safety standards while maintaining flexibility to adapt to shifting consumer preferences. The ability to quickly respond to market trends and maintain product quality while managing costs will be crucial for long-term success in this competitive landscape.
Ice Cream Market Leaders
-
Dairy Farmers of America Inc.
-
Inner Mongolia Yili Industrial Group Co. Ltd
-
Nestlé SA
-
Unilever PLC
-
Wells Enterprises Inc.
- *Disclaimer: Major Players sorted in no particular order

Need More Details on Market Players and Competiters?
Download PDF
Ice Cream Market News
- October 2022: Unilever partnered with ASAP for the delivery of its ice cream products. As per the partnership, ASAP will also deliver ice cream and treats from Unilever's virtual storefront, The Ice Cream Shop.
- October 2022: Kemps replaced Dean Goods throughout Iowa as Dairy Farmers of America completed the USD 433 million acquisition of Dean Foods properties. The business took over the Le Mars milk factory, which can process numerous Kemps products, from cottage cheese to ice cream.
- October 2022: Blue Ribbon's Street range launched three new two-liter tubs, each featuring two flavors. The range includes chocolate affair, caramel hokey pokey, and velvety caramel.
Free With This Report
We provide a comprehensive and exhaustive set of data pointers for global, regional, and country-level metrics that illustrate the fundamentals of the dairy industry. With the help of 45+ free charts, clients can access in-depth market analysis based on per capita consumption numbers and production data of raw materials for dairy, through granular-level segmental information supported by a repository of market data, trends, and expert analysis. Data and analysis on dairy, categories of dairy products, product types, etc., are available in the form of comprehensive reports as well as excel based data worksheets.


Ice Cream Market Report - Table of Contents
1. EXECUTIVE SUMMARY & KEY FINDINGS
2. REPORT OFFERS
3. INTRODUCTION
- 3.1 Study Assumptions & Market Definition
- 3.2 Scope of the Study
- 3.3 Research Methodology
4. KEY INDUSTRY TRENDS
- 4.1 Per Capita Consumption
-
4.2 Raw Material/commodity Production
- 4.2.1 Milk
-
4.3 Regulatory Framework
- 4.3.1 Brazil
- 4.3.2 Canada
- 4.3.3 Germany
- 4.3.4 Italy
- 4.3.5 Japan
- 4.3.6 Mexico
- 4.3.7 United States
- 4.4 Value Chain & Distribution Channel Analysis
5. MARKET SEGMENTATION (includes market size in Value in USD and Volume, Forecasts up to 2030 and analysis of growth prospects)
-
5.1 Distribution Channel
- 5.1.1 Off-Trade
- 5.1.1.1 Convenience Stores
- 5.1.1.2 Online Retail
- 5.1.1.3 Specialist Retailers
- 5.1.1.4 Supermarkets and Hypermarkets
- 5.1.1.5 Others (Warehouse clubs, gas stations, etc.)
- 5.1.2 On-Trade
-
5.2 Region
- 5.2.1 Africa
- 5.2.1.1 By Distribution Channel
- 5.2.1.2 Egypt
- 5.2.1.3 Nigeria
- 5.2.1.4 South Africa
- 5.2.1.5 Rest of Africa
- 5.2.2 Asia-Pacific
- 5.2.2.1 By Distribution Channel
- 5.2.2.2 Australia
- 5.2.2.3 China
- 5.2.2.4 India
- 5.2.2.5 Indonesia
- 5.2.2.6 Japan
- 5.2.2.7 Malaysia
- 5.2.2.8 New Zealand
- 5.2.2.9 Pakistan
- 5.2.2.10 South Korea
- 5.2.2.11 Rest of Asia Pacific
- 5.2.3 Europe
- 5.2.3.1 By Distribution Channel
- 5.2.3.2 Belgium
- 5.2.3.3 France
- 5.2.3.4 Germany
- 5.2.3.5 Italy
- 5.2.3.6 Netherlands
- 5.2.3.7 Russia
- 5.2.3.8 Spain
- 5.2.3.9 Turkey
- 5.2.3.10 United Kingdom
- 5.2.3.11 Rest of Europe
- 5.2.4 Middle East
- 5.2.4.1 By Distribution Channel
- 5.2.4.2 Bahrain
- 5.2.4.3 Iran
- 5.2.4.4 Kuwait
- 5.2.4.5 Oman
- 5.2.4.6 Qatar
- 5.2.4.7 Saudi Arabia
- 5.2.4.8 United Arab Emirates
- 5.2.4.9 Rest of Middle East
- 5.2.5 North America
- 5.2.5.1 By Distribution Channel
- 5.2.5.2 Canada
- 5.2.5.3 Mexico
- 5.2.5.4 United States
- 5.2.5.5 Rest of North America
- 5.2.6 South America
- 5.2.6.1 By Distribution Channel
- 5.2.6.2 Argentina
- 5.2.6.3 Brazil
- 5.2.6.4 Rest of South America
6. COMPETITIVE LANDSCAPE
- 6.1 Key Strategic Moves
- 6.2 Market Share Analysis
- 6.3 Company Landscape
-
6.4 Company Profiles (includes Global Level Overview, Market Level Overview, Core Business Segments, Financials, Headcount, Key Information, Market Rank, Market Share, Products and Services, and Analysis of Recent Developments).
- 6.4.1 Blue Bell Creameries LP
- 6.4.2 Dairy Farmers of America Inc.
- 6.4.3 Inner Mongolia Yili Industrial Group Co. Ltd
- 6.4.4 Lotte Corporation
- 6.4.5 Nestlé SA
- 6.4.6 Smith Foods Inc.
- 6.4.7 Unilever PLC
- 6.4.8 Wells Enterprises Inc.
7. KEY STRATEGIC QUESTIONS FOR DAIRY AND DAIRY ALTERNATIVE CEOS
8. APPENDIX
-
8.1 Global Overview
- 8.1.1 Overview
- 8.1.2 Porter’s Five Forces Framework
- 8.1.3 Global Value Chain Analysis
- 8.1.4 Market Dynamics (DROs)
- 8.2 Sources & References
- 8.3 List of Tables & Figures
- 8.4 Primary Insights
- 8.5 Data Pack
- 8.6 Glossary of Terms
You Can Purchase Parts Of This Report. Check Out Prices For Specific Sections
Get Price Break-up Now
List of Tables & Figures
- Figure 1:
- PER CAPITA CONSUMPTION OF ICE CREAM, KG, GLOBAL, 2017 - 2029
- Figure 2:
- PRODUCTION OF MILK, METRIC TONNES, GLOBAL, 2017 - 2021
- Figure 3:
- VOLUME OF ICE CREAM, METRIC TONNES, BY GLOBAL, 2017 - 2029
- Figure 4:
- VALUE OF ICE CREAM, USD MN, BY GLOBAL, 2017 - 2029
- Figure 5:
- VOLUME OF ICE CREAM MARKET BY DISTRIBUTION CHANNEL, METRIC TONNES, GLOBAL, 2017 - 2029
- Figure 6:
- VALUE OF ICE CREAM MARKET BY DISTRIBUTION CHANNEL, USD MN, GLOBAL, 2017 - 2029
- Figure 7:
- VOLUME SHARE OF ICE CREAM MARKET, BY DISTRIBUTION CHANNEL , %, GLOBAL, 2017 VS 2023 VS 2029
- Figure 8:
- VALUE SHARE OF ICE CREAM MARKET, BY DISTRIBUTION CHANNEL , %, GLOBAL, 2017 VS 2023 VS 2029
- Figure 9:
- VOLUME OF ICE CREAM MARKET BY SUB DISTRIBUTION CHANNELS, METRIC TONNES, GLOBAL, 2017 - 2029
- Figure 10:
- VALUE OF ICE CREAM MARKET BY SUB DISTRIBUTION CHANNELS, USD MN, GLOBAL, 2017 - 2029
- Figure 11:
- VOLUME SHARE OF ICE CREAM MARKET, BY SUB DISTRIBUTION CHANNELS , %, GLOBAL, 2017 VS 2023 VS 2029
- Figure 12:
- VALUE SHARE OF ICE CREAM MARKET, BY SUB DISTRIBUTION CHANNELS , %, GLOBAL, 2017 VS 2023 VS 2029
- Figure 13:
- VOLUME OF ICE CREAM MARKET SOLD VIA CONVENIENCE STORES, METRIC TONNES, GLOBAL, 2017 - 2029
- Figure 14:
- VALUE OF ICE CREAM MARKET SOLD VIA CONVENIENCE STORES, USD MN, GLOBAL, 2017 - 2029
- Figure 15:
- VOLUME OF ICE CREAM MARKET SOLD VIA ONLINE RETAIL, METRIC TONNES, GLOBAL, 2017 - 2029
- Figure 16:
- VALUE OF ICE CREAM MARKET SOLD VIA ONLINE RETAIL, USD MN, GLOBAL, 2017 - 2029
- Figure 17:
- VOLUME OF ICE CREAM MARKET SOLD VIA SPECIALIST RETAILERS, METRIC TONNES, GLOBAL, 2017 - 2029
- Figure 18:
- VALUE OF ICE CREAM MARKET SOLD VIA SPECIALIST RETAILERS, USD MN, GLOBAL, 2017 - 2029
- Figure 19:
- VOLUME OF ICE CREAM MARKET SOLD VIA SUPERMARKETS AND HYPERMARKETS, METRIC TONNES, GLOBAL, 2017 - 2029
- Figure 20:
- VALUE OF ICE CREAM MARKET SOLD VIA SUPERMARKETS AND HYPERMARKETS, USD MN, GLOBAL, 2017 - 2029
- Figure 21:
- VOLUME OF ICE CREAM MARKET SOLD VIA OTHERS (WAREHOUSE CLUBS, GAS STATIONS, ETC.), METRIC TONNES, GLOBAL, 2017 - 2029
- Figure 22:
- VALUE OF ICE CREAM MARKET SOLD VIA OTHERS (WAREHOUSE CLUBS, GAS STATIONS, ETC.), USD MN, GLOBAL, 2017 - 2029
- Figure 23:
- VOLUME OF ICE CREAM MARKET SOLD VIA ON-TRADE, METRIC TONNES, GLOBAL, 2017 - 2029
- Figure 24:
- VALUE OF ICE CREAM MARKET SOLD VIA ON-TRADE, USD MN, GLOBAL, 2017 - 2029
- Figure 25:
- VOLUME OF ICE CREAM MARKET BY REGION, METRIC TONNES, GLOBAL, 2017 - 2029
- Figure 26:
- VALUE OF ICE CREAM MARKET BY REGION, USD MN, GLOBAL, 2017 - 2029
- Figure 27:
- VOLUME SHARE OF ICE CREAM MARKET, BY REGION , %, GLOBAL, 2017 VS 2023 VS 2029
- Figure 28:
- VALUE SHARE OF ICE CREAM MARKET, BY REGION , %, GLOBAL, 2017 VS 2023 VS 2029
- Figure 29:
- VOLUME OF ICE CREAM MARKET BY DISTRIBUTION CHANNEL, METRIC TONNES, AFRICA, 2017 - 2029
- Figure 30:
- VALUE OF ICE CREAM MARKET BY DISTRIBUTION CHANNEL, USD MN, AFRICA, 2017 - 2029
- Figure 31:
- VOLUME SHARE OF ICE CREAM MARKET, BY DISTRIBUTION CHANNEL , %, AFRICA, 2017 VS 2023 VS 2029
- Figure 32:
- VALUE SHARE OF ICE CREAM MARKET, BY DISTRIBUTION CHANNEL , %, AFRICA, 2017 VS 2023 VS 2029
- Figure 33:
- VOLUME OF ICE CREAM MARKET BY COUNTRY, METRIC TONNES, AFRICA, 2017 - 2029
- Figure 34:
- VALUE OF ICE CREAM MARKET BY COUNTRY, USD MN, AFRICA, 2017 - 2029
- Figure 35:
- VOLUME SHARE OF ICE CREAM MARKET, BY COUNTRY , %, AFRICA, 2017 VS 2023 VS 2029
- Figure 36:
- VALUE SHARE OF ICE CREAM MARKET, BY COUNTRY , %, AFRICA, 2017 VS 2023 VS 2029
- Figure 37:
- VOLUME OF ICE CREAM MARKET, METRIC TONNES, EGYPT, 2017 - 2029
- Figure 38:
- VALUE OF ICE CREAM MARKET, USD MN, EGYPT, 2017 - 2029
- Figure 39:
- VOLUME OF ICE CREAM MARKET, METRIC TONNES, NIGERIA, 2017 - 2029
- Figure 40:
- VALUE OF ICE CREAM MARKET, USD MN, NIGERIA, 2017 - 2029
- Figure 41:
- VOLUME OF ICE CREAM MARKET, METRIC TONNES, SOUTH AFRICA, 2017 - 2029
- Figure 42:
- VALUE OF ICE CREAM MARKET, USD MN, SOUTH AFRICA, 2017 - 2029
- Figure 43:
- VOLUME OF ICE CREAM MARKET, METRIC TONNES, REST OF AFRICA, 2017 - 2029
- Figure 44:
- VALUE OF ICE CREAM MARKET, USD MN, REST OF AFRICA, 2017 - 2029
- Figure 45:
- VOLUME OF ICE CREAM MARKET BY DISTRIBUTION CHANNEL, METRIC TONNES, ASIA-PACIFIC, 2017 - 2029
- Figure 46:
- VALUE OF ICE CREAM MARKET BY DISTRIBUTION CHANNEL, USD MN, ASIA-PACIFIC, 2017 - 2029
- Figure 47:
- VOLUME SHARE OF ICE CREAM MARKET, BY DISTRIBUTION CHANNEL , %, ASIA-PACIFIC, 2017 VS 2023 VS 2029
- Figure 48:
- VALUE SHARE OF ICE CREAM MARKET, BY DISTRIBUTION CHANNEL , %, ASIA-PACIFIC, 2017 VS 2023 VS 2029
- Figure 49:
- VOLUME OF ICE CREAM MARKET BY COUNTRY, METRIC TONNES, ASIA-PACIFIC, 2017 - 2029
- Figure 50:
- VALUE OF ICE CREAM MARKET BY COUNTRY, USD MN, ASIA-PACIFIC, 2017 - 2029
- Figure 51:
- VOLUME SHARE OF ICE CREAM MARKET, BY COUNTRY , %, ASIA-PACIFIC, 2017 VS 2023 VS 2029
- Figure 52:
- VALUE SHARE OF ICE CREAM MARKET, BY COUNTRY , %, ASIA-PACIFIC, 2017 VS 2023 VS 2029
- Figure 53:
- VOLUME OF ICE CREAM MARKET, METRIC TONNES, AUSTRALIA, 2017 - 2029
- Figure 54:
- VALUE OF ICE CREAM MARKET, USD MN, AUSTRALIA, 2017 - 2029
- Figure 55:
- VOLUME OF ICE CREAM MARKET, METRIC TONNES, CHINA, 2017 - 2029
- Figure 56:
- VALUE OF ICE CREAM MARKET, USD MN, CHINA, 2017 - 2029
- Figure 57:
- VOLUME OF ICE CREAM MARKET, METRIC TONNES, INDIA, 2017 - 2029
- Figure 58:
- VALUE OF ICE CREAM MARKET, USD MN, INDIA, 2017 - 2029
- Figure 59:
- VOLUME OF ICE CREAM MARKET, METRIC TONNES, INDONESIA, 2017 - 2029
- Figure 60:
- VALUE OF ICE CREAM MARKET, USD MN, INDONESIA, 2017 - 2029
- Figure 61:
- VOLUME OF ICE CREAM MARKET, METRIC TONNES, JAPAN, 2017 - 2029
- Figure 62:
- VALUE OF ICE CREAM MARKET, USD MN, JAPAN, 2017 - 2029
- Figure 63:
- VOLUME OF ICE CREAM MARKET, METRIC TONNES, MALAYSIA, 2017 - 2029
- Figure 64:
- VALUE OF ICE CREAM MARKET, USD MN, MALAYSIA, 2017 - 2029
- Figure 65:
- VOLUME OF ICE CREAM MARKET, METRIC TONNES, NEW ZEALAND, 2017 - 2029
- Figure 66:
- VALUE OF ICE CREAM MARKET, USD MN, NEW ZEALAND, 2017 - 2029
- Figure 67:
- VOLUME OF ICE CREAM MARKET, METRIC TONNES, PAKISTAN, 2017 - 2029
- Figure 68:
- VALUE OF ICE CREAM MARKET, USD MN, PAKISTAN, 2017 - 2029
- Figure 69:
- VOLUME OF ICE CREAM MARKET, METRIC TONNES, SOUTH KOREA, 2017 - 2029
- Figure 70:
- VALUE OF ICE CREAM MARKET, USD MN, SOUTH KOREA, 2017 - 2029
- Figure 71:
- VOLUME OF ICE CREAM MARKET, METRIC TONNES, REST OF ASIA PACIFIC, 2017 - 2029
- Figure 72:
- VALUE OF ICE CREAM MARKET, USD MN, REST OF ASIA PACIFIC, 2017 - 2029
- Figure 73:
- VOLUME OF ICE CREAM MARKET BY DISTRIBUTION CHANNEL, METRIC TONNES, EUROPE, 2017 - 2029
- Figure 74:
- VALUE OF ICE CREAM MARKET BY DISTRIBUTION CHANNEL, USD MN, EUROPE, 2017 - 2029
- Figure 75:
- VOLUME SHARE OF ICE CREAM MARKET, BY DISTRIBUTION CHANNEL , %, EUROPE, 2017 VS 2023 VS 2029
- Figure 76:
- VALUE SHARE OF ICE CREAM MARKET, BY DISTRIBUTION CHANNEL , %, EUROPE, 2017 VS 2023 VS 2029
- Figure 77:
- VOLUME OF ICE CREAM MARKET BY COUNTRY, METRIC TONNES, EUROPE, 2017 - 2029
- Figure 78:
- VALUE OF ICE CREAM MARKET BY COUNTRY, USD MN, EUROPE, 2017 - 2029
- Figure 79:
- VOLUME SHARE OF ICE CREAM MARKET, BY COUNTRY , %, EUROPE, 2017 VS 2023 VS 2029
- Figure 80:
- VALUE SHARE OF ICE CREAM MARKET, BY COUNTRY , %, EUROPE, 2017 VS 2023 VS 2029
- Figure 81:
- VOLUME OF ICE CREAM MARKET, METRIC TONNES, BELGIUM, 2017 - 2029
- Figure 82:
- VALUE OF ICE CREAM MARKET, USD MN, BELGIUM, 2017 - 2029
- Figure 83:
- VOLUME OF ICE CREAM MARKET, METRIC TONNES, FRANCE, 2017 - 2029
- Figure 84:
- VALUE OF ICE CREAM MARKET, USD MN, FRANCE, 2017 - 2029
- Figure 85:
- VOLUME OF ICE CREAM MARKET, METRIC TONNES, GERMANY, 2017 - 2029
- Figure 86:
- VALUE OF ICE CREAM MARKET, USD MN, GERMANY, 2017 - 2029
- Figure 87:
- VOLUME OF ICE CREAM MARKET, METRIC TONNES, ITALY, 2017 - 2029
- Figure 88:
- VALUE OF ICE CREAM MARKET, USD MN, ITALY, 2017 - 2029
- Figure 89:
- VOLUME OF ICE CREAM MARKET, METRIC TONNES, NETHERLANDS, 2017 - 2029
- Figure 90:
- VALUE OF ICE CREAM MARKET, USD MN, NETHERLANDS, 2017 - 2029
- Figure 91:
- VOLUME OF ICE CREAM MARKET, METRIC TONNES, RUSSIA, 2017 - 2029
- Figure 92:
- VALUE OF ICE CREAM MARKET, USD MN, RUSSIA, 2017 - 2029
- Figure 93:
- VOLUME OF ICE CREAM MARKET, METRIC TONNES, SPAIN, 2017 - 2029
- Figure 94:
- VALUE OF ICE CREAM MARKET, USD MN, SPAIN, 2017 - 2029
- Figure 95:
- VOLUME OF ICE CREAM MARKET, METRIC TONNES, TURKEY, 2017 - 2029
- Figure 96:
- VALUE OF ICE CREAM MARKET, USD MN, TURKEY, 2017 - 2029
- Figure 97:
- VOLUME OF ICE CREAM MARKET, METRIC TONNES, UNITED KINGDOM, 2017 - 2029
- Figure 98:
- VALUE OF ICE CREAM MARKET, USD MN, UNITED KINGDOM, 2017 - 2029
- Figure 99:
- VOLUME OF ICE CREAM MARKET, METRIC TONNES, REST OF EUROPE, 2017 - 2029
- Figure 100:
- VALUE OF ICE CREAM MARKET, USD MN, REST OF EUROPE, 2017 - 2029
- Figure 101:
- VOLUME OF ICE CREAM MARKET BY DISTRIBUTION CHANNEL, METRIC TONNES, MIDDLE EAST, 2017 - 2029
- Figure 102:
- VALUE OF ICE CREAM MARKET BY DISTRIBUTION CHANNEL, USD MN, MIDDLE EAST, 2017 - 2029
- Figure 103:
- VOLUME SHARE OF ICE CREAM MARKET, BY DISTRIBUTION CHANNEL , %, MIDDLE EAST, 2017 VS 2023 VS 2029
- Figure 104:
- VALUE SHARE OF ICE CREAM MARKET, BY DISTRIBUTION CHANNEL , %, MIDDLE EAST, 2017 VS 2023 VS 2029
- Figure 105:
- VOLUME OF ICE CREAM MARKET BY COUNTRY, METRIC TONNES, MIDDLE EAST, 2017 - 2029
- Figure 106:
- VALUE OF ICE CREAM MARKET BY COUNTRY, USD MN, MIDDLE EAST, 2017 - 2029
- Figure 107:
- VOLUME SHARE OF ICE CREAM MARKET, BY COUNTRY , %, MIDDLE EAST, 2017 VS 2023 VS 2029
- Figure 108:
- VALUE SHARE OF ICE CREAM MARKET, BY COUNTRY , %, MIDDLE EAST, 2017 VS 2023 VS 2029
- Figure 109:
- VOLUME OF ICE CREAM MARKET, METRIC TONNES, BAHRAIN, 2017 - 2029
- Figure 110:
- VALUE OF ICE CREAM MARKET, USD MN, BAHRAIN, 2017 - 2029
- Figure 111:
- VOLUME OF ICE CREAM MARKET, METRIC TONNES, IRAN, 2017 - 2029
- Figure 112:
- VALUE OF ICE CREAM MARKET, USD MN, IRAN, 2017 - 2029
- Figure 113:
- VOLUME OF ICE CREAM MARKET, METRIC TONNES, KUWAIT, 2017 - 2029
- Figure 114:
- VALUE OF ICE CREAM MARKET, USD MN, KUWAIT, 2017 - 2029
- Figure 115:
- VOLUME OF ICE CREAM MARKET, METRIC TONNES, OMAN, 2017 - 2029
- Figure 116:
- VALUE OF ICE CREAM MARKET, USD MN, OMAN, 2017 - 2029
- Figure 117:
- VOLUME OF ICE CREAM MARKET, METRIC TONNES, QATAR, 2017 - 2029
- Figure 118:
- VALUE OF ICE CREAM MARKET, USD MN, QATAR, 2017 - 2029
- Figure 119:
- VOLUME OF ICE CREAM MARKET, METRIC TONNES, SAUDI ARABIA, 2017 - 2029
- Figure 120:
- VALUE OF ICE CREAM MARKET, USD MN, SAUDI ARABIA, 2017 - 2029
- Figure 121:
- VOLUME OF ICE CREAM MARKET, METRIC TONNES, UNITED ARAB EMIRATES, 2017 - 2029
- Figure 122:
- VALUE OF ICE CREAM MARKET, USD MN, UNITED ARAB EMIRATES, 2017 - 2029
- Figure 123:
- VOLUME OF ICE CREAM MARKET, METRIC TONNES, REST OF MIDDLE EAST, 2017 - 2029
- Figure 124:
- VALUE OF ICE CREAM MARKET, USD MN, REST OF MIDDLE EAST, 2017 - 2029
- Figure 125:
- VOLUME OF ICE CREAM MARKET BY DISTRIBUTION CHANNEL, METRIC TONNES, NORTH AMERICA, 2017 - 2029
- Figure 126:
- VALUE OF ICE CREAM MARKET BY DISTRIBUTION CHANNEL, USD MN, NORTH AMERICA, 2017 - 2029
- Figure 127:
- VOLUME SHARE OF ICE CREAM MARKET, BY DISTRIBUTION CHANNEL , %, NORTH AMERICA, 2017 VS 2023 VS 2029
- Figure 128:
- VALUE SHARE OF ICE CREAM MARKET, BY DISTRIBUTION CHANNEL , %, NORTH AMERICA, 2017 VS 2023 VS 2029
- Figure 129:
- VOLUME OF ICE CREAM MARKET BY COUNTRY, METRIC TONNES, NORTH AMERICA, 2017 - 2029
- Figure 130:
- VALUE OF ICE CREAM MARKET BY COUNTRY, USD MN, NORTH AMERICA, 2017 - 2029
- Figure 131:
- VOLUME SHARE OF ICE CREAM MARKET, BY COUNTRY , %, NORTH AMERICA, 2017 VS 2023 VS 2029
- Figure 132:
- VALUE SHARE OF ICE CREAM MARKET, BY COUNTRY , %, NORTH AMERICA, 2017 VS 2023 VS 2029
- Figure 133:
- VOLUME OF ICE CREAM MARKET, METRIC TONNES, CANADA, 2017 - 2029
- Figure 134:
- VALUE OF ICE CREAM MARKET, USD MN, CANADA, 2017 - 2029
- Figure 135:
- VOLUME OF ICE CREAM MARKET, METRIC TONNES, MEXICO, 2017 - 2029
- Figure 136:
- VALUE OF ICE CREAM MARKET, USD MN, MEXICO, 2017 - 2029
- Figure 137:
- VOLUME OF ICE CREAM MARKET, METRIC TONNES, UNITED STATES, 2017 - 2029
- Figure 138:
- VALUE OF ICE CREAM MARKET, USD MN, UNITED STATES, 2017 - 2029
- Figure 139:
- VOLUME OF ICE CREAM MARKET, METRIC TONNES, REST OF NORTH AMERICA, 2017 - 2029
- Figure 140:
- VALUE OF ICE CREAM MARKET, USD MN, REST OF NORTH AMERICA, 2017 - 2029
- Figure 141:
- VOLUME OF ICE CREAM MARKET BY DISTRIBUTION CHANNEL, METRIC TONNES, SOUTH AMERICA, 2017 - 2029
- Figure 142:
- VALUE OF ICE CREAM MARKET BY DISTRIBUTION CHANNEL, USD MN, SOUTH AMERICA, 2017 - 2029
- Figure 143:
- VOLUME SHARE OF ICE CREAM MARKET, BY DISTRIBUTION CHANNEL , %, SOUTH AMERICA, 2017 VS 2023 VS 2029
- Figure 144:
- VALUE SHARE OF ICE CREAM MARKET, BY DISTRIBUTION CHANNEL , %, SOUTH AMERICA, 2017 VS 2023 VS 2029
- Figure 145:
- VOLUME OF ICE CREAM MARKET BY COUNTRY, METRIC TONNES, SOUTH AMERICA, 2017 - 2029
- Figure 146:
- VALUE OF ICE CREAM MARKET BY COUNTRY, USD MN, SOUTH AMERICA, 2017 - 2029
- Figure 147:
- VOLUME SHARE OF ICE CREAM MARKET, BY COUNTRY , %, SOUTH AMERICA, 2017 VS 2023 VS 2029
- Figure 148:
- VALUE SHARE OF ICE CREAM MARKET, BY COUNTRY , %, SOUTH AMERICA, 2017 VS 2023 VS 2029
- Figure 149:
- VOLUME OF ICE CREAM MARKET, METRIC TONNES, ARGENTINA, 2017 - 2029
- Figure 150:
- VALUE OF ICE CREAM MARKET, USD MN, ARGENTINA, 2017 - 2029
- Figure 151:
- VOLUME OF ICE CREAM MARKET, METRIC TONNES, BRAZIL, 2017 - 2029
- Figure 152:
- VALUE OF ICE CREAM MARKET, USD MN, BRAZIL, 2017 - 2029
- Figure 153:
- VOLUME OF ICE CREAM MARKET, METRIC TONNES, REST OF SOUTH AMERICA, 2017 - 2029
- Figure 154:
- VALUE OF ICE CREAM MARKET, USD MN, REST OF SOUTH AMERICA, 2017 - 2029
- Figure 155:
- MOST ACTIVE COMPANIES BY NUMBER OF STRATEGIC MOVES, COUNT, GLOBAL, 2017 - 2029
- Figure 156:
- MOST ADOPTED STRATEGIES, COUNT, GLOBAL, 2017 - 2029
- Figure 157:
- VALUE SHARE OF MAJOR PLAYERS, %, GLOBAL
Ice Cream Industry Segmentation
Off-Trade, On-Trade are covered as segments by Distribution Channel. Africa, Asia-Pacific, Europe, Middle East, North America, South America are covered as segments by Region.| Distribution Channel | Off-Trade | Convenience Stores | |
| Online Retail | |||
| Specialist Retailers | |||
| Supermarkets and Hypermarkets | |||
| Others (Warehouse clubs, gas stations, etc.) | |||
| On-Trade | |||
| Region | Africa | By Distribution Channel | |
| Egypt | |||
| Nigeria | |||
| South Africa | |||
| Rest of Africa | |||
| Asia-Pacific | By Distribution Channel | ||
| Australia | |||
| China | |||
| India | |||
| Indonesia | |||
| Japan | |||
| Malaysia | |||
| New Zealand | |||
| Pakistan | |||
| South Korea | |||
| Rest of Asia Pacific | |||
| Europe | By Distribution Channel | ||
| Belgium | |||
| France | |||
| Germany | |||
| Italy | |||
| Netherlands | |||
| Russia | |||
| Spain | |||
| Turkey | |||
| United Kingdom | |||
| Rest of Europe | |||
| Middle East | By Distribution Channel | ||
| Bahrain | |||
| Iran | |||
| Kuwait | |||
| Oman | |||
| Qatar | |||
| Saudi Arabia | |||
| United Arab Emirates | |||
| Rest of Middle East | |||
| North America | By Distribution Channel | ||
| Canada | |||
| Mexico | |||
| United States | |||
| Rest of North America | |||
| South America | By Distribution Channel | ||
| Argentina | |||
| Brazil | |||
| Rest of South America | |||
Need A Different Region or Segment?
Customize Now
Market Definition
- Butter - Butter is a yellow-to-white solid emulsion of fat globules, water, and inorganic salts produced by churning the cream from cows’ milk
- Dairy - Dairy product include milk and any of the foods made from milk, including butter, cheese, ice cream, yogurt, and condensed and dried milk.
- Frozen Desserts - Frozen dairy dessert means and includes products containing milk or cream and other ingredients which are frozen or semi-frozen prior to consumption, such as ice milk or sherbet, including frozen dairy desserts for special dietary purposes, and sorbet
- Sour Milk Drinks - Sour milk is thick, curdled milk, with a sour taste, obtained from the fermentation of milk. Sour milk drinks such as kefir, laban, buttermilk have been considered in the study
| Keyword | Definition |
|---|---|
| Cultured Butter | Cultured butter is prepared by having the raw butter go through chemical processing and has been added with certain emulsifiers and foreign ingredients. |
| Uncultured Butter | This type of butter is one which has not been processed in any way |
| Natural Cheese | The type of cheese in its most natural form. It is made from natural and simple products and ingredients, including fresh and natural salts, natural colors, enzymes, and high-quality milk. |
| Processed Cheese | Processed cheese undergoes the same processes as natural cheese; however, it requires more steps and many different forms of ingredients. Making processed cheese involves melting natural cheese, emulsifying it, and adding preservatives and other artificial ingredients or colorings. |
| Single Cream | Single cream contains around 18% fat. It’s a single layer of cream that appears over boiled milk. |
| Double Cream | Double cream contains 48% fat, more than double the amount of fat of single cream. It’s heavier and thicker than single cream |
| Whipping Cream | This has a much higher fat percentage than single cream (36%). Used to top cakes, pies, and puddings and as a thickener for sauces, soups, and fillings. |
| Frozen Desserts | Desserts that are meant to be eaten in frozen condition. E.g., sherbets, sorbets, frozen yogurts |
| UHT Milk (Ultra-high temperature milk) | Milk heated at a very high temperature. Ultra-high-temperature processing (UHT) of milk involves heating for 1–8 sec at 135–154°C. which kills the spore-forming pathogenic microorganism, resulting in a product with a shelf-life of several months. |
| Non-dairy butter/Plant-based butter | Butter made from plant-derived oil such as coconut, palm, etc. |
| Non-dairy Yogurt | Yogurt made from typically made from nuts, like almonds, cashews, coconuts, and even other foods like soybeans, plantains, oats, and peas |
| On-trade | It refers to restaurants, QSRs, and bars. |
| Off-trade | It refers to supermarkets, hypermarkets, on-line channels, etc. |
| Neufchatel cheese | One of the oldest kinds of cheese in France. It is a soft, slightly crumbly, mold-ripened, bloomy-rind cheese made in the Neufchâtel-en-Bray region of Normandy. |
| Flexitarian | It refers to a consumer preferring a semi-vegetarian diet, that is centered on plant foods with limited or occasional inclusion of meat. |
| Lactose Intolerance | Lactose intolerance is a reaction in digestive system to lactose, the sugar in milk. It causes uncomfortable symptoms in response to the consumption of dairy products. |
| Cream Cheese | Cream cheese is a soft and creamy fresh cheese with a tangy taste made from milk and cream. |
| Sorbets | Sorbet is a frozen dessert made using ice combined with fruit juice, fruit purée, or other ingredients, such as wine, liqueur, or honey. |
| Sherbet | Sherbet is a sweetened frozen dessert made with fruit and some sort of dairy product such as milk or cream. |
| Shelf stable | Foods that can be safely stored at room temperature, or "on the shelf," for at least one year and do not have to be cooked or refrigerated to eat safely. |
| DSD | Direct Store Delivery is the process in supply chain management wherein the product is delivered from manufacturing plant directly to the retailer. |
| OU Kosher | Orthodox Union Kosher is a kosher certification agency based in New York City. |
| Gelato | Gelato is a frozen creamy dessert made with milk, heavy cream and sugar. |
| Grass-fed Cows | Grass-fed cows are allowed to graze in pastures, where they eat a variety of grasses and clover. |
Need More Details on Market Definition?
Ask a Question
Research Methodology
Mordor Intelligence follows a four-step methodology in all our reports.
- Step-1: Identify Key Variables: In order to build a robust forecasting methodology, the variables and factors identified in Step 1 are tested against available historical market numbers. Through an iterative process, the variables required for market forecast are set, and the model is built on the basis of these variables.
- Step-2: Build a Market Model: Market-size estimations for the forecast years are in nominal terms. Inflation is not a part of the pricing, and the average selling price (ASP) is kept constant throughout the forecast period for each country.
- Step-3: Validate and Finalize: In this important step, all market numbers, variables, and analyst calls are validated through an extensive network of primary research experts from the market studied. The respondents are selected across levels and functions to generate a holistic picture of the market studied.
- Step-4: Research Outputs: Syndicated Reports, Custom Consulting Assignments, Databases & Subscription Platforms

Get More Details On Research Methodology
Download PDF


