
Hyper Car Market Size and Share
Market Overview
| Study Period | 2019 - 2031 |
|---|---|
| Market Size (2026) | USD 24.06 Billion |
| Market Size (2031) | USD 55.69 Billion |
| Growth Rate (2026 - 2031) | 18.27 % |
| Fastest Growing Market | Asia Pacific |
| Largest Market | Europe |
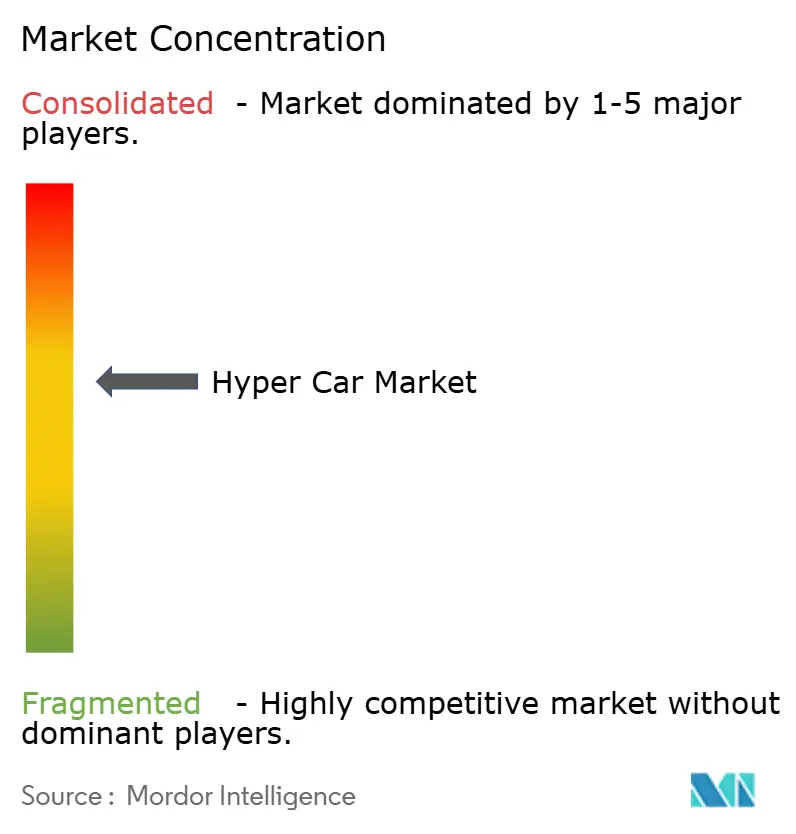
| Market Concentration | Medium |
Major Players *Disclaimer: Major Players sorted in no particular order Image © Mordor Intelligence. Reuse requires attribution under CC BY 4.0. | |
Hyper Car Market Analysis by Mordor Intelligence
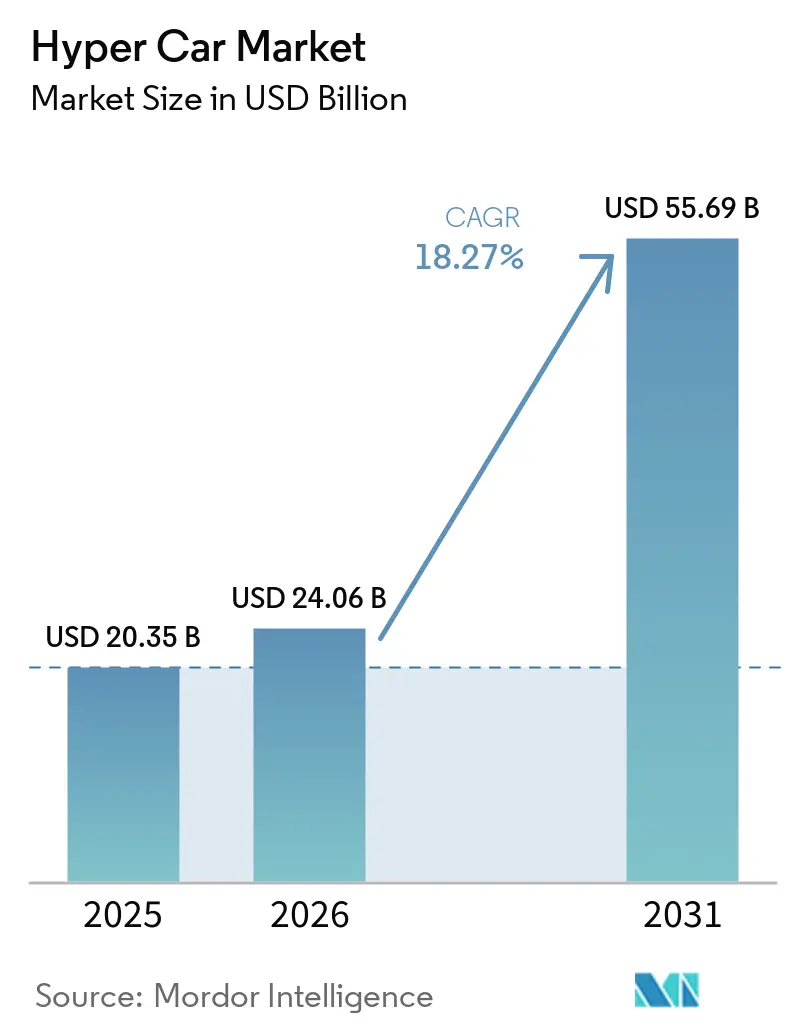
The Hyper Car Market size is expected to increase from USD 20.35 billion in 2025 to USD 24.06 billion in 2026 and reach USD 55.69 billion by 2031, growing at a CAGR of 18.27% during the forecast (2026-2031). Purchases are increasingly propelled by new wealth in Asia-Pacific and the Middle East, while electrified drivetrains move from a compliance feature to the core of performance strategy. Internal-combustion products still dominate revenue but now share launch calendars with hybrid and battery-electric flagships that reach 1,800 horsepower. The adoption of lightweight composites and AI-driven aerodynamic optimization shortens development cycles, lowering entry barriers for digitally native brands. Supply-chain fragility for titanium and aerospace-grade carbon fiber remains the primary operational risk, followed by the cash intensity of low-volume manufacturing and the slow rollout of ultra-fast chargers, which limit the touring range of pure-electric vehicles.
Key Report Takeaways
- By propulsion type, internal-combustion engines held 58.71% of the Hypercar market share in 2025, whereas battery-electric models are advancing at an 18.29% CAGR through 2031.
- By end use, private ownership accounted for 83.37% share of the Hypercar market size in 2025, while the racing segment is growing at an 18.31% CAGR through 2031.
- By vehicle type, coupes led with 71.24% revenue share in 2025; roadsters are forecast to post the highest CAGR at 18.38% to 2031.
- By engine capacity, powerplants above 2,500 cc captured 83.45% of 2025 volume, yet sub-1,500 cc hybrids are projected to expand at an 18.35% CAGR over the forecast period.
- By geography, Europe led with 36.56% revenue share in 2025, while Asia-Pacific is projected to expand at an 18.37% CAGR through 2031.
Note: Market size and forecast figures in this report are generated using Mordor Intelligence’s proprietary estimation framework, updated with the latest available data and insights as of January 2026.
Global Hyper Car Market Trends and Insights
Drivers Impact Analysis*
| Driver | (~) % Impact on CAGR Forecast | Geographic Relevance | Impact Timeline |
|---|---|---|---|
| Surge in Ultra-High-Net-Worth Individuals in APAC & Middle East | +4.2% | Asia-Pacific core, Middle East (UAE, Saudi Arabia), spillover to Singapore, Hong Kong | Medium term (2-4 years) |
| Rising Demand for Ultra-Luxury High-Performance Vehicles | +3.8% | Global, with concentration in Europe, North America, APAC | Short term (≤ 2 years) |
| Rapid Electrification & Hybridization of Hypercars | +3.5% | Global, led by Europe (Euro 7 compliance), North America (CARB ZEV mandates) | Medium term (2-4 years) |
| Breakthroughs in Lightweight Composite & Carbotanium Structures | +2.1% | Global, with R&D hubs in Italy (Pagani), UK (McLaren), Sweden (Koenigsegg) | Long term (≥ 4 years) |
| AI-Driven Aerodynamic / Digital-Twin Optimisation Shortening Development Cycles | +1.9% | Global, early adoption in UK (McLaren), Germany (Porsche), France (Bugatti Rimac) | Medium term (2-4 years) |
| Crypto-Wealth & NFT-Linked Limited Editions Unlocking New Buyer Pools | +1.3% | Global, concentrated in North America, Europe, select APAC cities (Singapore, Hong Kong) | Short term (≤ 2 years) |
| Source: Mordor Intelligence | |||
Surge in Ultra-High-Net-Worth Individuals in Asia-Pacific & Middle East
In the Gulf and prominent Asian financial hubs, liquid wealth is reshaping strategies for limited-run flagship allocations. Recently, the United Arab Emirates has seen a significant influx of new millionaires and is positioned at the center of a substantial intergenerational wealth transfer projected over the coming decades. In response, brands have unveiled bespoke showrooms in Dubai and Riyadh, featuring gold inlay packages and upholstery tailored to regional tastes. Per-capita luxury car penetration in the UAE now surpasses that of North America, as evidenced by the region's higher deliveries compared to the United States. Additionally, final-assembly satellites have emerged in regional free-trade zones, capitalizing on import-duty savings and fostering closer ties with customers [1]“Annual Delivery Report 2025,” Koenigsegg Automotive AB, koenigsegg.com .
Rapid Electrification & Hybridization of Hypercars
Hybrid systems have evolved from mere compliance measures to pivotal performance enhancers. Ferrari’s F80 pairs a powerful twin-turbo V6 engine with a high-performance electric motor. Meanwhile, Bugatti’s Tourbillon integrates an advanced electric drivetrain with its formidable V16 engine. This synergy allows instant electric torque to mitigate turbo lag and enables sophisticated software-controlled torque vectoring. As of late 2026, Euro 7 regulations will mandate real-world particle-number testing, pushing automakers towards plug-in platforms capable of completing city cycles without activating the engine. While charging infrastructure is still catching up, the advent of advanced battery technology offers the tantalizing prospect of rapid top-ups, but only at select high-capacity charging stations [2]“F80 World Premiere,” Ferrari S.p.A., ferrari.com .
Breakthroughs in Lightweight Composite & Carbotanium Structures
Pagani's Carbotanium melds carbon fiber with titanium, achieving aerospace-grade stiffness at a fraction of the weight of aluminum. Koenigsegg's lightweight carbon tub passes FIA crash tests, demonstrating the feasibility of achieving extremely low curb weights, even with hybrid batteries. While there's a pronounced reliance on China for titanium sponge and on several Japanese-American firms for carbon precursors, in-house composite centers in Sheffield and Sant'Agata have transitioned from mere cost considerations to vital supply-assurance assets [3]“Carbotanium Technology Note,” Pagani Automobili,pagani.com .
AI-Driven Aerodynamic and Digital-Twin Optimization Shortening Development Cycles
McLaren’s March 2026 cloud partnership uses machine-learning CFD to generate thousands of wing iterations overnight, cutting traditional wind-tunnel loops from weeks to days. Dassault-based digital twins enable Peugeot Sport to skip physical crash rigs until final sign-off, slicing budgets by up to 30%. The technology levels the playing field for niche builders such as Czinger, which now enter performance parity without a private tunnel. Data quality is the chief brake: models trained on combustion cooling do not always translate to battery-thermal regimes [4]“Cloud CFD Partnership Release,” McLaren Automotive Limited, mclaren.com .
Restraints Impact Analysis*
| Restraint | (~) % Impact on CAGR Forecast | Geographic Relevance | Impact Timeline |
|---|---|---|---|
| Extremely High R&D and Manufacturing Cost Base | -2.8% | Global, acute in North America and Europe due to labor costs | Medium term (2-4 years) |
| Supply-Chain Scarcity of Aerospace-Grade Composites & Titanium | -2.3% | Global, concentrated risk in APAC (China 63% titanium capacity), Russia (11%) | Short term (≤ 2 years) |
| Stringent Global Emissions / Noise Regulations | -1.6% | Europe (Euro 7 Nov 2026), North America (CARB ZEV mandates), limited APAC impact | Medium term (2-4 years) |
| Immature Ultra-Fast-Charging Infrastructure for BEV Hypercars | -1.4% | Global, most acute in Europe and North America; APAC infrastructure developing faster | Long term (≥ 4 years) |
| Source: Mordor Intelligence | |||
Extremely High R&D and Manufacturing Cost Base
Crafting a hypercar is a capital-intensive endeavor, often not recouped over limited production runs. Czinger’s 21C, which requires extensive hand assembly and incorporates numerous 3D-printed parts, commands a significant entry price. Bugatti’s Tourbillon, with plans for modest annual production through the end of the decade, finds itself vulnerable to currency and interest-rate fluctuations on its income statement. Meanwhile, Porsche faced a substantial impairment in the mid-2020s due to setbacks with its dedicated BEV platform, highlighting the inherent risks even established brands encounter.
Supply-Chain Scarcity of Aerospace-Grade Composites & Titanium
China holds a significant majority share of the titanium sponge market, with Russia contributing a notable portion as well. Meanwhile, the high-modulus carbon fiber sector is led by key players such as Toray, Hexcel, and Teijin. Even a minor export restriction can disrupt production within a short timeframe. Recently, spot titanium prices experienced a substantial increase following the introduction of Russian quotas. This rise negatively impacted configured margins, particularly for buyers who had prepaid at fixed rates. Brands without captive layup capabilities or long-term offtake agreements are the most exposed to these market fluctuations.
*Our forecasts treat driver/restraint impacts as directional, not additive. The impact forecasts reflect baseline growth, mix effects, and variable interactions.
Segment Analysis
By Propulsion Type: Electrification Rewrites Performance Hierarchy
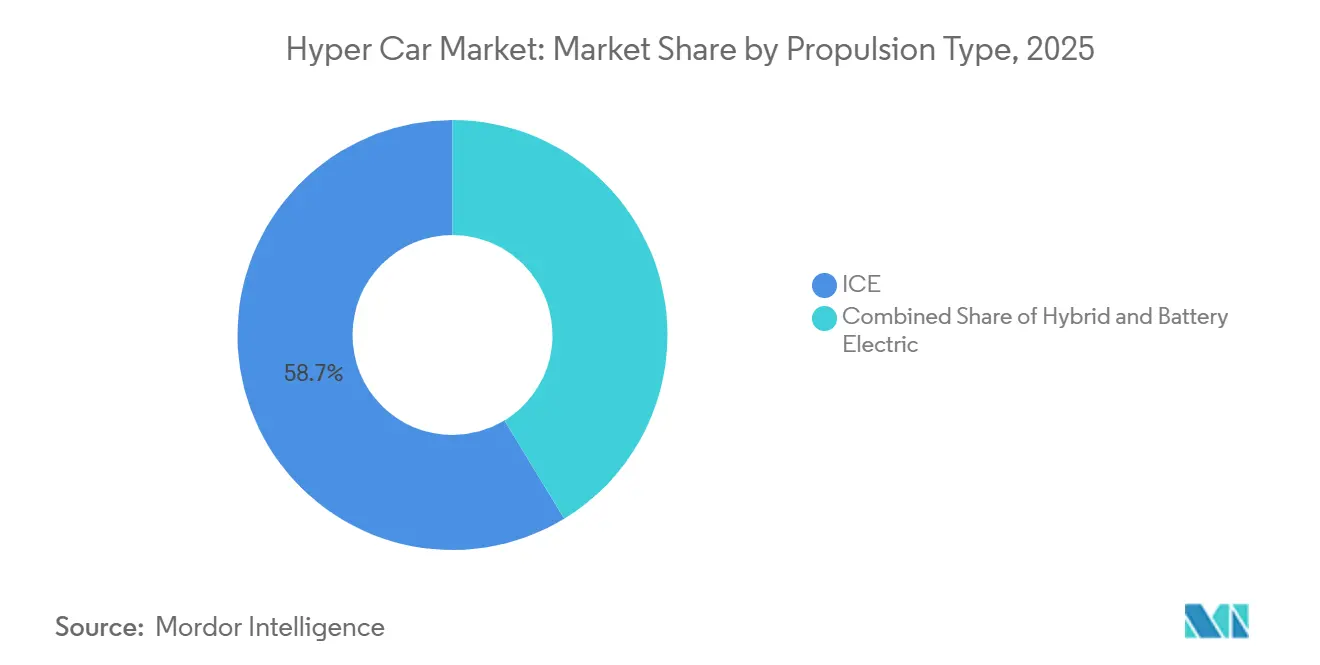
Battery-electric variants are projected to log an 18.29% CAGR to 2031, the fastest climb among powertrains. Internal-combustion architectures still held 58.71% Hypercar market share in 2025, yet momentum favors hybrids that add electric torque for lap-time gains without retiring signature V8 or V12 soundtracks. Ferrari and Bugatti now publish combined system horsepower rather than engine figures alone, signaling the strategic pivot.
Pure BEV flagships like Rimac’s Nevera remain niche at 150 units each, but record laps and 800-volt fast-charge capability demonstrate that silence no longer means slower. Infrastructure coverage and silicon-carbide inverter costs moderate near-term uptake, yet Euro 7 compliance pressures ensure dual-motor or tri-motor setups appear in every new product plan through 2031.


By End Use: Private Ownership Dominates, Racing Segment Accelerates
Private collectors accounted 83.37% of 2025 deliveries. They value provenance and scarcity, prompting OEMs to cap production runs at below 500 units and to request multi-year deposits. McLaren’s W1 allocation closed inside 48 hours, validating the approach.
Racing applications, however, are forecast to increase at an 18.31% CAGR. Updated FIA Le Mans Hypercar rules require road-legal counterparts, moving power-unit learning straight from the 24-hour circuit to suburban garages. Fourteen makers now contest the World Endurance grid, up from eight in 2023, and revenue streams from spare parts and technical updates turn motorsport into a self-funding laboratory.
By Vehicle Type: Coupes Lead, Roadsters Gain Momentum
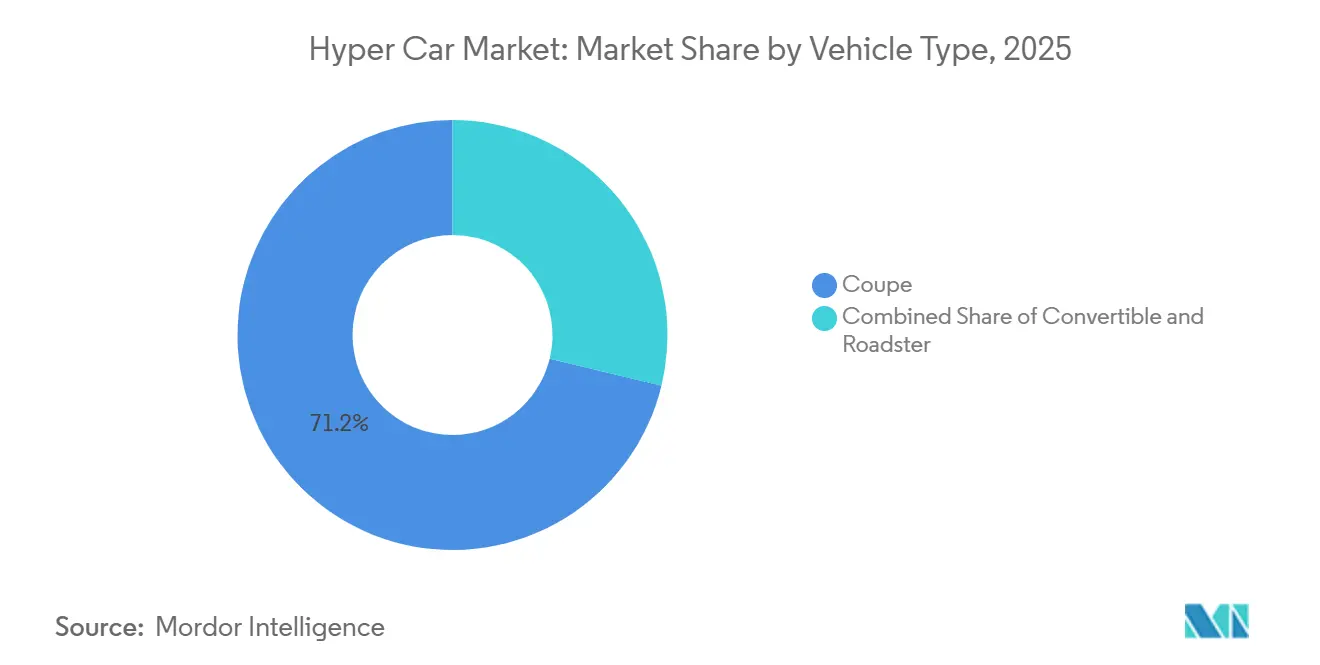
Coupes secured 71.24% of 2025 revenue due to superior torsional rigidity, which matters for aerodynamics at 400 kilometers per hour. Roadsters, though, show the quickest climb at 18.38% CAGR as buyers chase open-air drama during weekend outings. Pagani and Lamborghini charge 10–15% premiums for roof-delete variants, confirming willingness to trade tenths of a second for visceral experience.
Structural engineering now offsets the loss of roof strength with thicker sills and carbon-fiber tubs, adding only 30–50 kilograms. Performance penalties stay below 0.2 seconds to 100 kilometers per hour, a margin private owners rarely notice. Regional climates drive allocation choices, with Gulf states and California favoring roadsters while Northern Europe sticks to coupes.
By Engine Capacity: Full-Size Dominance, Compact Downsizing Emerges
Engines above 2,500 cc owned 83.45% of 2025 sales, yet compact hybrids under 1,500 cc are forecast to expand at an 18.35% CAGR as turbos and electric boost lift specific output. Ferrari’s new 3.0-liter V6 produces 1,200 horsepower, proving displacement no longer dictates performance.
Euro 7 real-driving tests for particles below 10 nanometers push brands toward smaller swept volumes that can idle through city centers in electric mode. Customer perception remains a hurdle, but synthesized acoustics and Le Mans storylines soften resistance. Specific output, not cubic capacity, becomes the bragging metric in dealer lounges, underscoring the decoupling of emotion from displacement.
Geography Analysis
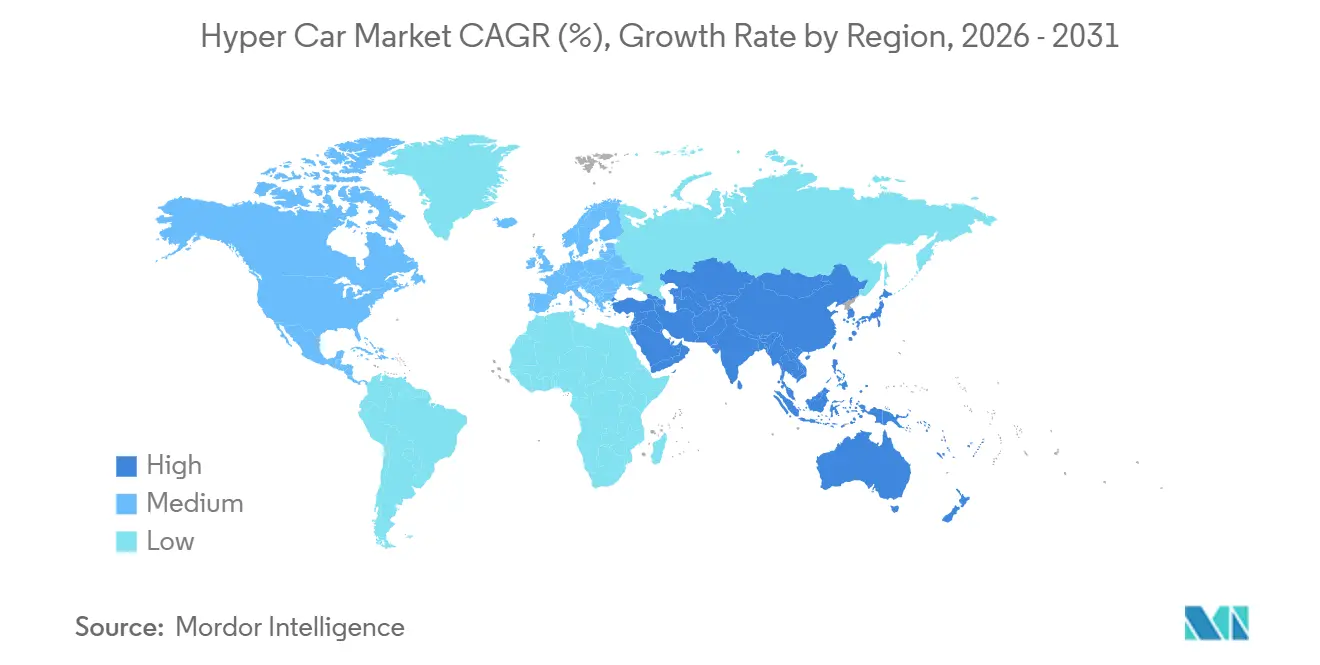
Europe accounted for 36.56% of 2025 revenue, anchored by Italy’s Motor Valley and the United Kingdom’s advanced composite hubs. Euro 7 implementation in November 2026 adds new durability and particulate requirements on top of existing tailpipe limits, raising per-unit compliance costs by up to 20%. Heritage factories in Maranello and Sant’Agata respond by shifting to plug-in architectures that allow zero-emission city cruising while retaining trademark exhaust notes on alpine passes. British engineering remains resilient despite Brexit friction, leveraging university clusters to feed skilled labor to McLaren and Aston Martin. German OEMs exploit parent-group scale by sharing 800-volt platforms across volume models to amortize research costs.
Asia-Pacific is on track for an 18.37% CAGR to 2031, the fastest of any region. New millionaires in China, Singapore, and the Gulf funnel deposits toward hypercar allocations for years in advance. Dedicated boutiques in Shanghai and Dubai now feature region-specific configurations, including gold-leaf interiors and local language infotainment skins. Import duties in China hover at 25% for engines above 3.0 liters, nudging some makers to explore bonded-zone assembly to shave tariff exposure. Singapore’s zero-growth vehicle policy forces astronomical certificate costs, yet electric hypercars escape surtax, giving Rimac and Pininfarina a unique tailwind.
North America remains the single largest country market, with California, Florida, and Texas leading registrations. Silicon Valley liquidity swings can whiplash allocation schedules, but established collector culture supports steady secondary pricing. South America remains small, constrained by high duties and currency volatility, while Africa, excluding South Africa, contributes negligible volume. The Middle East continues to over-index on a per-capita basis, and showroom expansions in Riyadh and Doha are timed to major motorsport events to attract traveling buyers.

Competitive Landscape
Heritage leaders—Ferrari, Lamborghini, McLaren, and Porsche—still command mindshare, yet technology disruptors narrow the credibility gap. Rimac supplies the entire electric drivetrain for Bugatti’s new Tourbillon and holds a near-equal equity position in the joint venture, exporting silicon-carbide inverter expertise to a brand built on quad-turbo W16S. Additive manufacturing, showcased by Czinger’s 21C with more than 350 printed metal parts, bypasses expensive casting lines and slashes tooling lead times from years to months.
AI-driven aerodynamics, now run on cloud GPUs, cut wind-tunnel loops to days, letting niche builders chase world-record speeds without billion-dollar facilities. Strategy now splits between brand equity and technology. In contrast, Rimac and Pininfarina compete on zero-emission lap times and over-the-air performance updates. Chinese luxury EV entries loom as a cost threat but still trail on global brand cachet.
Supply-chain choke points for titanium and high-modulus carbon risk margin shocks across the board, driving vertical integration moves such as McLaren’s Sheffield composites center and Lamborghini’s internal carbon shop. Start-ups still face homologation and distribution hurdles, yet capital-light digital engineering tools shrink the gap, particularly in the battery-electric sub-segment, where drivetrain suppliers can white-label modules.
Hyper Car Industry Leaders
Ferrari
Bugatti Rimac
Automobili Lamborghini
McLaren
Porsche
- *Disclaimer: Major Players sorted in no particular order

Recent Industry Developments
- August 2026: Hennessey Special Vehicles revealed the all-new Hennessey Blackbird, an aerospace-inspired, naturally aspirated, manual-transmission touring hypercar. Designed for drivers who value emotion, engagement, and long-distance usability, the new model combines sculptural design and analog interaction with significant performance capability. Inspired by the legendary Lockheed SR-71 Blackbird aircraft, the new Hennessey hypercar offers an authentic alternative to increasingly complex, digitized, and hybridized modern hypercars.
- June 2025: McLaren officially unveiled its highly anticipated FIA World Endurance Championship (WEC) Hypercar, marking its return to top-tier endurance racing and targeting the 2026 24 Hours of Le Mans. The British automaker developed the new contender under the LMH (Le Mans Hypercar) regulations, combining advanced hybrid technology with McLaren’s aerodynamic expertise and signaling a new chapter in its motorsport legacy.


Global Hyper Car Market Report Scope
The scope of the report includes Propulsion Type (ICE and More), End Use (Private and Racing), Vehicle Type (Coupe, Convertible, and Roadster), Engine Capacity (Compact, Mid-size, and Full-size), and Geography.
| ICE |
| Hybrid |
| Battery Electric |
| Private |
| Racing |
| Coupe |
| Convertible |
| Roadster |
| Compact (Less than 1500 cc) |
| Mid-size (1500–2500 cc) |
| Full-size (More than 2500 cc) |
| North America | United States |
| Canada | |
| Rest of North America | |
| South America | Brazil |
| Argentina | |
| Rest of South America | |
| Europe | United Kingdom |
| Germany | |
| Spain | |
| Italy | |
| France | |
| Russia | |
| Rest of Europe | |
| Asia-Pacific | India |
| China | |
| Japan | |
| Indonesia | |
| Malaysia | |
| Singapore | |
| Vietnam | |
| Philippines | |
| South Korea | |
| Rest of Asia-Pacific | |
| Middle East and Africa | United Arab Emirates |
| Saudi Arabia | |
| Turkey | |
| Egypt | |
| South Africa | |
| Rest of Middle East and Africa |
| By Propulsion Type | ICE | |
| Hybrid | ||
| Battery Electric | ||
| By End Use | Private | |
| Racing | ||
| By Vehicle Type | Coupe | |
| Convertible | ||
| Roadster | ||
| By Engine Capacity | Compact (Less than 1500 cc) | |
| Mid-size (1500–2500 cc) | ||
| Full-size (More than 2500 cc) | ||
| By Geography | North America | United States |
| Canada | ||
| Rest of North America | ||
| South America | Brazil | |
| Argentina | ||
| Rest of South America | ||
| Europe | United Kingdom | |
| Germany | ||
| Spain | ||
| Italy | ||
| France | ||
| Russia | ||
| Rest of Europe | ||
| Asia-Pacific | India | |
| China | ||
| Japan | ||
| Indonesia | ||
| Malaysia | ||
| Singapore | ||
| Vietnam | ||
| Philippines | ||
| South Korea | ||
| Rest of Asia-Pacific | ||
| Middle East and Africa | United Arab Emirates | |
| Saudi Arabia | ||
| Turkey | ||
| Egypt | ||
| South Africa | ||
| Rest of Middle East and Africa | ||


Key Questions Answered in the Report
How fast is the Hypercar market expected to grow between 2026 and 2031?
The hypercar market is expected to reach USD 24.06 billion in 2026 and expand at a CAGR of 18.27% during 2026-2031.
Which propulsion type will lead future growth?
Battery-electric and plug-in hybrid models are projected to record the highest growth, with battery-electric variants advancing at an 18.29% CAGR through 2031.
What region offers the strongest demand outlook?
Asia-Pacific is forecast to post the quickest regional expansion at an 18.37% CAGR to 2031, fueled by rising ultra-high-net-worth populations.
Which segment holds the largest current market share?
Internal-combustion hypercars commanded 58.71% of 2025 revenue, retaining the largest slice despite electrification momentum.
What competitive factors shape supplier strategy?
Control of titanium and aerospace-grade carbon fiber, vertical integration of composites, and partnerships for advanced drivetrains govern cost and speed to market.
How concentrated is the supplier landscape?
The top five manufacturers together account for roughly three-fifths of annual unit sales, indicating moderate concentration with space for nimble challengers.
Page last updated on:


 Your data is secure and never sold or shared.


