
Hydroponics Market Size and Share
Market Overview
| Study Period | 2021 - 2031 |
|---|---|
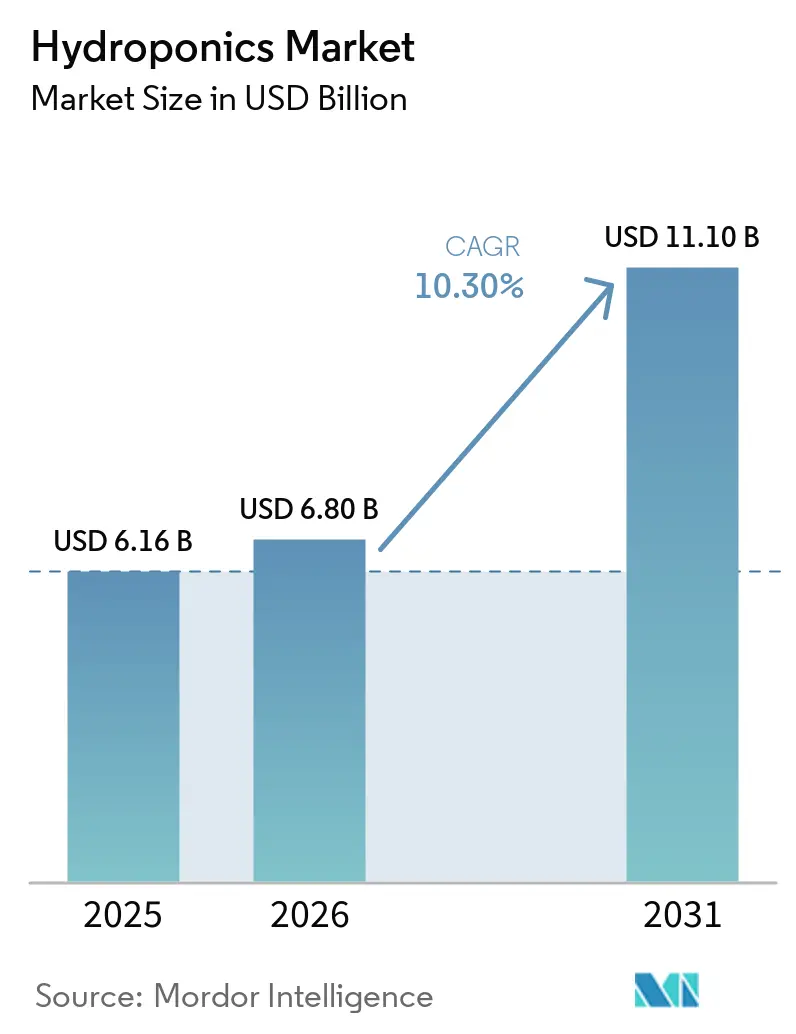
| Market Size (2026) | USD 6.80 Billion |
| Market Size (2031) | USD 11.10 Billion |
| Growth Rate (2026 - 2031) | 10.30 % |
| Fastest Growing Market | Asia Pacific |
| Largest Market | Europe |
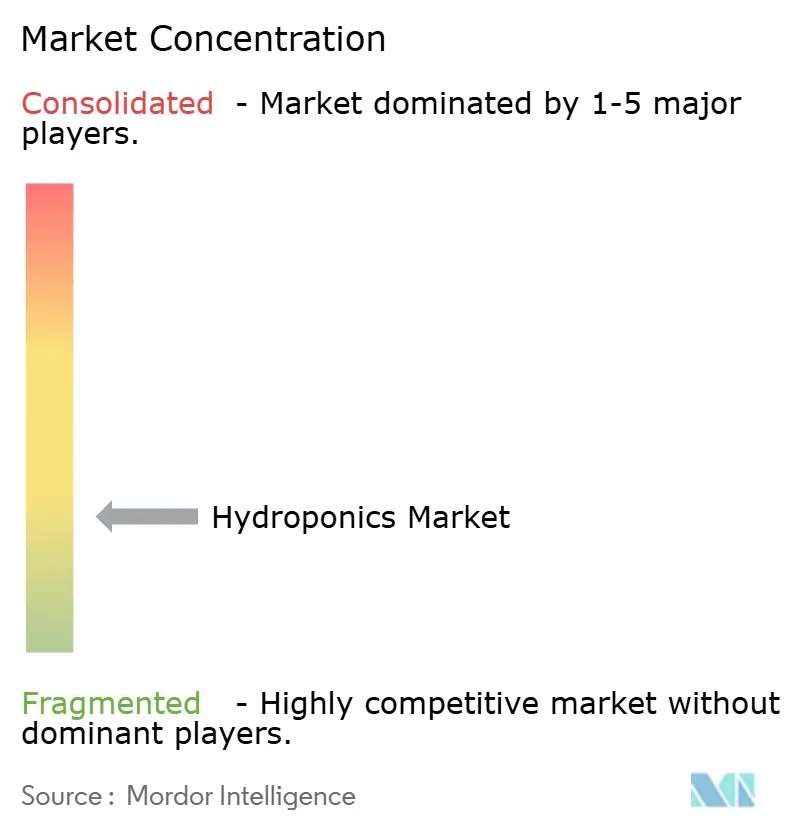
| Market Concentration | Low |
Major Players *Disclaimer: Major Players sorted in no particular order Image © Mordor Intelligence. Reuse requires attribution under CC BY 4.0. | |
Hydroponics Market Analysis by Mordor Intelligence
The hydroponics market size was estimated at USD 6.16 billion in 2025 and USD 6.80 billion in 2026 and is forecast to reach USD 11.10 billion by 2031, expanding at a 10.30% CAGR from 2026 to 2031. Structural pressure on land availability, climate volatility, and rising water costs underpin demand as growers pivot from soil cultivation to closed-loop systems. While greenhouse hydroponics dominate value creation, the indoor vertical farms segment is accelerating in response to an urban food security agenda that prioritizes year-round supply and short delivery radii. Government research grants, notably the United States Department of Agriculture (USDA) program, which allocates USD 10 million annually to controlled-environment studies, position hydroponic technologies as a mainstream food-security lever rather than an experimental niche[1]Source: U.S. Department of Agriculture National Institute of Food and Agriculture, “7 USC 5925g – Specialty Crop Research Initiative,” NIFA.usda.gov. Retailers prefer pesticide-free produce that meets strict traceability standards, thereby bolstering the adoption of leafy greens while biopharma buyers pull herbs into a higher-margin trajectory. Competitive fragmentation persists because automation specialists and lighting innovators can still enter at different points in the value chain, even as larger operators expand their footprints to secure purchasing power. Carbon-credit monetization for low-emission produce adds a parallel revenue stream for growers who invest in renewable energy, creating additional momentum behind the technology.
Key Report Takeaways
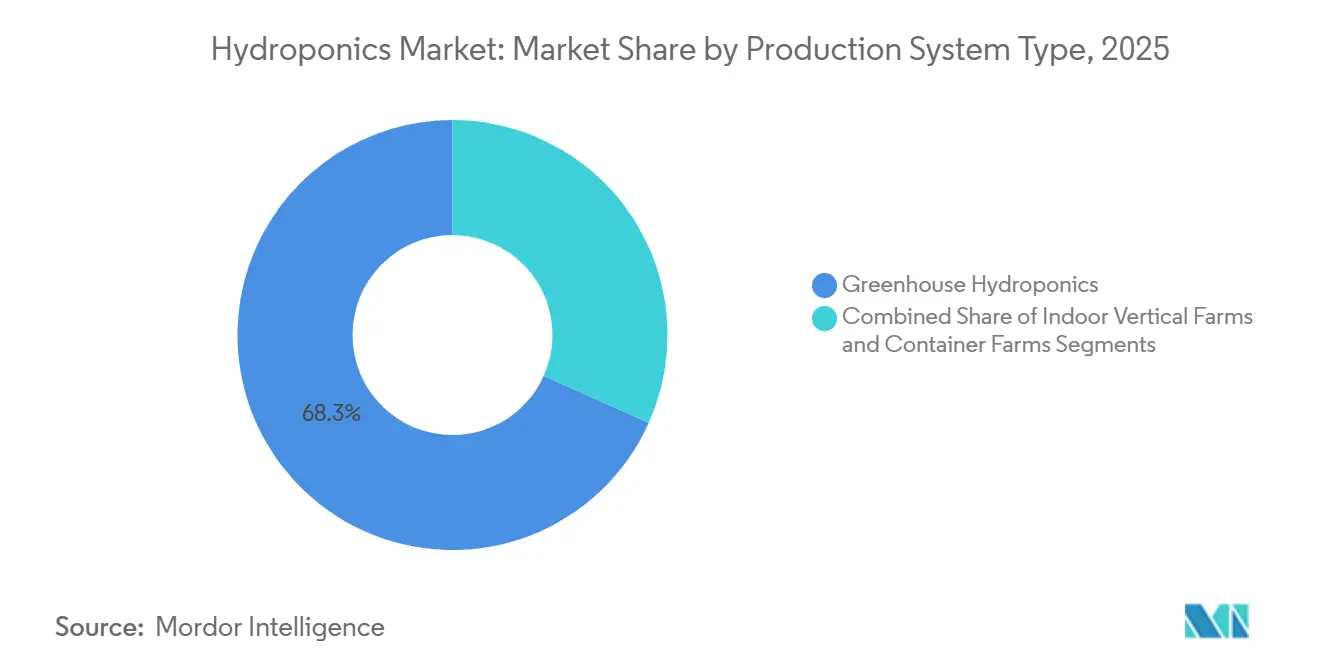
- By production system type, accounted for 68.3% of the hydroponics market size in 2025, while indoor vertical farms are forecast to expand at a 13.4% CAGR through 2031.
- By crop type, leafy greens captured 47.2% of value in 2025, and herbs and microgreens are projected to advance at a 12.6% CAGR to 2031.
- By production scale, large commercial operations held 55.8% of the hydroponics market share in 2025, whereas small systems are projected to grow at a 13.3% CAGR between 2026 and 2031.
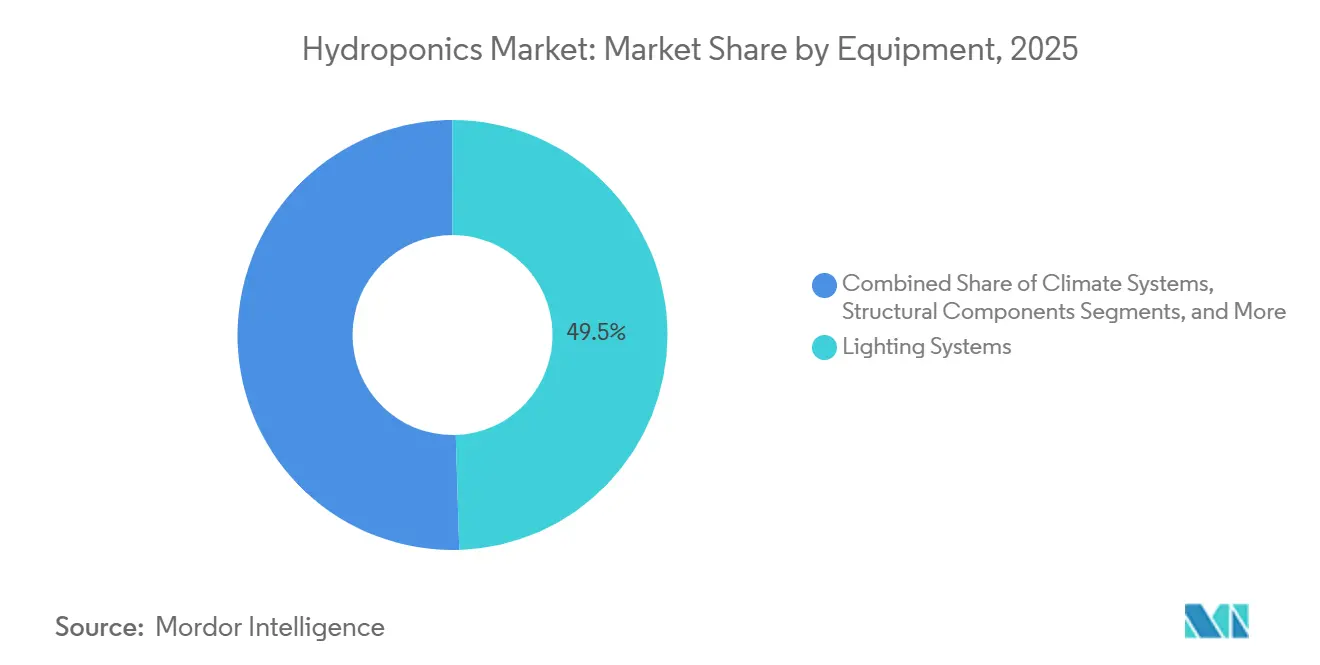
- By equipment, lighting systems accounted for 49.5% of the hydroponics market in 2025, with climate systems projected to register a 12.8% CAGR through 2031.
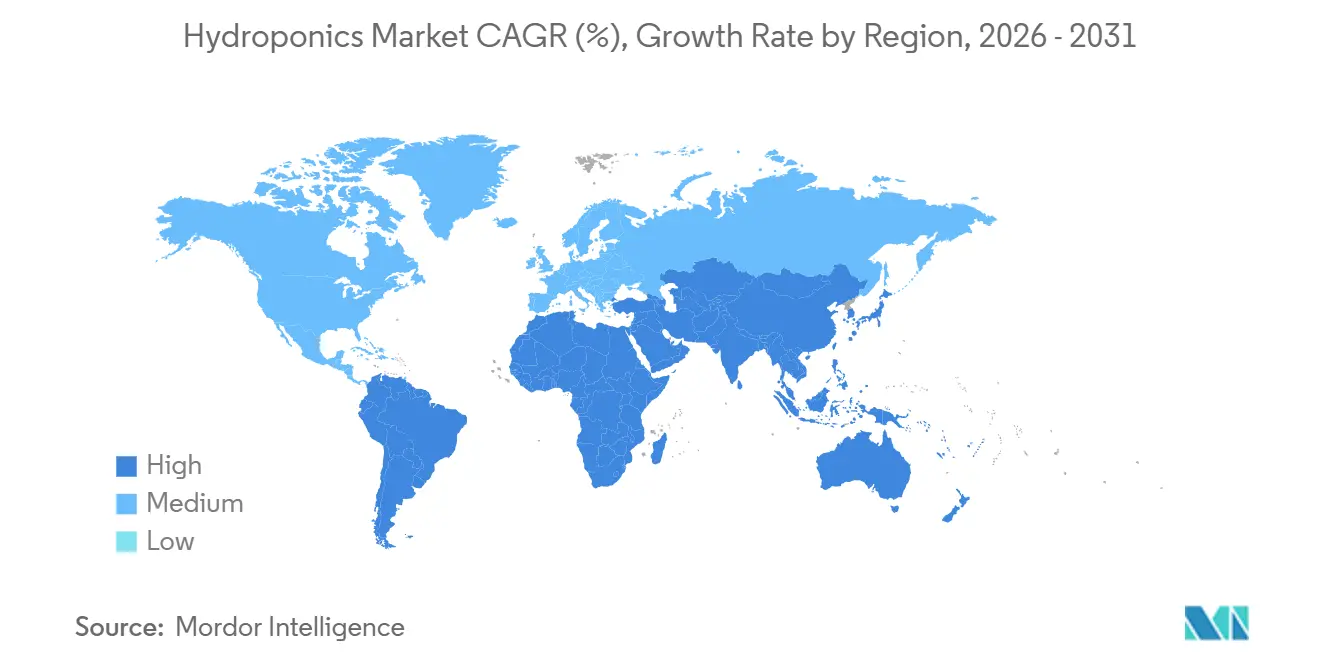
- By geography, Europe accounted for 34.3% of the 2025 hydroponics market revenue, while the Asia-Pacific region is positioned for the fastest regional expansion at a 12.2% CAGR through 2031.
Note: Market size and forecast figures in this report are generated using Mordor Intelligence’s proprietary estimation framework, updated with the latest available data and insights as of January 2026.
Market Trends and Insights
Drivers Impact Analysis of Hydroponics Market*
| Driver | (~) % Impact on CAGR Forecast | Geographic Relevance | Impact Timeline |
|---|---|---|---|
| Controlled-environment food-security initiatives | +2.1% | Asia-Pacific, Middle East, and North America | Medium term (2-4 years) |
| Declining arable land per capita | +1.8% | Asia-Pacific and Middle East | Long term (≥ 4 years) |
| Year-round output advantages | +1.6% | North America, Europe, and Asia-Pacific | Short term (≤ 2 years) |
| Carbon-credit revenue stacking | +0.9% | Europe, North America, emerging Asia-Pacific | Long term (≥ 4 years) |
| Pharmaceutical-grade ingredient demand | +0.7% | North America, Europe, and Asia-Pacific | Medium term (2-4 years) |
| Urban wastewater-reuse regulations | +0.6% | Europe, Middle East, and Asia-Pacific urban centers | Medium term (2-4 years) |
| Source: Mordor Intelligence | |||
Controlled-Environment Food-Security Initiatives
National programs now position hydroponics within critical-infrastructure strategies that mitigate climate shocks. The United States Department of Agriculture (USDA) funds urban and indoor agriculture under 7 USC 5925g, turning research grants into pilot facilities that demonstrate commercial viability. Japan’s Ministry of Agriculture, Forestry and Fisheries (MAFF) targets 50% smart-agriculture adoption by 2030, prioritizing controlled environments that stabilize output during typhoon seasons. China’s National Smart Agriculture Action Plan mandates the use of the Internet of Things (IoT) and artificial intelligence in facility agriculture pilots, thereby accelerating domestic investment in this sector[2]Source: Ministry of Agriculture and Rural Affairs, “National Smart Agriculture Action Plan,” Moa.gov.cn. India’s Digital Agriculture Mission earmarked Rs 2,817 crore (USD 338 million) for precision-farming infrastructure, while the Clean Plant Programme channels Rs 1,765.67 crore (USD 212 million) into disease-free nursery material[3]Source: Ministry of Agriculture and Farmers Welfare, “Digital Agriculture Mission,” Agricoop.nic.in. These policies compress financing costs and standardize regulatory pathways, speeding adoption among commercial growers who once viewed hydroponics as capital-prohibitive.
Declining Arable Land per Capita
Land scarcity intensifies the economic rationale for soilless cultivation. The Food and Agriculture Organization (FAO) recorded a 20% drop in global arable land per person, from 0.24 to 0.20 hectares between 2000 and 2024. Urban sprawl in the Asia-Pacific and water constraints in the Middle East leave limited expansion room for soil farming. Hydroponics multiplies usable growing area up to 80 times by stacking production vertically or fitting systems onto non-arable sites, such as rooftops and warehouses. The Netherlands utilizes greenhouse clusters to export high-yield vegetables, despite having scarce farmland, illustrating the potential leverage when land is no longer the limiting factor. As per-capita arable acreage becomes increasingly scarce, the cost-benefit of vertical infrastructure outweighs land acquisition, especially near high-density cities.
Year-Round Output Advantages
Reliability attracts retailers seeking a consistent supply on the shelf. Village Farms International Inc. ships tomatoes and cucumbers year-round from its greenhouses in Texas and Canada, operating under multi-year contracts that buffer the supply chain against weather-related shortages. Plenty Unlimited Inc. signed a deal with 7-Eleven to serve 1,300 stores in 2024, utilizing indoor farms to mitigate seasonal variability. Controlled environments cut crop loss from frost, drought, and pests, with programmable lighting and nutrient delivery, and trim harvest cycles to as few as 30 days for leafy greens. Retailers thus prefer hydroponic suppliers for predictable volume, which in turn supports premium pricing and long-term demand.
Pharmaceutical-Grade Ingredient Demand
Biopharmaceutical firms value contaminant-free biomass for the extraction of recombinant proteins and nutraceuticals. Peer-reviewed work in Public Library of Science (PLOS) Biology validates plant molecular farming as a significant biomanufacturing pillar that relies on sterile, tightly controlled facilities. AeroFarms Inc. operates an AgX site focused on speed breeding and phytochemical production in indoor environments, highlighting how high-margin pharmaceutical contracts justify vertical-farm capital expenditures. Health Canada’s 2024 guidance officially frames hydroponics as a containment strategy that prevents gene flow, positioning the segment as a supplier to vaccine and antibody pipelines. Premium pricing, often 10-50 times the value of food-grade products, offsets operating expenses and insulates margins from fluctuations in fresh-produce prices.
Restraints Impact Analysis of Hydroponics Market*
| Restraint | (~) % Impact on CAGR Forecast | Geographic Relevance | Impact Timeline |
|---|---|---|---|
| High capital expenditure for large systems | −1.4% | Global, strongest in emerging markets | Short term (≤ 2 years) |
| Energy-cost sensitivity for artificial lighting | −1.1% | Global, acute in Europe and Middle East | Short term (≤ 2 years) |
| Tightening micronutrient-discharge regulations | −0.6% | North America, Europe, and Middle East urban centers | Medium term (2-4 years) |
| Limited seed genetics for hydroponic inputs | −0.4% | Global | Long term (≥ 4 years) |
| Source: Mordor Intelligence | |||
High Capital Expenditure for Large Systems
Turnkey vertical farming systems can exceed USD 1,000 per square meter, often extending payback periods beyond seven years for smaller investors. While several large-scale operators historically relied on substantial venture funding to finance automated facilities, capital intensity has proven challenging for highly leveraged expansion strategies, as evidenced by the Chapter 11 filing of Kalera PLC. Village Farms International Inc. opted to privatize its fresh-produce unit for USD 40 million and a 37.9% equity stake in 2025, illustrating structural pressure to streamline its balance sheet. To mitigate upfront investment risk, smaller growers are increasingly favoring modular or leased cultivation formats that shift capital expenditures toward operating expenses, thereby improving flexibility and reducing financial exposure.
Energy-Cost Sensitivity for Artificial Lighting
Indoor farms using light-emitting diode (LED) arrays face volatile power prices that can exceed the revenue from producing at USD 12 cents per kilowatt-hour. The United States Energy Information Administration (EIA) pegs industrial averages at USD 7.5 cents, but California and the Northeast run higher, thereby shrinking margins[4]Source: United States Energy Information Administration, “Electric Power Monthly,” EIA.gov. Signify’s 2023 GreenPower LED Toplighting Compact 2.0 boosts photosynthetic-photon efficiency, cutting kilowatt-hours per kilogram, yet adoption demands capital outlays that squeeze smaller operators. Middle-Eastern utilities impose higher industrial tariffs, so joint ventures such as Plenty Unlimited Inc. and Mawarid include on-site solar generation to stabilize cost.
*Our forecasts treat driver/restraint impacts as directional, not additive. The impact forecasts reflect baseline growth, mix effects, and variable interactions.
Hydroponics Market Segment Analysis
By Production System Type:
Vertical Farms Capture Urban Density PremiumGreenhouse hydroponics generated 68.3% of 2025 revenue, supported by the 5.5 million-square-foot Village Farms International Inc. complex in Texas and extensive Dutch clusters that combine sunlight with waste-heat capture. Indoor vertical farms are projected to grow at a 13.4% CAGR through 2031, as municipalities pursue resilient last-mile supply chains while minimizing refrigerated freight. Container-based hydroponic systems, although representing a niche market, continue to address remote and decentralized demand through modular, rapidly deployable units suited for institutional, research, and emergency-response settings.
Automation compresses labor costs, narrowing the historical cost gap between vertical structures and greenhouses. Signify’s newest LEDs reduce energy draw, making high-rise grow towers more viable in power-intensive regions. Plenty Unlimited Inc.’s USD 680 million joint venture with Mawarid signals that Middle Eastern capital is gravitating toward vertical platforms where conventional greenhouse cooling is cost-prohibitive. As lighting and robotics mature, the hydroponics market will shift further toward multi-tier formats that capitalize on scarce urban land.


By Crop Type:
Herbs Surge on Biopharma ContractsLeafy greens accounted for 47.2% of the hydroponics market size in 2025, driven by 30-45 day harvest cycles that maximize turns and cash flow for hydroponic growers. Herbs and microgreens are anticipated to post a 12.6% CAGR through 2031, as pharmaceutical and nutraceutical buyers demand pesticide-free biomass with traceable phytochemical profiles. Tomatoes, cucumbers, and peppers collectively form the second-largest value block, utilizing high-wire greenhouse systems to produce year-round volumes in line with supermarket contracts.
Pharmaceutical uptake redefines revenue potential. AeroFarms Inc. partners with drug developers to produce specialty extracts, illustrating how growers can pivot from commodity produce to active-ingredient supply. Leaf-crop dominance will continue near large consumer bases because rapid cycles offset operating expenses, yet the margin upside in high-value herbs acts as a buffer against energy volatility. Over time, carbon-pricing schemes that reward lower water and energy footprints may further shift production toward crops with superior efficiency metrics.
By Production Scale:
Small Urban Installations Disrupt Last-Mile LogisticsLarge facilities captured 55.8% of the hydroponics market share in 2025, driven by increasing purchasing power for energy and nutrients, as well as multi-year contracts with national retailers. Small sites are expanding at a 13.3% CAGR as container farms and rooftop greenhouses cut delivery miles and cold-chain loss, meeting city sustainability mandates. Medium-scale operators serve regional grocery networks but feel margin pressure from both larger rivals and premium urban boutiques.
BrightFarms (Cox Enterprises) opened a greenhouse in Yorkville in December 2024, marking the first of three planned hubs. This initiative showcases the utilization of large-scale facilities for decentralized hydroponics production, while maintaining economies of scale and integrating with national retail networks. Medium-scale urban hydroponics models, such as those managed by Gotham Greens, utilize rooftop spaces to overcome land constraints. These facilities supply regional grocery partners within hours of harvest, ensuring product freshness. At the small-scale level, modular and turnkey container-based hydroponic systems are increasingly adopted by restaurants, educational institutions, and community operators, enabling hyper-local sourcing without the capital burden of purpose-built facilities.
By Equipment:
Lighting Dominates While Climate Control AcceleratesLighting systems accounted for 49.5% of the hydroponics market in 2025, confirming that light-emitting diode arrays remain the largest single purchase for growers. Signify’s GreenPower LED Toplighting Compact 2.0 enhances photosynthetic-photon efficiency, enabling hydroponics farm operators to reduce kilowatt-hour usage per kilogram of produce and protect margins from power price fluctuations. Hydroponics greenhouse producers utilize hybrid lighting to supplement sunlight during low-radiance hours, while indoor vertical farms rely on full-spectrum fixtures to achieve consistent yields, albeit at higher costs. Structural frames, irrigation components, and pumps follow in spending but have longer replacement cycles than lamps and drivers, keeping lighting the top budget priority across hydroponics production models.
Climate systems remain the fastest-growing, projected to grow at a 12.8% CAGR from 2026 to 2031, as operators adopt advanced heating, ventilation, and cooling systems to stabilize growing conditions in their grow rooms. Modern systems integrate temperature, humidity, and carbon dioxide management with lighting schedules, boosting biomass output without requiring additional floor space. Container farms and rooftop greenhouses install modular chillers and heat-recovery ventilators to meet urban energy codes, while large sites retrofit sensor networks to comply with stricter nutrient-discharge rules. As renewable energy and water-recirculation mandates increase, growers invest in intelligent climate platforms that synchronize pumps, fans, and dosing valves, optimizing controlled-environment facilities.
Geography Analysis
Europe Hydroponics Market
Europe accounted for 34.3% of the hydroponics market revenue in 2025, driven by Dutch greenhouse exports and stringent European Union (EU) discharge regulations that have spurred innovations in water reuse. While regional growth is evident, it's tempered by already high capacities and rising electricity costs. Instead of expanding acreage, Germany, the United Kingdom, France, and Spain focus on retrofitting with LEDs and automating processes to enhance efficiency. Russia faces technological access challenges, whereas Scandinavian nations experiment with carbon-neutral greenhouses, harnessing geothermal and hydropower.
APAC Hydroponics Market
Asia-Pacific is set to lead with a 12.2% CAGR, outpacing other major regions. China's "Smart Agriculture Action Plan" for November 2024 allocates state funds to IoT-driven controlled environments, with a particular focus on hydroponics. India’s Digital Agriculture Mission has allocated Rs 2,817 crore (approximately USD 338 million) to precision and controlled-environment systems, fostering the adoption of hydroponics to enhance water efficiency and yield stability. Japan aims for a 50% adoption rate of smart agriculture by 2030, with a focus on hydroponics for typhoon-resilient and climate-controlled production. In Australia, hydroponic greenhouse sites are being expanded near coastal cities to ensure a steady supply of fresh produce to urban areas. Meanwhile, Southeast Asian urban centers are experimenting with vertical hydroponics to reduce their dependence on imported produce.
The Americas and MEA Hydroponics Market
In North America, the market growth is driven by funding from the United States Department of Agriculture, as well as investments from companies such as Village Farms International Inc. and Plenty Unlimited Inc., which are advancing large-scale, controlled-environment farming. In the Middle East, countries such as the United Arab Emirates and Saudi Arabia are investing in hydroponic systems to reduce import costs and conserve groundwater, as demonstrated by Abu Dhabi’s 10-hectare AgTech Park initiative. In South America, urban hydroponic projects in Brazil and Argentina are driving progress. Meanwhile, in Africa, targeted deployments in South Africa and Kenya are leveraging hydroponics to address post-harvest losses, despite challenges related to power grid reliability.

Regulatory Landscape
Regulatory oversight for controlled-environment agriculture (CEA) continues to separate facility and environmental compliance requirements from product and process standards that cover inputs, sanitation, and labeling. In the United States, USDA programs for urban and innovative production, along with ongoing National Organic Program (NOP) discussions, keep hydroponics within mainstream agricultural oversight, while state-level measures increasingly focus on permitting and siting. Maryland enacted HB 1342 in 2026, creating a Controlled-Environment and Hydroponic Agriculture Program Fund and directing the Department of Agriculture to provide a one-stop portal for permitting and licensing information, with zoning provisions intended to support urban deployment. Colorado HB22-1301 also formalized definitions for controlled-environment agricultural facilities for a property-tax exemption framework through January 2028, pointing to continued state attention on the economics of CEA infrastructure.
Outside the United States, regulators and standards bodies are translating technical requirements into equipment and operating procedures for growers and suppliers. In China, Shanghai issued DB31/T 1493-2024, a technical specification for the quality and safety of soilless cultivation of leafy vegetables, covering process and performance requirements such as steam sterilization for substrate recycling and targets for nutrient-solution circulation efficiency. In the European Union, organic production rules remain a key compliance and marketing anchor for produce sold under organic claims, and the distinction between soil-based organic standards and hydroponic production continues to influence certification strategy for operators selling into premium retail channels.
Competitive Landscape
The hydroponics market remains fragmented, allowing regional specialists and niche operators to thrive alongside larger players. Village Farms International Inc. leverages its 5.5 million-square-foot greenhouse footprint to lock in high-volume contracts across North America and Europe. Plenty Unlimited Inc. raised its profile through a USD 680 million partnership with Mawarid to build vertical farms across the Middle East. Gotham Greens Inc. and BrightFarms emphasize proximity production and automation to capture freshness premiums while trimming labor overhead.
Strategies in the hydroponics market primarily focus on three areas, including achieving cost leadership through scaled, controlled-environment systems, leveraging urban proximity with water-efficient hydroponic setups, and specializing in high-value crops through precise nutrient control. AeroFarms Inc. exemplifies the third strategy by utilizing hydroponic precision to produce pharmaceutical-grade biomass, adopting an R&D-driven model that positions the company upstream of traditional commodity produce. Equipment providers like Signify are addressing niche opportunities, focusing on the increasing efficiency of hydroponics-specific LED technology. Additionally, stricter regulations on nutrient discharge and carbon reporting are driving the adoption of closed-loop hydroponic systems. This trend is accelerating the integration of IoT sensors, AI-driven climate control, and recirculating water treatment technologies, while simultaneously increasing entry barriers for new players.
In the current hydroponics market, technology adoption has become a fundamental requirement rather than a competitive advantage. Operators failing to meet increasing standards for efficiency, traceability, and regulatory compliance risk losing retailer contracts. Meanwhile, well-capitalized companies are consolidating hydroponic capacity through mergers, joint ventures, and privatization efforts. This trend is exemplified by Village Farms International Inc.’s restructuring plans for 2025, which reflect the ongoing consolidation within the industry.
Hydroponics Industry Leaders
Gotham Greens
BrightFarms (COX Enterprises, Inc)
Village Farms International Inc.
AeroFarms Inc.
Plenty Unlimited Inc.
- *Disclaimer: Major Players sorted in no particular order
Hydroponics Market Companies Covered in this Report
- BrightFarms (Cox Enterprises)
- Plenty Unlimited Inc.
- Crop One Holdings Inc.
- 80 Acres Urban Agriculture Inc.
- Little Leaf Farms Inc.
- GoodLeaf Farms (McCain Foods Ltd.)
- Pure Harvest Smart Farms Holding
- Green Sense Farms Holdings Inc.
- Nordic Harvest A/S
- Oishii Farm Corporation
- Gotham Greens Inc.
- AeroFarms Inc.
- Village Farms International Inc.
- Sundrop Farms (Centuria Capital Group)
- GrowUp Farms (Sun Capital Partners)

Market Opportunities and Future Outlook
Near-term expansion opportunities are anchored by government-backed CEA deployment and adoption funding. In the United States, Maryland's 2026 HB 1342 creates a dedicated fund and workforce measures for controlled-environment and hydroponic agriculture, taking effect July 1, 2026. Canada also announced a CAD 750 million allocation toward a Controlled Environment Agriculture Technology Adoption Stream under a national food-security framework.
Across technology and business models, automation, sealed environments, and retail-integrated scaling remain central themes, supported by ongoing capital formation behind operators focused on repeatable unit economics. In 2026, Oishii closed USD 150 million Series C to scale its indoor smart-farm model and advance robotics integration, while Hippo Harvest completed a USD 30 million Series C to support expansion at a new 30-acre facility in Hollister, California. Singapore launched an automated multi-storey hydroponic farm in January 2026 (Greenphyto), and Japan opened a fully sealed vertical-farming pilot in Tokyo in July 2026 (Plantx). In parallel, FAO and the Saint Vincent and the Grenadines Ministry of Agriculture opened a hydroponic training facility at Orange Hill in June 2026.
Recent Industry Developments in Hydroponics Market
- June 2026: Village Farms International commenced cultivation at its Phase II greenhouse facility in Groningen, Netherlands, after receiving final regulatory approvals. The start-up expands modern controlled-environment production capacity in a key European greenhouse hub and strengthens the company's ability to serve year-round supply programs.
- May 2026: Oishii closed USD 150 million Series C to scale its indoor smart farm platform and advance robotics integration. The financing underscores capital formation for automation-driven indoor farming and will accelerate deployment of its modular climate-control and harvest robotics.
- December 2024: BrightFarms (Cox Enterprises) opened its Yorkville, Illinois greenhouse, the first of three planned hubs referenced in its expansion roadmap. The site supports proximity production for leafy greens and adds regional capacity designed to shorten delivery radii and improve supply consistency for retail customers.


Hydroponics Market Report Scope and Research Methodology
Market Definition and Coverage
The hydroponics market covers the value of soilless crop cultivation systems where plants are grown using nutrient solutions, with or without an inert medium, across commercial and smaller-scale controlled environments.
Scope exclusions: We exclude aquaponics and soil-based greenhouse or open-field cultivation, even if similar crops are produced.
Segments Covered in This Report
- By Production System
- Greenhouse Hydroponics
- Indoor Vertical Farms
- Container Farms
- By Crop Type
- Leafy Greens
- Tomatoes
- Cucumbers
- Peppers
- Herbs and Microgreens
- By Equipment
- Lighting Systems
- Irrigation Components and Pumps
- Climate Systems
- Automation and Control Systems
- Structural Components
- By Production Scale
- Large
- Medium
- Small
- By Geography
- North America
- United States
- Canada
- Rest of North America
- South America
- Brazil
- Argentina
- Rest of South America
- Europe
- Germany
- Netherlands
- United Kingdom
- France
- Spain
- Rest of Europe
- Asia-Pacific
- China
- Japan
- India
- Australia
- Rest of Asia-Pacific
- Middle East
- United Arab Emirates
- Saudi Arabia
- Rest of Middle East
- Africa
- South Africa
- Kenya
- Rest of Africa
- North America
Data Sources, Market Sizing, and Validation
Desk Research
Desk research was used to set the basic demand context and keep the model grounded in observable signals. We reviewed public agriculture and food production statistics, water-use and efficiency publications, and controlled-environment growing guidance from official and research bodies such as the USDA, FAO, national agriculture ministries, and land-grant or equivalent universities.
To translate adoption into market value, we also used sources such as customs trade data for greenhouse and irrigation equipment categories, patent databases to track innovation activity in nutrient dosing and lighting controls, and trade association websites that describe system formats and good practices. Company annual reports, investor decks, and product catalogs were used to understand typical system bundles and price ranges, while a paid subscription for company financials and news helped cross-check expansion announcements and capacity additions. These examples are not exhaustive, and many other public and paid sources were referred to for data collection, validation, and research clarification.
Primary Interviews and Surveys
Primary work was used to pressure-test the desk assumptions on what is actually being installed, upgraded, and replaced in hydroponic farms. We spoke with a mix of system integrators, equipment and input suppliers, growers, and technical advisors across major producing markets, so regional differences between greenhouse-led deployments and fully indoor setups could be reflected.
These discussions helped confirm typical bill-of-material splits (for example, irrigation hardware versus lighting versus controls), realistic utilization patterns by crop cycle, and how pricing changes are being applied in contracts and catalogs before the final totals were locked.
Distribution of primary research fieldwork respondents
| Company type | Respondent position | Region |
|---|---|---|
| Top tier: 28% | CXOs: 13% | APAC: 45% |
| Mid tier: 50% | Functional/Unit leaders: 36% | EMEA: 31% |
| Smaller Players: 22% | Managers: 51% | Americas: 24% |
Market-Sizing & Forecasting
Sizing starts from a top-down build where controlled-environment cultivation activity is translated into hydroponics value using adoption shares by growing environment and crop mix, then converted using typical system and input spend per cultivated area. That view is corroborated with selective bottom-up approximations, such as sampling average selling prices for core equipment bundles, combining them with installation volumes indicated by channel checks, and using supplier-side revenue signals to adjust totals when gaps appear.
Key model inputs include indicative cultivated area under hydroponic production, greenhouse versus fully indoor penetration, crop-cycle intensity for leafy greens and vine crops, replacement rates for lighting and pumps, nutrient consumption patterns, and average project size by grower type. When data is thin for smaller countries, we apply proxy ratios from comparable climates and income levels, then recheck results against import trends and expert feedback.
Forecasts are built using scenario analysis that ties growth to drivers such as protected agriculture expansion, water-scarcity responses, capex availability, and the pace of commercial indoor farming rollouts. Assumptions are refined through primary inputs on pipeline visibility, expected price progression for key components, and the practical limits on scaling labor and energy costs.
Data Validation & Update Cycle
Validation is done by triangulating results across independent indicators, then running variance checks at regional and global levels so unusually high growth or abrupt price jumps are flagged early. We also review implied spend per unit area and per farm type, because these sanity checks often reveal scope leakage or double counting.
Before sign-off, the model and narrative go through multi-step analyst reviews, and experts are re-contacted when new build announcements or policy changes materially shift assumptions. Reports are refreshed annually, with interim updates for major events, and a final pre-delivery scan completed so clients receive the latest updated view.
Mordor Intelligence's Hydroponics Market Size Compared Against Other Published Estimates
Published hydroponics market values often vary because firms do not draw the market boundary in the same way, and the build-up variables are not always consistent. Differences usually show up around what gets counted as hydroponics value, how indoor farming overlaps are treated, and which price points and timing are used for currency conversion.
The benchmark table shows a wide spread, and in Mordor Intelligence's model the 2026 value is tied to hydroponics-specific systems and related components while excluding aquaponics and soil-based cultivation, which can lower totals versus estimates that fold those adjacent categories into one combined pool.
Benchmark comparison
| Source | Market Size | Gaps in Research Methodology |
|---|---|---|
| Mordor Intelligence | USD 6.80 B (2026) | |
| Global Consultancy A | USD 12.24 B (2025) | Uses a different base year and often treats the market as a broad end-user spend pool, which can include wider indoor farming overlap and a fuller capex bundle beyond hydroponics-specific equipment and inputs. |
| Industry Publisher B | USD 16.30 B (2025) | Applies a wider component and equipment scope across the value chain and uses a longer-horizon growth path, which can inflate the current-year total when adjacent controlled-environment items are counted together. |
Taken together, the spread is mainly explained by scope edges and timing, not by one single math step. By keeping inputs traceable to cultivated activity, system penetration, and realistic equipment and input spend, the estimate stays reproducible and easier to reconcile when assumptions are updated.


Key Questions Answered in the Report
How large is the hydroponics market in 2026?
The hydroponics market size is estimated at USD 6.80 billion in 2026 and is forecast to reach USD 11.10 billion by 2031, expanding at a 10.30% CAGR from 2026 to 2031.
Which production system leads revenue?
Greenhouse hydroponics contributes 68.3% of 2025 global sales, though indoor vertical farms are growing faster at a 13.4% CAGR.
Why are herbs and microgreens the fastest-growing crop group?
Pharmaceutical and nutraceutical companies pay premiums for traceable, contaminant-free herbs and microgreens, fueling a 12.6% CAGR to 2031.
Which region will grow the fastest through 2031?
Asia-Pacific leads with a 12.2% CAGR, driven by state investment in smart-agriculture programs across China, India, and Japan.
Page last updated on:


 Your data is secure and never sold or shared.


