
Hydrogen Gas Market Size and Share
Market Overview
| Study Period | 2021 - 2031 |
|---|---|
| Market Volume (2026) | 118.07 Million tons |
| Market Volume (2031) | 141.25 Million tons |
| Growth Rate (2026 - 2031) | 3.65 % |
| Fastest Growing Market | Middle East and Africa |
| Largest Market | Asia Pacific |
| Market Concentration | Medium |
Major Players *Disclaimer: Major Players sorted in no particular order Image © Mordor Intelligence. Reuse requires attribution under CC BY 4.0. | |
Hydrogen Gas Market Analysis by Mordor Intelligence
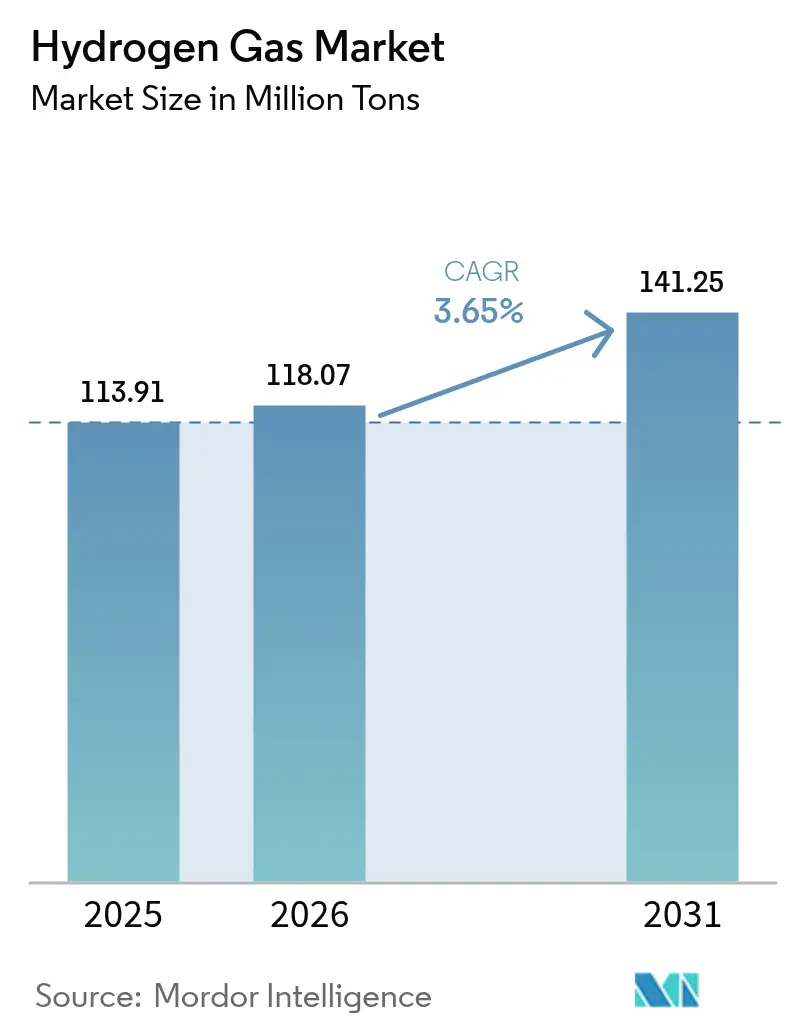
The Hydrogen Gas Market size was valued at 113.91 Million tons in 2025 and is estimated to grow from 118.07 Million tons in 2026 to reach 141.25 Million tons by 2031, at a CAGR of 3.65% during the forecast period (2026-2031). Tightening sulfur limits, mounting green-hydrogen incentives, and early commercial deployment of fuel-cell vehicles are reshaping the competitive landscape even though grey hydrogen still dominates installed capacity. Pipeline networks that serve refineries and fertilizer complexes anchor current volumes, but falling electrolyzer costs are unlocking distributed production near steel mills and mobility hubs. Asia-Pacific keeps the largest regional share, yet the Middle East and Africa post the highest growth as export-oriented megaprojects integrate low-cost solar with desalination. Meanwhile, fuel-cell trucks and buses move beyond pilots, supported by public-refueling corridors and OEM production commitments, which lift long-run demand visibility despite storage and transport bottlenecks.
Key Report Takeaways
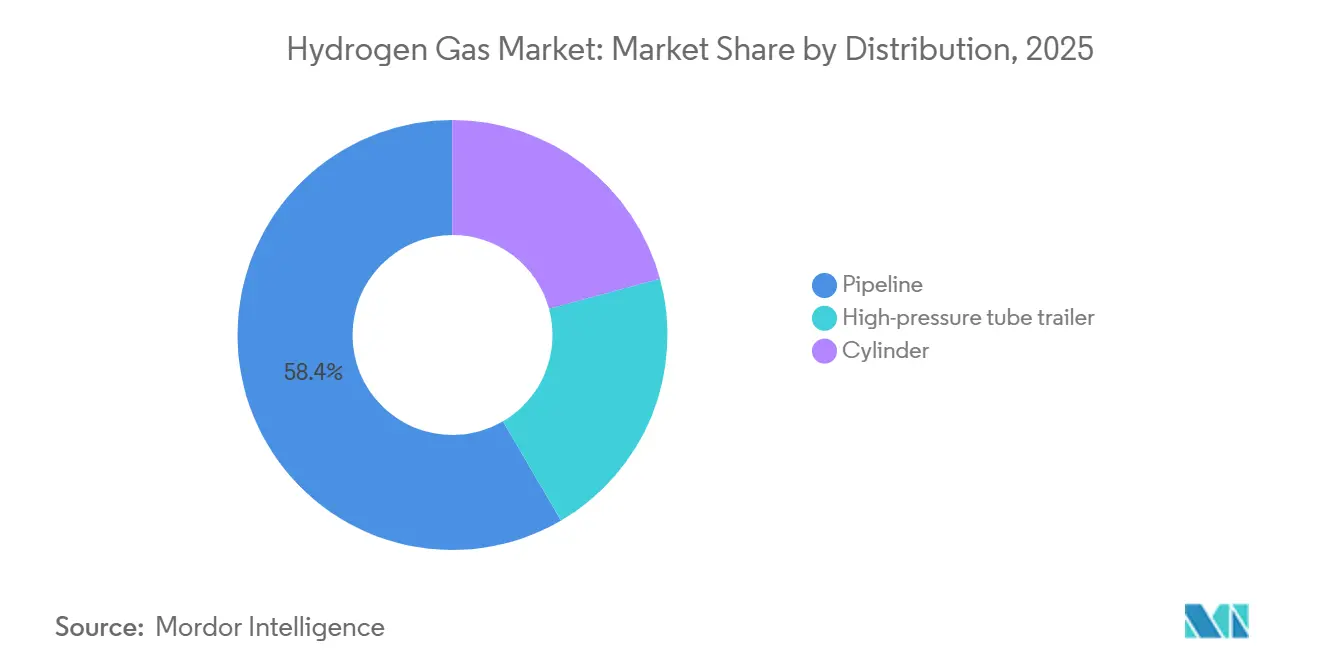
- By distribution, pipeline held 58.42% of the Hydrogen Gas market share in 2025 and is expected to expand at a 4.12% CAGR during the forecast period of 2026-2031.
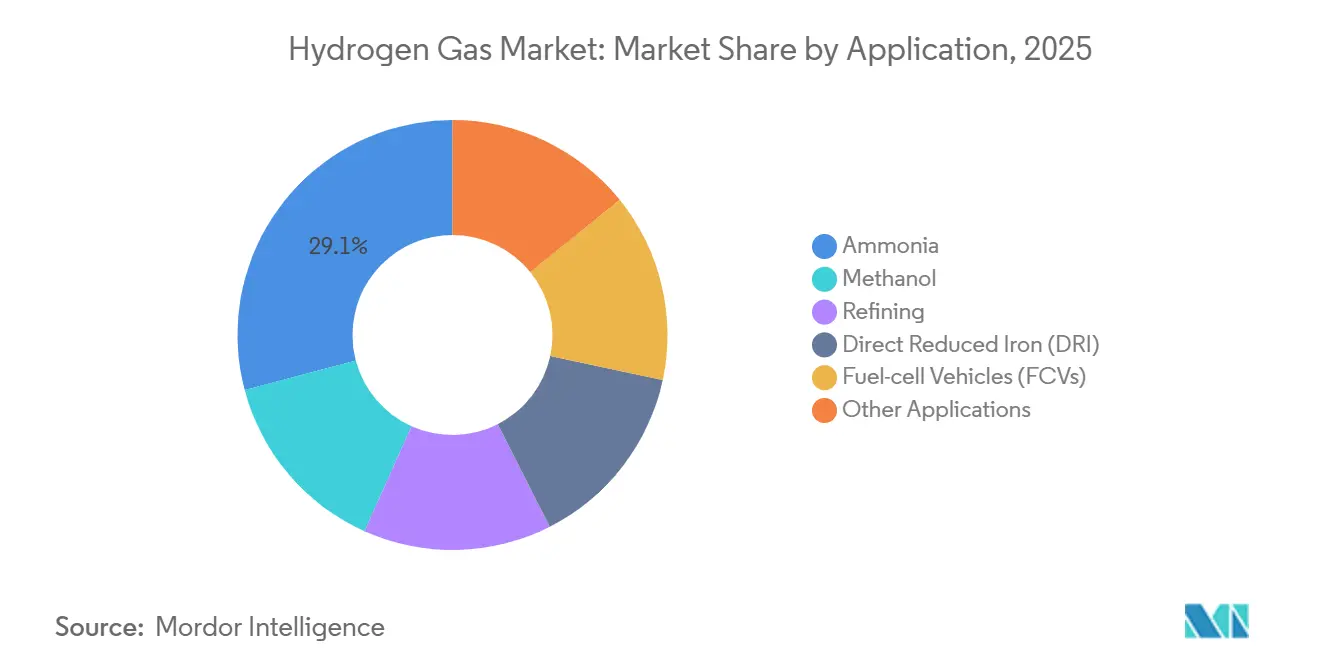
- By application, ammonia accounted for 29.11% of the Hydrogen Gas market size in 2025, whereas fuel-cell vehicles are advancing at the fastest 4.42% CAGR during the forecast period 2026-2031.
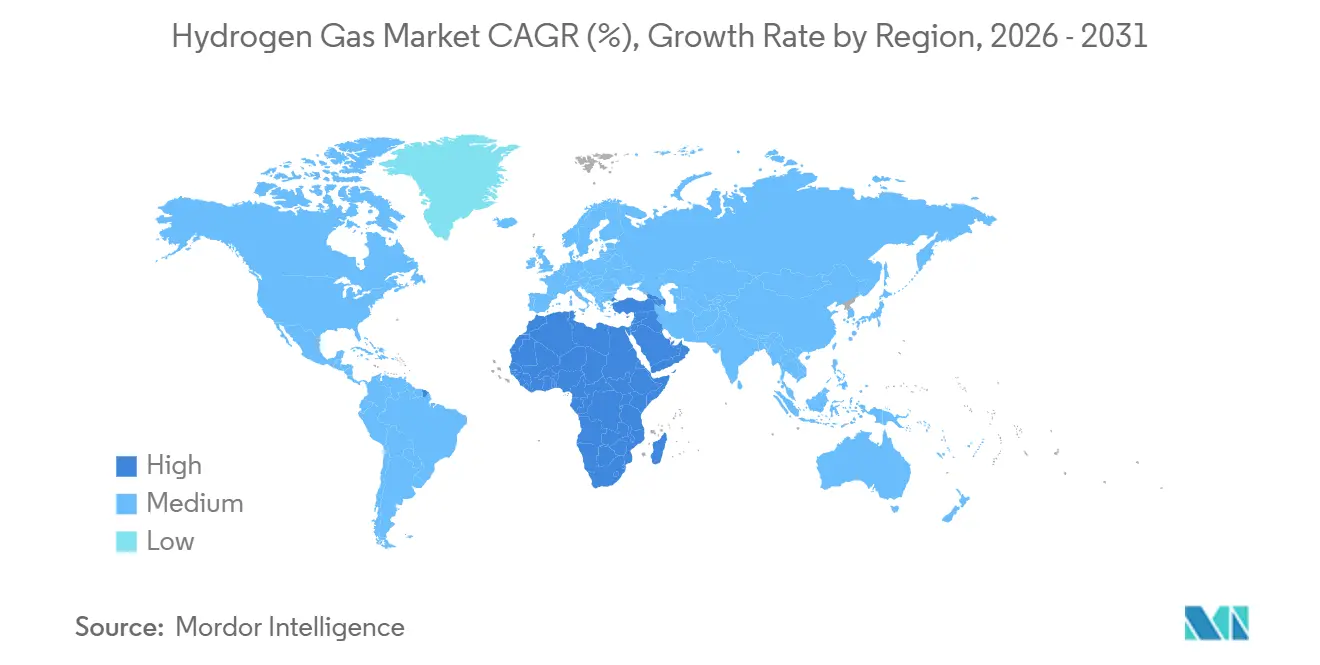
- By geography, the Asia-Pacific region commanded a 34.23% share of the Hydrogen Gas market size in 2025; the Middle East and Africa are recording the highest 4.12% CAGR during the forecast period 2026-2031.
Note: Market size and forecast figures in this report are generated using Mordor Intelligence’s proprietary estimation framework, updated with the latest available data and insights as of 2026.
Market Trends and Insights
Drivers Impact Analysis of Hydrogen Gas Market*
| Driver | (~) % Impact on CAGR Forecast | Geographic Relevance | Impact Timeline |
|---|---|---|---|
| Refinery Desulfurization Regulations | +0.80% | Global, concentrated in North America, Europe, Asia-Pacific coastal refineries | Medium term (2–4 years) |
| Government Incentives for Green H₂ | +1.20% | North America (IRA), Europe (Hydrogen Bank), East Asia (national subsidies) | Long term (≥4 years) |
| Rising Fuel-Cell Vehicle Roll-out | +0.60% | Asia-Pacific (China, Japan, South Korea), California, Germany | Long term (≥4 years) |
| Hydrogen-Gas-Grid Blending Mandates | +0.50% | Europe (Germany, UK, Netherlands), select U.S. states | Medium term (2–4 years) |
| Surplus-Renewables-Driven Power-to-Gas Economics | +0.50% | Global, with early gains in Germany, California, South Australia, Chile | Medium term (2–4 years) |
| Source: Mordor Intelligence | |||
Refinery Desulfurization Regulations
International Maritime Organization fuel rules and US Tier 3 gasoline standards increase hydrotreater hydrogen demand by 5–8% for each incremental sulfur cut[1]International Maritime Organization, “2020 Global Sulphur Cap,” imo.org. Gulf Coast, Rotterdam, and Singapore refineries therefore expand on-site steam-methane reformers tied into dedicated pipelines, locking in multi-year merchant contracts. Emerging-market refineries still purchasing tube-trailer gas pay USD 0.50-0.80 more per kg on a delivered basis. ISO 14001 reporting now requires disclosure of hydrogen carbon intensity, which is steering spot purchases toward lower-emission supply. Compliance deadlines through 2026 sustain baseline demand even as electrolyzer retrofits near parity in carbon-priced regions.
Government Incentives for Green H₂
Section 45V of the US Inflation Reduction Act offers up to USD 3 per kg for hydrogen below 0.45 kg CO₂-eq, stimulating co-located renewable-power electrolyzers[2]U.S. Department of the Treasury, “Section 45V Credit Guidance,” treasury.gov. Europe’s Hydrogen Bank awarded EUR 720 million of contracts-for-difference in 2024 to narrow the cost gap with grey hydrogen, but auctioned volumes remain a fraction of the 10 Mt annual import target for 2030. Japan, China, and South Korea extend purchase subsidies and feed-in tariffs that underpin multi-megawatt stack orders, driving Chinese alkaline electrolyzer prices under USD 200 per kW according to manufacturer disclosures. These layered incentives bring the hydrogen gas market closer to cost competitiveness in mobility, steel, and fertilizer.
Rising Fuel-Cell Vehicle Roll-out
Hyundai delivered more than 1,800 Xcient fuel-cell trucks to European carriers during 2024-2025, accumulating over 8 million km with 95% uptime on Alpine routes. Toyota expanded Mirai output to 12,000 units a year and co-funded 50 US stations dispensing 700-bar gas in under five minutes. China added 428 stations in 2025, bringing the national total to 1,104 and underpinning municipal procurement quotas for buses and sanitation fleets. Station capex, roughly USD 2–3 million for 40-vehicle-per-day capacity, remains the key bottleneck, but anchor fleets improve utilization economics. With Europe targeting 1,200 stations by 2030, the hydrogen gas market gains a credible mobility demand platform.
Hydrogen-Gas-Grid Blending Mandates
Germany authorized 20% hydrogen blends in select transmission loops from 2024, avoiding new pipeline capex but forcing burner retrofits in industrial boilers. The UK’s Redcar Hydrogen Village will convert 2,000 homes to 100% hydrogen by late 2025, testing appliance swap-outs and cast-iron main relining. Dutch community opposition halted a similar pilot, illustrating social-license risks even when technical codes such as ASME B31.12 are met. Distribution-node injection via tube trailers often suits dispersed demand clusters better than long-haul trunk lines. Successful pilots could unlock sizable distributed volumes inside the hydrogen gas market by the decade’s end.
Restraints Impact Analysis of Hydrogen Gas Market*
| Restraint | (~) % Impact on CAGR Forecast | Geographic Relevance | Impact Timeline |
|---|---|---|---|
| Expensive Storage and Transport Logistics | -0.90% | Global, acute in regions lacking pipeline infrastructure (South America, Sub-Saharan Africa) | Short term (≤2 years) |
| Community Opposition to New H₂ Pipelines | -0.40% | North America (Gulf Coast), Europe (Netherlands, Germany), localized in suburban corridors | Medium term (2–4 years) |
| Water-Scarcity Constraints in Arid Regions | -0.30% | Middle East and North Africa, with mitigation through desalination in Saudi Arabia, UAE, Oman | Medium term (2–4 years) |
| Source: Mordor Intelligence | |||
Expensive Storage and Transport Logistics
Compressed storage at 350 bar packs one-tenth the energy density of diesel, so tube-trailer fleets incur delivery premiums above USD 2 per kg on routes exceeding 300 km. Liquefaction consumes 25–35% of hydrogen’s lower heating value and needs cryogenic tanks costing about USD 1,000 per kg daily throughput. Liquid-organic carriers cut boil-off losses yet suffer 40% round-trip efficiency losses and costly dehydrogenation catalysts. New hydrogen-grade pipelines run USD 3–5 million per km before right-of-way, limiting deployments in South America and Sub-Saharan Africa, where greenfield projects must bundle production and distribution capex. These costs weigh on near-term economics for the hydrogen gas industry.
Community Opposition to New H₂ Pipelines
A 1,200-km Gulf Coast-to-Midwest hydrogen corridor faced landowner objections that forced a 180-km reroute and USD 340 million in mitigation spend. The Netherlands’ HyNetwork backbone encountered municipal demands for third-party risk audits, delaying final investment decisions by 18 months. Germany’s retrofit of natural-gas lines proceeds faster due to existing easements, yet environmental groups challenge permits on groundwater-leak grounds. Absent federal hydrogen-specific integrity rules, US developers navigate a patchwork of state codes, which pushes insurance premiums 15-25% above natural-gas analogues. Social-license delays temper the hydrogen gas market’s infrastructure rollout pace.
*Our forecasts treat driver/restraint impacts as directional, not additive. The impact forecasts reflect baseline growth, mix effects, and variable interactions.
Hydrogen Gas Market Segment Analysis
By Distribution:
Pipeline Dominance Anchored by Refinery ProximityPipeline networks supplied 58.42% of the hydrogen gas market size in 2025 and are projected to expand at a 4.12% CAGR during the forecast period (2026-2031) as refineries and ammonia plants demand uninterrupted flows. Tube trailers remain essential for 50–500 kg-per-day industrial users lacking spur lines, while cylinder packs shrink in laboratories and telecom backup systems that transition to cartridge formats. Emerging export pipelines reinforce future growth: Saudi Arabia’s 1,500-km NEOM line to Aqaba will feed green-ammonia export, and Europe plans to repurpose 11,600 km of gas transmission lines, trimming build costs 60% versus new construction. The Middle East and Africa lead pipeline additions, supporting gigawatt electrolyzers that target delivered costs of USD 1.50-2.00 per kg by 2030.
Tube-trailer economics improve where demand is fragmented; a 300-bar rig carrying 1,000 kg can serve six customers within 200 km, lowering deadhead mileage 20–30% using advanced route optimization. Cylinder packs still appeal to seasonal float-glass and specialty-welding shops, yet five-year hydrostatic tests under ISO 11114 inflate lifetime costs. In the hydrogen gas market, distribution portfolios therefore balance high-volume pipelines with flexible road logistics until regional demand clusters justify new steel.


By Application:
Ammonia’s Feedstock Lock-In Versus Mobility’s Growth PotentialAmmonia synthesis absorbed 29.11% of the 2025 volume, holding the top hydrogen gas market share because Haber-Bosch reactors require continuous 150-300 bar hydrogen feeds. Refiners followed closely as hydrocrackers strip sulfur to meet IMO 2020 and Euro 6 fuel rules, yet longer-term gasoline demand erosion caps incremental growth. Methanol plants pivot toward green methanol for marine fuel; orders for 24 methanol-ready container ships signal new downstream demand. Direct-reduced-iron pilots, such as HYBRIT’s 1.2 Mt output in 2025, illustrate steel decarbonization potential once electrolyzer costs drop.
Fuel-cell vehicles are expected to log the highest CAGR at 4.42% during the forecast period (2026-2031), though only 1.5 Mt of hydrogen in 2025, as station roll-outs unlock heavy-duty trucking niches where batteries struggle with duty-cycle and refuel time. Nikola shipped 247 hydrogen trucks in 2024-2025, and Daimler Truck’s GenH2 prototype executed a 1,000-km run on one 80 kg fill. Ancillary uses, glass annealing, silicon etching, and edible-oil processing expand with industrial GDP, offering steady demand. Green-ammonia export complexes in Saudi Arabia and Australia will each require 600,000-800,000 t-per-year hydrogen by 2028, volumes that surpass North American mobility demand today. Application diversification thus safeguards the hydrogen gas market against single-sector volatility.
Geography Analysis
APAC Hydrogen Gas Market
Asia-Pacific held 34.23% of the 2025 hydrogen gas market, propelled by China’s 1,104 refueling stations, Japan’s ammonia-import plans, and South Korea’s 6.2 Mt 2040 consumption target. China’s provincial grants for 10 MW-plus electrolyzers slashed alkaline stack costs below USD 200 per kW, half the European average, positioning Chinese suppliers for export. India’s National Hydrogen Mission commits INR 197 billion (USD 2.4 billion) to produce 5 Mt by 2030, focusing on Gujarat and Odisha corridors with sub-INR 2 kWh solar tariffs. ASEAN pilots in Thailand, Singapore, and Malaysia test grid blending and coal-plant ammonia co-firing while awaiting carbon-pricing clarity.
MEA Hydrogen Gas Market
The Middle East and Africa are expected to record the fastest 4.12% CAGR during the forecast period (2026-2031). Projects in Saudi Arabia, UAE, Oman, and Egypt couple 30-40% capacity-factor solar with desalination, reaching projected costs of USD 1.50-2.00 per kg by 2030. The NEOM venture will ship 650 t-per-day hydrogen as ammonia from late 2026, while South Africa’s Boegoebaai targets 400,000 t green-ammonia from 2028 despite desalination add-ons of USD 0.30-0.50 per kg.
The Americas and Europe Hydrogen Gas Market
In North America, the US Department of Energy funded seven regional hubs, each producing 50,000-100,000 t annually for refining, fertilizer, and transport. Canada pursues blue hydrogen with carbon capture in Alberta and green hydrogen via hydropower in Quebec, eyeing EU exports once carbon-border levies finalize. Europe repurposes legacy gas grids; Germany allows 20% blends in select segments, the UK plans a 100% hydrogen village, and France backs a 200 MW Dunkirk electrolyzer supplying ArcelorMittal’s DRI pilot. South American ambitions concentrate in Chile’s high-wind Magallanes and Brazil’s Pecém port, although grid-tie delays push several final decisions into 2026. Collectively, diversified regional pipelines, hub programs, and export projects underpin the hydrogen gas market’s global expansion.

Regulatory Landscape
Hydrogen regulation is tightening around market design, carbon intensity, and safety, which affects permitting, certification, and end-use adoption. In the European Union, Directive (EU) 2024/1788 and Regulation (EU) 2024/1789 (June 2024) set common rules for internal markets for renewable gas, natural gas, and hydrogen, with Member State transposition required by mid-2026. This timeline is a key milestone for network access, unbundling, and cross-border trading arrangements for hydrogen.
In the United Kingdom, the Department for Energy Security and Net Zero published Low Carbon Hydrogen Standard v4 in January 2026 to support program assessments and clarify classification. In the United States, NHTSA finalized Federal Motor Vehicle Safety Standards FMVSS No. 307 and 308 for hydrogen-fueled vehicles in January 2025 (effective July 16, 2025), with compliance required by September 1, 2028. On the funding side, US DOE FY 2026 budget materials allocate over USD 250 million for hydrogen and fuel cell R&D across relevant DOE offices, reinforcing support for production and end-use technology development alongside guidance initiatives such as the Clean Hydrogen Production Standard.
Value Chain Analysis
The hydrogen gas value chain spans feedstock and power supply (natural gas for SMR and electricity plus water for electrolysis), production (on-site captive plants and merchant supply), conditioning (compression, purification, liquefaction, or conversion to carriers such as ammonia), storage (compressed vessels, cryogenic tanks, or carrier logistics), distribution (pipelines as the high-volume backbone, complemented by tube trailers and cylinders), and end-use across refining, ammonia/methanol, steel (DRI pilots), and mobility. Current volumes remain anchored by refinery and chemical complexes connected to dedicated pipeline networks, while distributed electrolyzers are being deployed near industrial and mobility hubs where delivered road logistics carry a cost premium.
Recent moves also reflect tighter integration across production, equipment supply, and industrial gas distribution. Messer took a 30% equity stake in four Lhyfe renewable hydrogen production sites in France and Germany and secured a 10-year supply contract, linking long-term offtake with industrial gas distribution capability to de-risk projects. On the equipment and project delivery side, Industrie De Nora reported receiving the final tranche of orders for electrolytic cells for the 300 MW Moeve green hydrogen project in Andalusia, Spain, while NEOM Green Hydrogen Company began commissioning major elements of its Saudi Arabia project in mid-2026. Infrastructure continues to act as both a constraint and a differentiator, and early European backbone segments and port-linked nodes (for example, Rotterdam-linked developments) highlight the importance of siting production near demand centers and established logistics corridors.
Competitive Landscape
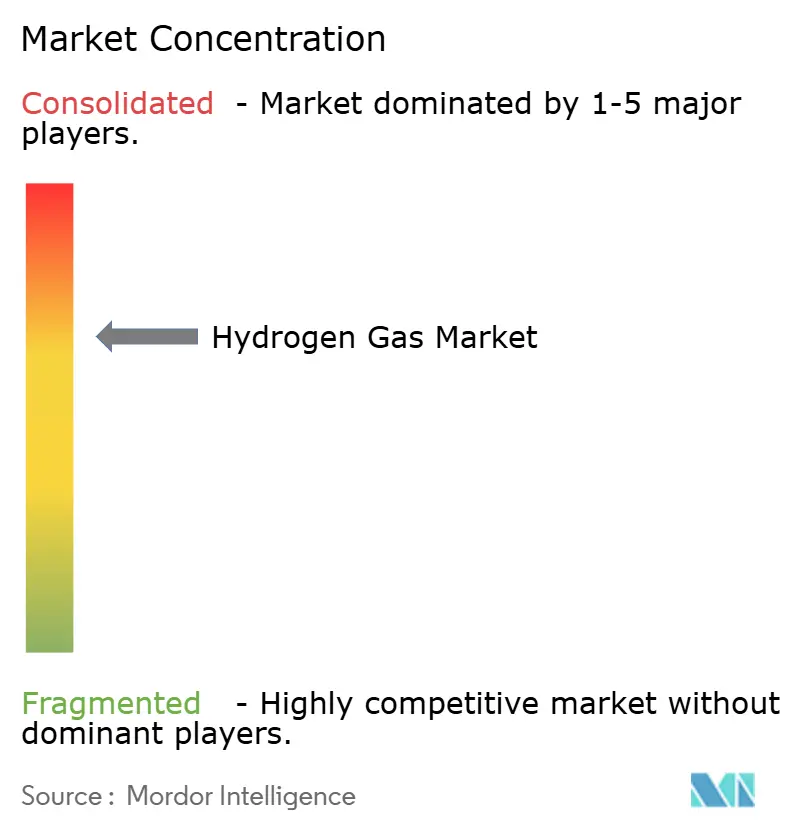
The Hydrogen Gas market is moderately consolidated. Chinese stack makers such as LONGi and Sungrow leverage scaled photovoltaic manufacturing to sell alkaline electrolyzers at USD 180-220 per kW, creating price pressure on Western PEM suppliers, though lower efficiency and durability constrain immediate utility-scale adoption. Competitive intensity in the hydrogen gas market stems from cost-down races in electrolyzers, lock-in effects of pipeline franchises, and premium-segment differentiation around lifecycle emissions tracking.
Hydrogen Gas Industry Leaders
Air Liquide
Linde plc
Air Products and Chemicals, Inc.
Messer SE & Co. KGaA
TAIYO NIPPON SANSO CORPORATION
- *Disclaimer: Major Players sorted in no particular order
Hydrogen Gas Market Companies Covered in this Report
- Aditya Birla Chemicals
- Air Liquide
- Air Products and Chemicals, Inc.
- BASF SE
- Equinor ASA
- Gulf Cryo
- Iwatani Corp.
- Kawasaki Heavy Industries, Ltd.
- Linde plc
- MATHESON Tri-Gas, Inc.
- Messer SE & Co. KGaA
- TAIYO NIPPON SANSO CORPORATION

Market Opportunities and Future Outlook
Near-term opportunity is concentrated where hydrogen can be absorbed by captive, high-load industrial users and where permitting, certification, and infrastructure enable bankable offtake structures. Industrial hub configurations that connect electrolyzers to ammonia and chemicals offer a clearer commercialization route, as reflected by the Hunter Valley Hydrogen Hub in Australia reaching FID in July 2026 to supply renewable hydrogen for Orica operations using PEM electrolyzers. In Europe, supply-demand matching is being formalized through long-tenor contracting and industrial gas participation, including Messer securing a 10-year renewable hydrogen supply agreement with Lhyfe alongside a 30% equity entry into four production sites in France and Germany.
A second opportunity area is technology and manufacturing pathways that improve conversion efficiency and support cost-down through serial production. Fraunhofer ISE reported a 31.3% solar-to-hydrogen conversion efficiency result for a direct photovoltaic-electrolysis module in an outdoor demonstration (July 2026), while Fraunhofer IKTS presented high-temperature electrolysis stack development designed for industrial-scale serial production and integration of waste heat (June 2026). These efforts align with demand centers such as steel and chemicals that can use heat streams, rather than treating hydrogen production as a standalone process. Cross-border trade and investment are also shaped by efforts to harmonize certification and technical standards for green hydrogen and derivatives under international frameworks (for example, trade-related technical barrier disciplines), which supports a market whitespace for credible guarantees of origin and interoperable specifications across import corridors.
Recent Industry Developments in Hydrogen Gas Market
- June 2026: Air Products provided a project update on the NEOM Green Hydrogen Project through its corporate news center, signaling continued progress on one of the largest export-oriented green hydrogen value chains linked to ammonia shipping. The update supports market confidence in multi-gigawatt scale execution and reinforces the role of integrated producer-exporter models in shaping global supply.
- July 2025: Air Liquide took a final investment decision to build the ELYgator 200 MW electrolyzer project in the Port of Rotterdam, the Netherlands, expanding large-scale electrolytic hydrogen production tied to an established industrial and logistics hub. The project strengthens Rotterdam-linked supply options for refining, chemicals, and mobility corridors that depend on reliable, high-volume hydrogen availability.
- August 2024: Linde signed a long-term agreement to supply clean hydrogen to Dow’s Path2Zero project in Alberta, Canada, aligning hydrogen supply with a major industrial decarbonization program and associated infrastructure build-out. Long-duration offtake structures such as this support investment in production and distribution assets and influence contracting norms for low-carbon hydrogen in heavy industry.


Hydrogen Gas Market Report Scope and Research Methodology
Market Definition and Coverage
This market covers hydrogen gas supplied for use across industrial and emerging energy applications, tracked through volumes delivered via common logistics routes and then consumed in identifiable end uses.
Scope exclusions: On-site hydrogen that is produced and consumed within the same facility without entering a distribution channel is excluded.
Segments Covered in This Report
- By Distribution
- Pipeline
- High-pressure tube trailer
- Cylinder
- By Application
- Ammonia
- Methanol
- Refining
- Direct Reduced Iron (DRI)
- Fuel-cell Vehicles (FCVs)
- Other Applications
- By Geography
- Asia-Pacific
- China
- India
- Japan
- South Korea
- ASEAN Countries
- Rest of Asia-Pacific
- North America
- United States
- Canada
- Mexico
- Europe
- Germany
- United Kingdom
- France
- Italy
- Russia
- NORDIC Countries
- Rest of Europe
- South America
- Brazil
- Argentina
- Rest of South America
- Middle East and Africa
- Saudi Arabia
- South Africa
- Rest of Middle East and Africa
- Asia-Pacific
Data Sources, Market Sizing, and Validation
Desk Research
Desk work started by mapping where hydrogen is produced, how it is distributed, and where it is consumed, so the sizing stays tied to measurable industrial activity. We referenced public sources such as the International Energy Agency for hydrogen demand context, the US Energy Information Administration for refinery and energy indicators, and the USGS for industrial production references that support linked value chains.
To keep the country level logic consistent, we also reviewed sources such as UN Comtrade and national customs portals for trade signals, plus public environmental and energy agencies that publish policy and emissions updates impacting refinery and ammonia economics. Company annual reports, investor presentations, and plant announcements helped us time capacity additions and maintenance cycles, and paid subscriptions for company financials and patent databases were used selectively to cross-check scale and technology direction. These desk sources are illustrative only, and many other public documents and datasets were used for data collection, validation, and clarification.
Primary Interviews and Surveys
Primary work focused on validating how hydrogen volumes move through pipelines, tube trailers, and cylinders, and how demand is shaped in refining, ammonia, methanol, steel, and mobility. We spoke with a mix of producers, distributors, and large end users across APAC, EMEA, and the Americas, which helped fill gaps around utilization, delivery mode splits, and practical constraints that are not clearly visible in public sources.
Distribution of primary research fieldwork respondents
| Company type | Respondent position | Region |
|---|---|---|
| Top tier: 38% | CXOs: 17% | APAC: 49% |
| Mid tier: 43% | Functional/Unit leaders: 28% | EMEA: 31% |
| Smaller Players: 19% | Managers: 55% | Americas: 20% |
Market-Sizing & Forecasting
The main sizing is built using a top-down demand pool build, where country level activity in key consuming industries is reconstructed and then translated into hydrogen gas volumes using practical intensity factors. Results were then checked through selective bottom-up approximations, such as sampled supplier capacity and utilization checks, and quick volume sense checks using distribution mode shares and typical customer delivery patterns.
Inputs treated as key fingerprints include refinery throughput linked to hydrotreating needs, ammonia and methanol output volumes, steelmaking activity tied to direct reduced iron routes, the mix of merchant versus captive supply, and the split of hydrogen moved via pipeline versus packaged distribution. For forecasting, scenario analysis was used so policy timing and project execution risk can be reflected, and then the central case was aligned to expert views on capacity additions, end use growth, and cost pressure trends. Where smaller markets lacked clear public production signals, proxy ratios based on industrial output and trade exposure were applied, and those proxies were rechecked during interviews before finalizing totals.
Data Validation & Update Cycle
Validation is done through repeated cross-checks that connect the model back to independent signals, and then results are reviewed in steps before sign-off. Unusual movements are investigated by looking for plant outages, sudden shifts in industrial output, and abnormal trade movements, and then selected experts are re-contacted when a variance stays unexplained.
Reports are refreshed annually, with interim updates triggered by material events such as large capacity announcements, policy changes that alter economics, or unexpected shutdowns. Before delivery, a final analyst pass is performed so the latest public releases and interview feedback are reflected in a consistent set of totals.
Mordor Intelligence's Hydrogen Gas Market Estimate Compared With Other Published Estimates
Published market sizes for hydrogen gas often diverge because the same market is measured in different units, and because each publisher draws the scope line differently. It is common to see revenue based totals compared directly against volume based totals, even though the underlying math and data anchors are not the same.
Refinery throughput, ammonia output, and the observed split of hydrogen moved by pipeline versus packaged delivery are the checks that keep Mordor Intelligence tied to a volume-defined supply and demand flow, rather than a value pool that depends heavily on assumed pricing and currency timing.
Benchmark comparison
| Source | Market Size | Gaps in Research Methodology |
|---|---|---|
| Mordor Intelligence | USD 113.91 M (2025) | |
| Trade Publisher A | USD 195.35 B (2024) | Uses a revenue lens and also presents volume, so the headline value is driven by assumed selling prices, currency conversion timing, and how merchant versus captive volumes are treated in reported sales. |
| Global Consultancy B | USD 196.48 B (2025) | Positions the market as a broader value pool across multiple applications and production pathways, which can inflate the total when wider hydrogen economy items and faster price escalation assumptions are included. |
The spread across sources mainly comes from mixing value-based definitions with a volume-based market, since the revenue totals move with price curves and what is counted as sold supply. By keeping the model anchored to observable end use activity and then rechecking implied totals through distribution mode and utilization inputs, the final number remains traceable and repeatable when data coverage varies by country.


Key Questions Answered in the Report
How large will global demand for hydrogen reach by 2031?
The hydrogen gas market size is projected to hit 141.25 million tons by 2031, expanding at a 3.65% CAGR from 2026.
Which application uses the most hydrogen today?
Ammonia synthesis leads, absorbing 29.11% of 2025 volume thanks to continuous-flow Haber-Bosch plants.
What region will grow fastest over the next five years?
The Middle East and Africa post the highest 4.12% CAGR through 2031 as export-oriented green-hydrogen megaprojects come online.
Why do pipelines dominate hydrogen distribution?
Refinery and fertilizer complexes cluster near SMR production and value uninterrupted pipeline supply, giving pipelines a 58.42% 2025 share.
What is the main cost restraint on hydrogen adoption?
Storage and transport add up to USD 2 per kg for road delivery and consume 25–35% of energy in liquefaction, slowing near-term economics.
Page last updated on:


 Your data is secure and never sold or shared.


