
Hydrazine Market Size and Share
Market Overview
| Study Period | 2020 - 2031 |
|---|---|
| Market Volume (2026) | 388.76 kilotons |
| Market Volume (2031) | 513.16 kilotons |
| Growth Rate (2026 - 2031) | 5.71 % |
| Fastest Growing Market | Asia Pacific |
| Largest Market | Asia Pacific |
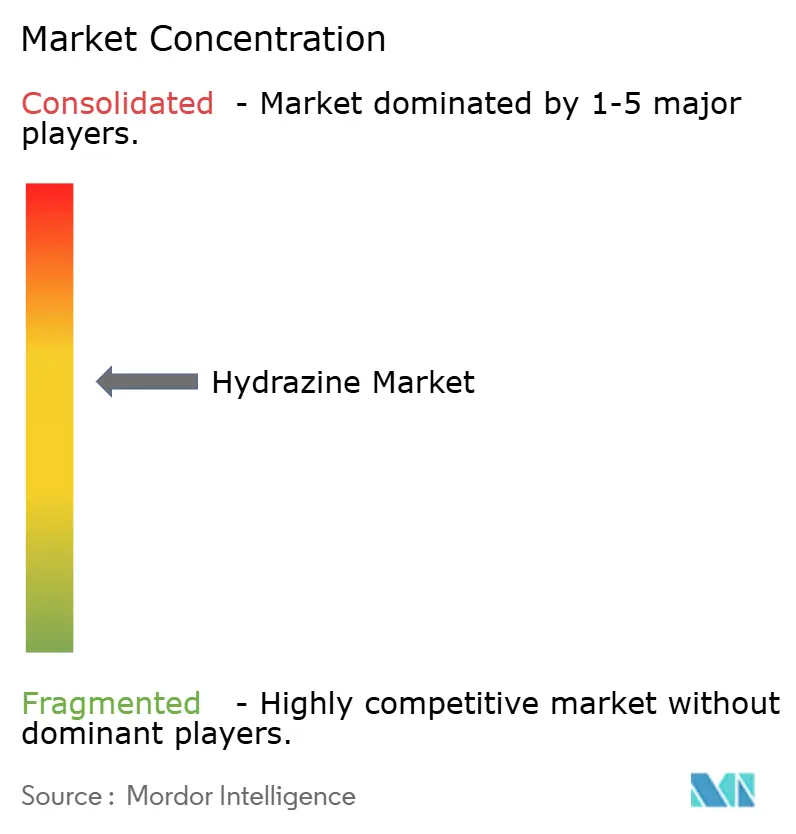
| Market Concentration | Medium |
Major Players *Disclaimer: Major Players sorted in no particular order Image © Mordor Intelligence. Reuse requires attribution under CC BY 4.0. | |
Hydrazine Market Analysis by Mordor Intelligence
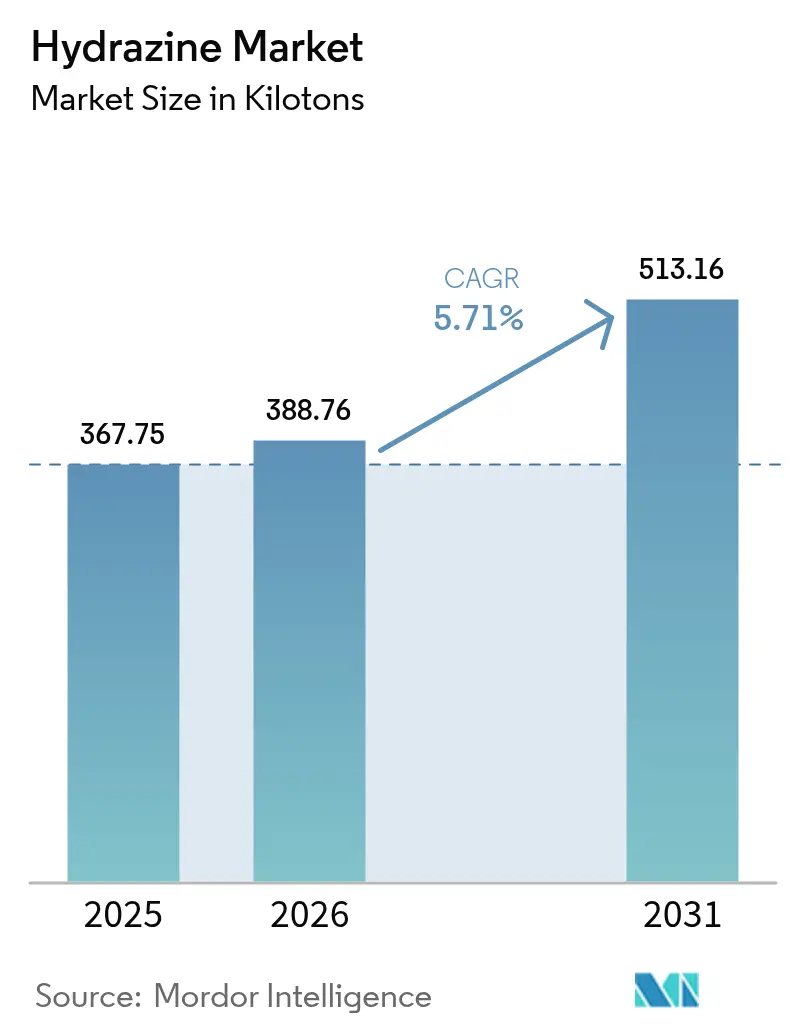
The Hydrazine Market size was valued at 367.75 kilotons in 2025 and estimated to grow from 388.76 kilotons in 2026 to reach 513.16 kilotons by 2031, at a CAGR of 5.71% during the forecast period (2026-2031). Demand resilience stems from hydrazine’s irreplaceable role in agrochemicals, corrosion control, polymer foams, and emerging energy systems. Regulatory scrutiny in Europe and North America continues to tighten, yet capacity additions in Asia–Pacific offset potential volume losses elsewhere. Supply-side investments concentrate on safer production routes for hydrazine hydrate, while downstream users in pharmaceuticals and fuel-cell technology create fresh growth avenues. Competitive positioning focuses on vertical integration and long-term contracts to secure feedstock and manage compliance costs.
Key Report Takeaways
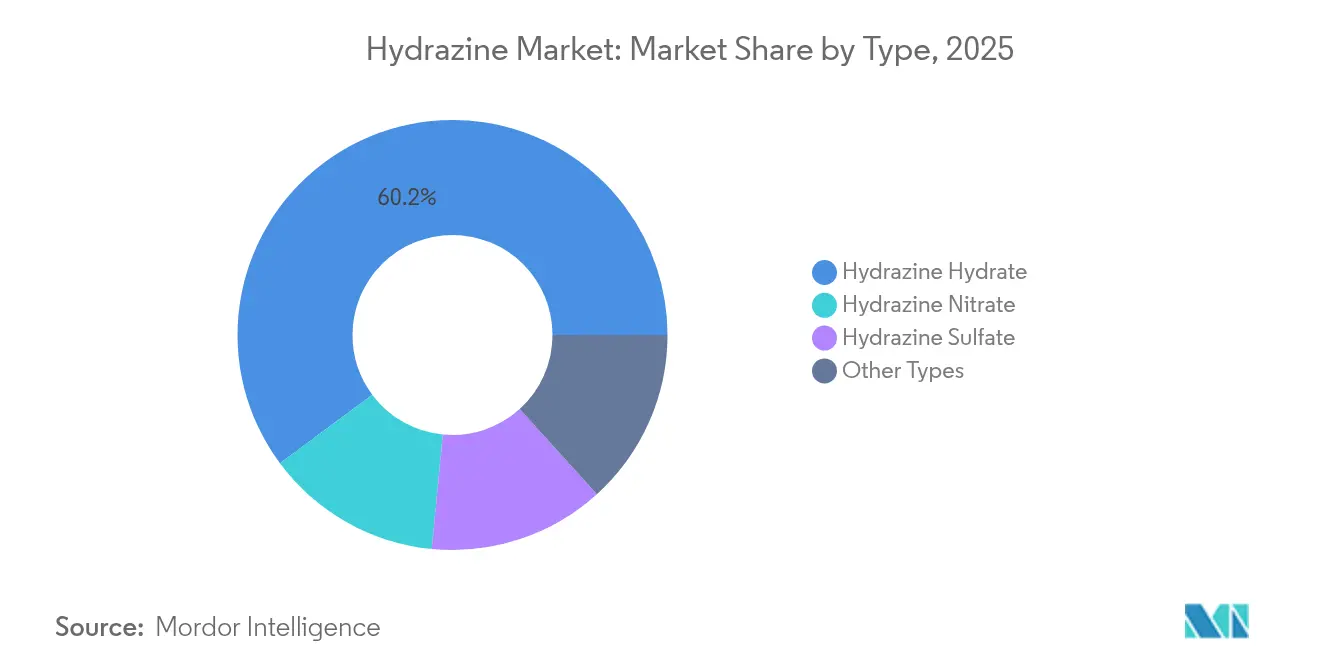
- By type, hydrazine hydrate held 60.17% of the hydrazine market share in 2025 and is expanding at a 5.89% CAGR through 2031.
- By application, corrosion inhibitors accounted for a 36.25% slice of the hydrazine market size in 2025 and are growing at 5.96% CAGR to 2031.
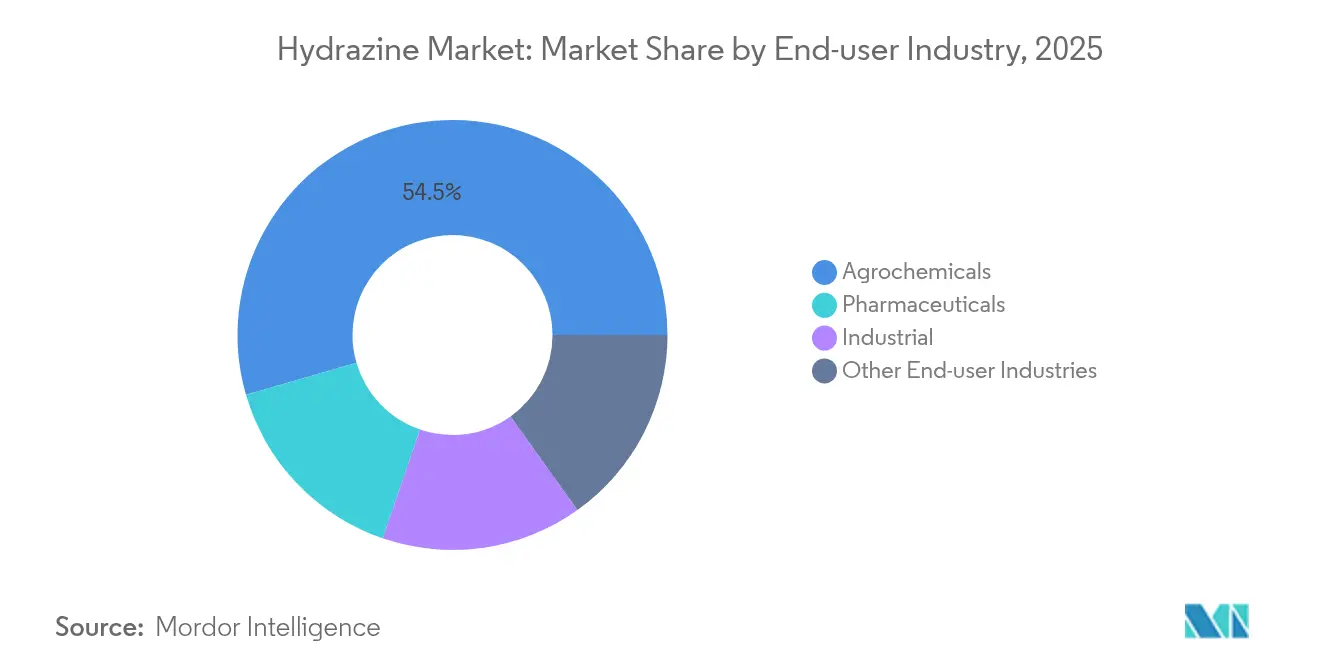
- By end-user industry, agrochemicals led with 54.49% of the hydrazine market share in 2025, whereas pharmaceuticals are advancing at a 5.98% CAGR over the same horizon.
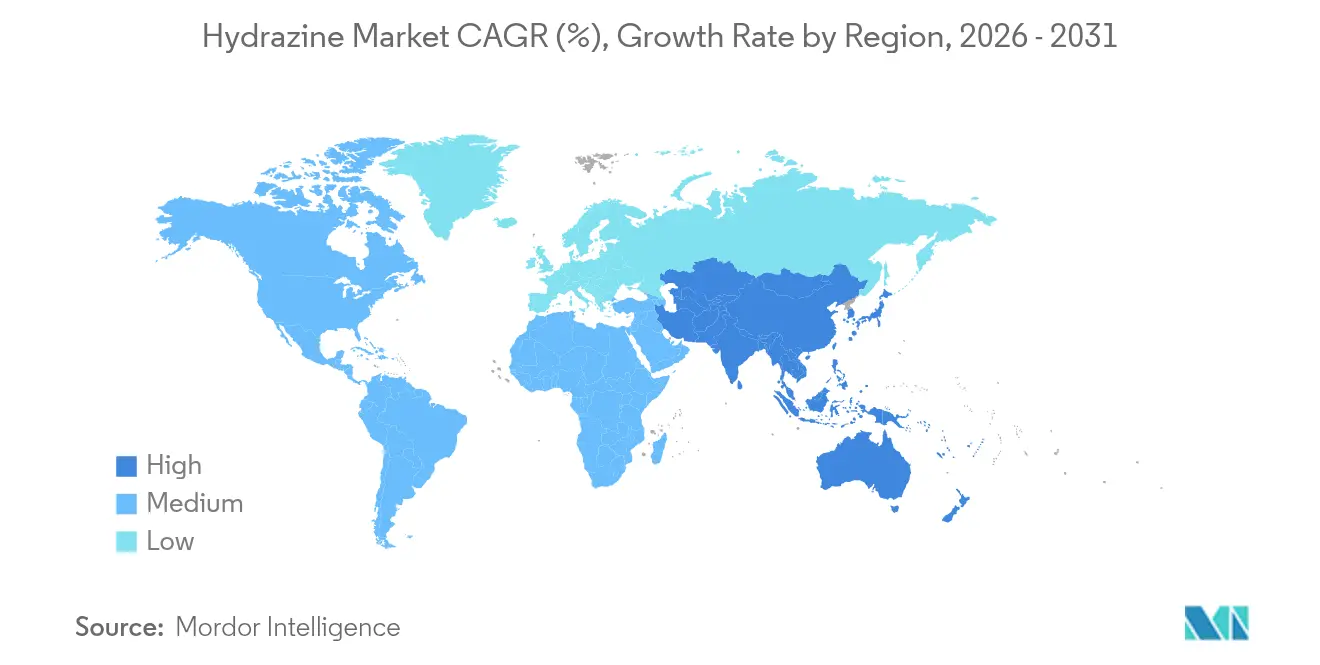
- By geography, Asia–Pacific commanded 55.51% of the 2025 volume and is forecast to register the fastest 6.05% CAGR to 2031.
Note: Market size and forecast figures in this report are generated using Mordor Intelligence’s proprietary estimation framework, updated with the latest available data and insights as of 2026.
Market Trends and Insights
Drivers Impact Analysis of Hydrazine Market*
| Drivers | (~) % Impact on CAGR Forecast | Geographic Relevance | Impact Timeline |
|---|---|---|---|
| Rising demand from agrochemicals | +1.8% | Global, with concentration in Asia-Pacific and Latin America | Medium term (2-4 years) |
| Growing use as pharmaceutical intermediate | +1.2% | North America and EU, expanding to Asia-Pacific | Long term (≥ 4 years) |
| Increasing adoption as blowing agent in polymer foams | +0.9% | Global, led by Asia-Pacific manufacturing hubs | Short term (≤ 2 years) |
| Expansion of water-treatment infrastructure | +0.7% | Asia-Pacific core, spill-over to MEA and Latin America | Medium term (2-4 years) |
| Hydrazine-based hydrogen carrier for fuel-cell systems | +0.6% | North America and EU, with pilot projects in Japan | Long term (≥ 4 years) |
| Source: Mordor Intelligence | |||
Rising Demand from Agrochemicals
Escalating agricultural intensification in China, India, and Brazil keeps pesticide consumption high, and hydrazine remains the indispensable intermediate for maleic hydrazide, isoxazolidinone, and other growth-regulator actives. Large Chinese producers report dedicated capacities above 200,000 tons that feed both domestic and export pipelines, supporting supply security for formulating companies. Research into nano-engineered hydrazine derivatives achieves full pest mortality at lower dosage, signaling potential for reduced environmental loading while preserving efficacy. Regulatory focus on food security in these regions outweighs immediate environmental bans, thus sustaining the hydrazine market.
Growing Use as Pharmaceutical Intermediate
Hydrazine scaffolds enable the selective synthesis of anti-tubercular, anti-inflammatory, and antidepressant molecules, and recent process innovations deliver 89–97% yields under mild, solvent-efficient conditions. Clinical candidates such as pyrrole hydrazones inhibit Mycobacterium tuberculosis at therapeutic concentrations, widening demand among active pharmaceutical ingredient (API) manufacturers in the United States and India. To tackle toxicity concerns, producers are scaling indirect routes that avoid bulk hydrazine handling, yet still leverage its unique nucleophilic profile. As a result, the pharmaceutical segment is expected to remain the fastest-growing user base within the hydrazine market.
Increasing Adoption as Blowing Agent in Polymer Foams
Automotive light-weighting and building-insulation programs propel demand for azodicarbonamide and para-toluenesulfonyl hydrazide, both synthesized from hydrazine. Asia–Pacific houses the majority of PVC and EVA foam converters, translating into steady offtake for regional hydrazine suppliers. Process refinements that embed nano-dispersion technology cut required gassing agent levels without compromising cell structure, giving converters cost and sustainability advantages. Lack of functionally equivalent substitutes maintains pricing power for hydrazine-based systems.
Expansion of Water-Treatment Infrastructure
New combined-cycle gas-turbine installations in India, Indonesia, and Vietnam rely on high-pressure boilers that mandate oxygen scavengers, where hydrazine’s reactivity secures metal integrity at elevated temperatures. Desalination plants across the Middle East are also specifying hydrazine dosage for corrosion control, generating incremental demand from municipal operators. Modular dosing systems and in-line monitoring improve worker safety, supporting continued adoption despite regulatory pressure.
Restraints Impact Analysis of Hydrazine Market*
| Restraints | (~) % Impact on CAGR Forecast | Geographic Relevance | Impact Timeline |
|---|---|---|---|
| Highly toxic nature and tightening regulations | -1.4% | EU and North America, expanding globally | Short term (≤ 2 years) |
| Volatility in ammonia prices | -0.8% | Global, with acute impact in Asia-Pacific production hubs | Short term (≤ 2 years) |
| Shift toward green monopropellants in space | -0.5% | Global aerospace sector, led by EU and US | Medium term (2-4 years) |
| Source: Mordor Intelligence | |||
Highly Toxic Nature and Tightening Regulations
Hydrazine features on the European Chemicals Agency’s Substances of Very High Concern list, triggering strict authorization and occupational exposure limits. Compliance now demands sealed transfer lines, scrubber systems, and continuous air monitoring, pushing operating costs higher for formulators across Germany, France, and the United States[1]. Liability linked to liver toxicity and carcinogenicity also forces insurers to raise premiums, discouraging new entrants. Although Asia–Pacific regulations are comparatively lenient today, multinational customers increasingly require global compliance, slowly extending higher safety standards worldwide.
Shift Toward Green Monopropellants in Space
Satellite integrators are migrating from hydrazine to hydroxyl-ammonium-nitrate or ammonium-dinitrimide blends that offer similar impulse with lower handling risks. The European Space Agency’s LMP-103S and NASA’s AF-M315E propulsion programs both cleared critical milestones in 2024, signaling accelerated fleet conversion[2]. Private launch providers respond by phasing hydrazine ground infrastructure out of new sites, which will steadily erode demand from the aerospace vertical. However, legacy spacecraft refueling and military platforms will maintain limited hydrazine usage in the medium term.
*Our forecasts treat driver/restraint impacts as directional, not additive. The impact forecasts reflect baseline growth, mix effects, and variable interactions.
Hydrazine Market Segment Analysis
By Type:
Hydrazine Hydrate Dominance Reflects Handling AdvantagesHydrazine hydrate accounted for 60.17% of 2025 volume within the hydrazine market and recorded the segment-leading 5.89% CAGR outlook. Preference for aqueous grades stems from lower vapor pressure, simplified ISO-tank logistics, and smoother regulatory certification versus anhydrous material. Boiler-water treatment, polymer foaming, and API synthesis plants install dedicated hydrate storage to reduce on-site risk profiles, reinforcing demand stability. Specialty salts such as hydrazine sulfate serve electronics and analytical niches where tighter stoichiometric control is essential.
Regulators now explicitly recommend hydrate grades when feasible, catalyzing supplier investments in high-purity, low-metal formulations engineered for pharmaceutical compliance. Fuel-cell developers also gravitate toward monohydrate for liquid-carrier prototypes that balance power density with managed volatility, sustaining incremental offtake. Collectively, these trends entrench hydrazine hydrate’s leadership and shield the segment from the full force of impending restrictions on anhydrous forms, supporting the broader hydrazine market.

By Application:
Corrosion Inhibition Leads Despite Pharmaceutical MomentumCorrosion inhibitors represented 36.25% of 2025 demand and should post a 5.96% CAGR through 2031, driven by new ultrahigh-pressure boilers in Asia and the refurbishment of aging North American utilities. Hydrazine’s rapid oxygen-reduction kinetics under high temperature remain unmatched, especially in closed-loop systems where stainless steel passivation is critical. Power-sector maintenance contracts typically secure multi-year hydrazine supply, offering producers predictable baseline volumes.
Explosive and blowing-agent applications together supply resilience by tapping construction, mining, packaging, and automotive end-markets. Although rocket-fuel consumption is projected to contract under the green-propellant pivot, pharmaceutical synthesis will offset losses as pipeline molecules scale up. Emerging research on hydrazine-assisted hydrogen generation could unlock new downstream uses later in the decade, adding optionality for suppliers and safeguarding the hydrazine market size from abrupt demand shocks.
By End-User Industry:
Agrochemicals Anchor Growth While Pharmaceuticals AccelerateAgrochemicals retained a 54.49% hydrazine market share in 2025, reflecting continued reliance on hydrazine-derived maleic hydrazide, herbicide synergists, and sprout-inhibition agents. Regional pesticide regulations in China and India still permit hydrazine intermediates, allowing local formulators to offer cost-effective crop-protection products amid rising food-security priorities.
Pharmaceuticals, while smaller, deliver the top 5.98% CAGR to 2031, powered by tuberculosis, oncology, and neuropsychiatric drug development pipelines. Contract development and manufacturing organizations in India and Singapore are scaling hydrazine-dependent APIs using continuous-flow techniques that mitigate exposure risks and improve atom economy. Industrial end-users, encompassing water treatment and metal surface preparation, provide dependable offtake tied to infrastructure expansion. Together, these segments ensure diversified demand and underpin medium-term growth across the hydrazine industry.
Geography Analysis
APAC Hydrazine Market
Asia–Pacific dominated the hydrazine market with a 55.51% hydrazine market share in 2025 and is forecast to post the fastest 6.05% CAGR through 2031. China’s integrated value chain, from ammonia feedstock to downstream pesticides, confers cost leadership, while India’s pharmaceutical build-out boosts high-purity hydrate imports. Government incentives for local specialty-chemical production stimulate further capacity additions despite safety headwinds.
North America Hydrazine Market
North America remains a mature yet evolving arena. Regulatory compliance elevates operating costs, but defense applications and corrosion-control contracts sustain baseline hydrazine consumption. The 2024 private-equity acquisition of Calca Solutions underscores investor belief in steady free cash flow and future volume support from next-generation solid rocket motor programs.
Europe Hydrazine Market
Europe confronts the stiffest hurdles as REACH authorization pressures escalate. Several mid-tier formulators have trimmed capacity or shifted sourcing to affiliates in Turkey and Eastern Europe to circumvent licensing delays. Collectively, divergent regulatory regimes create a two-speed hydrazine market in which Asia–Pacific accelerates while Europe consolidates and North America balances between risk management and strategic necessity.
Regulatory Landscape
Hydrazine faces stringent hazard-based regulation in key consuming regions because of its toxicity and carcinogenic classification. In the European Union, hydrazine (CAS 302-01-2) is listed by the European Chemicals Agency (ECHA) as a Substance of Very High Concern (SVHC) on the Candidate List (Carcinogen Category 1B), which raises compliance requirements for producers and users under REACH (EC) No 1907/2006, including tighter workplace controls and documentation for industrial handling.
In North America, regulatory emphasis centers on occupational safety and environmental risk management. The United States applies federal workplace requirements through OSHA chemical exposure guidance alongside EPA risk assessment resources (including IRIS). Canada also publishes Federal Environmental Quality Guidelines (FEQG) for hydrazine to protect aquatic life and guide discharge management. Together, these frameworks drive investments in sealed transfer, monitoring, and wastewater controls for boiler-water treatment and other industrial applications where air or water releases represent a material compliance risk.
Value Chain Analysis
The hydrazine value chain starts with upstream feedstocks such as ammonia and oxidants (for example sodium hypochlorite or hydrogen peroxide) and intermediates or solvents used in commercial routes. Production commonly uses variants of the Raschig, urea, ketazine, or hydrogen peroxide-ketazine processes, followed by concentration and purification into hydrazine hydrate (the dominant traded form), with smaller volumes of anhydrous hydrazine and derivative salts. Given hydrazine's high hazard profile, logistics and packaging are tightly controlled, with a bias toward bulk hydrate shipped in approved containers and dedicated storage and handling at customer sites.
Downstream consumption is spread across agrochemical intermediates, pharmaceutical synthesis, polymer foaming and blowing agents, water treatment and boiler oxygen scavenging, and niche propulsion uses. Bottlenecks concentrate around EHS-compliant operations, particularly wastewater and brine management from production, as well as the capital intensity of closed-loop handling systems. These constraints tend to favor larger, integrated producers and long-term contracting with industrial buyers. Supply concentration in Asia, especially China, also affects availability and pricing for import markets such as India, the United States, and parts of Europe, where compliance costs and licensing complexity can shift sourcing toward affiliates or alternative trade routes.
Competitive Landscape
Global hydrazine supply is moderately fragmented. Strategic capital expenditure targets debottlenecking and digital process control rather than greenfield megaplants, reflecting a capital-disciplined stance in light of uncertain Western demand. Asian leaders invest in zero-discharge wastewater treatment and automated drum filling to appease rising ESG expectations from multinational buyers. The Calca Solutions deal illustrates financial appetite for assets serving regulated defense and water-treatment markets. At the same time, technology partnerships with catalyst developers explore hydrazine’s function as a hydrogen carrier, opening optionality beyond traditional domains.
Hydrazine Industry Leaders
-
Arkema
-
Lanxess
-
Nippon Carbide Industries Co., Inc.
-
Otsuka Chemical Co.,Ltd.
-
Yibin Tianyuan Group
- *Disclaimer: Major Players sorted in no particular order
Hydrazine Market Companies Covered in this Report
- Acuro Organics Limited
- Arkema
- BroadPharm
- Calca Solutions (AE Industrial Partners)
- Gujarat Alkalies and Chemicals Limited
- HPL Additives Limited
- Lanxess
- Loba Chemie Pvt. Ltd.
- MERU CHEM PVT.LTD.
- Nippon Carbide Industries Co., Inc.
- Otsuka Chemical Co.,Ltd.
- Yibin Tianyuan Group
Market Opportunities and Future Outlook
Capacity localization in Asia-Pacific is becoming a practical focus as regional end-users scale consumption across agrochemicals, pharmaceuticals, polymer foams, and industrial water treatment. In January 2026, Spl Additives Private Limited disclosed a proposed expansion of hydrazine hydrate capacity at RIICO Industrial Area, Hanumangarh, Rajasthan, from 195 metric tons per month to 1,000 metric tons per month (project value Rs 161 crore). The disclosure points to active investment aimed at supporting domestic demand and reducing reliance on imports for hydrate grades.
Compliance-driven process and infrastructure upgrades also create a clear opportunity, particularly for suppliers that can provide high-purity hydrate with lower emissions and safer handling. In the European Union, chemical-sector wastewater and waste-gas management requirements under the Industrial Emissions Directive (2010/75/EU) and related Best Available Techniques (BAT) conclusions encourage both producers and large users to strengthen abatement, monitoring, and waste-treatment systems. In North America, environmental controls such as U.S. EPA hazardous waste treatment standards for hydrazine (U133) under RCRA, alongside Canada-focused pollution prevention and aquatic-protection guidance, increase the value of turnkey storage, dosing, and containment solutions for power and industrial water-treatment customers.
Recent Industry Developments in Hydrazine Market
- March 2026: Arkema reported a capacity expansion plan at its Changshu Kynar PVDF manufacturing site in China, with startup targeted for 2028. While not a hydrazine asset, the move indicates continued capital deployment in Asia for high-spec materials used in energy-related applications, reinforcing the region's broader pull on upstream specialty chemical supply chains and investment priorities.
- September 2025: NewMarket Corporation announced a definitive agreement to acquire Mars TopCo, the parent of Calca Solutions, a US producer of high-purity hydrazine used in aerospace applications. The transaction consolidates supply control around a regulated, high-barrier application base and strengthens Calca's position for long-term contracting with defense and space customers.
- March 2024: AE Industrial Partners acquired Calca Solutions and announced an expansion of hydrazine capacity at Lake Charles, Louisiana, to support defense and aerospace demand. The investment highlighted renewed emphasis on domestic supply resilience and compliance-ready production for high-purity grades used in mission-critical applications.
Hydrazine Market Report Scope and Research Methodology
Market Definition and Coverage
This market covers the sale and use of hydrazine and its common commercial forms used as chemical intermediates and functional additives across major end uses, with demand tracked across key producing and consuming regions.
Scope exclusions: This sizing excludes captive, in-process hydrazine that is produced and consumed within the same site without an external sale, and it excludes downstream finished formulations where hydrazine is only a minor ingredient.
Segments Covered in This Report
- By Type
- Hydrazine Hydrate
- Hydrazine Nitrate
- Hydrazine Sulfate
- Other Types
- By Application
- Corrosion Inhibitor
- Explosives
- Rocket Fuel
- Medicinal Ingredient
- Precursor To Pesticides
- Blowing Agent
- Other Applications
- By End-user Industry
- Pharmaceuticals
- Agrochemicals
- Industrial
- Other End-user Industries
- Geography
- Asia-Pacific
- China
- India
- Japan
- South Korea
- Malaysia
- Thailand
- Indonesia
- Vietnam
- Rest of Asia-Pacific
- North America
- United States
- Canada
- Mexico
- Europe
- Germany
- United Kingdom
- Italy
- France
- Spain
- NORDIC Countries
- Turkey
- Russia
- Rest of Europe
- South America
- Brazil
- Argentina
- Colombia
- Rest of South America
- Middle-East and Africa
- Saudi Arabia
- Qatar
- United Arab Emirates
- Nigeria
- Egypt
- South Africa
- Rest of Middle-East and Africa
- Asia-Pacific
Data Sources, Market Sizing, and Validation
Desk Research
For the desk part, we start by setting the industry context and building the demand pool using public data that is traceable. Typical inputs include trade and production signals from sources such as UN Comtrade, national customs statistics, and industrial chemical releases reporting (for example, the US EPA Toxics Release Inventory). Safety and handling rules from regulators such as OSHA and ECHA also help us understand where demand can shift when compliance costs and permitting timelines change.
We then connect these macro signals to market mechanics using company annual reports, investor presentations, and press releases, followed by relevant patent databases and peer reviewed journals for process and application trends (for example, ketazine routes, purity requirements, and substitution discussions). Where available, paid subscriptions are used in a limited way for company financials and news screening, and to cross-check import and export shipment patterns at a higher level. The sources listed here are illustrative, and many other public references are also reviewed for data collection, validation, and clarification.
Primary Interviews and Surveys
Primary work is used to pressure-test the desk assumptions with people who manage hydrazine pricing, volume planning, and regulatory compliance on an ongoing basis. We covered producers, distributors, and large end users across APAC, EMEA, and the Americas so regional capacity changes and demand seasonality could be discussed, and then reflected back into the model.
Distribution of primary research fieldwork respondents
| Company type | Respondent position | Region |
|---|---|---|
| Top tier: 28% | CXOs: 14% | APAC: 44% |
| Mid tier: 56% | Functional/Unit leaders: 35% | EMEA: 34% |
| Smaller Players: 16% | Managers: 51% | Americas: 22% |
Market-Sizing & Forecasting
Sizing is built using a top-down approach where production, trade flows, and end-use intensity are reconstructed into an addressable demand pool, then converted into market value using observed price bands for the relevant hydrazine forms. To keep the totals realistic, the outputs are corroborated with selective bottom-up checks such as sampled supplier capacity confirmations, channel conversations on typical contract structures, and a volume times average selling price build for a few major applications.
In the model, we track practical inputs that tend to move hydrazine demand, such as agrochemical intermediate output trends, polymer foaming and blowing agent usage signals, corrosion inhibitor consumption in power and industrial water systems, aerospace and defense activity indicators tied to propellants, and regional operating rates plus planned turnarounds at hydrazine units. Because these inputs do not all move together, we rely on scenario analysis for forecasting, where base, high, and low cases are set and then adjusted using expert consensus on capacity additions, regulatory tightening, and price pass-through. When a direct volume figure is not available for a small country or niche use, gaps are handled through proxy ratios (trade intensity, downstream output indices, and comparable per-capita industrial activity) before being re-checked in interviews.
Data Validation & Update Cycle
Validation is done in multiple passes so that large swings are questioned before the numbers are finalized. We compare the model output against independent signals such as trade totals, announced capacity, and downstream production indicators, then investigate variances that fall outside expected ranges.
A second analyst review is used to challenge the inputs, conversion steps, and any pricing assumptions, after which follow-up calls are triggered if a key variable moved materially. The report is refreshed on an annual cycle, and interim updates are made when major events occur, such as plant outages, new capacity start-ups, or regulation changes. Before delivery, the latest public data points are rechecked so clients receive an updated view rather than an older snapshot.
Mordor Intelligence's Hydrazine Market Size Compared With Other Published Estimates
Published hydrazine market values still vary even when the same end uses are discussed, because firms do not always align on what is counted, the year used for pricing, and how volumes are converted into revenue. Differences also show up when one estimate leans on a single demand indicator, while another blends trade, production, and end-use intensity into a combined view.
Captive, in-process hydrazine that never enters external trade sits outside Mordor Intelligence's scope, which can pull the value lower versus estimates that implicitly treat all production as marketable volume. We also see gaps when others apply a single global average price across grades and derivatives, or when currency timing and refresh cadence are not aligned to the same year, which can inflate or compress the stated USD totals.
Benchmark comparison
| Source | Market Size | Gaps in Research Methodology |
|---|---|---|
| Mordor Intelligence | USD 0.58 B (2025) | |
| Global Research Publisher A | USD 0.58 B (2024) | Uses a different base year and typically anchors value on a single stated revenue point, which can miss grade-level price spreads and year-specific currency timing. |
| Industry Research Publisher B | USD 0.58 B (2025) | Extends the forecast horizon and may use broader inclusion for derivatives and application baskets, which can shift value even if the headline year looks similar. |
The table indicates that the spread is often more about definitions and conversion steps than about demand direction. By keeping the scope tied to externally sold hydrazine and linking volume to application-level price bands, the final number stays traceable to inputs that can be checked and repeated.
Key Questions Answered in the Report
How large is the hydrazine market in 2026?
The hydrazine market size reached 388.76 kilo tons in 2026.
What is the expected growth rate through 2031?
Volume is projected to expand at a 5.71% CAGR, approaching 513.16 kilo tons by 2031.
Which region leads consumption?
Asia-Pacific held 55.51% of global volume in 2025 and is also the fastest-growing region.
Which end-user segment is growing fastest?
Pharmaceuticals are forecast to rise at a 5.98% CAGR, outpacing other sectors.
What are the main regulatory headwinds?
Strict classification under EU REACH and the shift toward green monopropellants constrain future demand growth in Western markets.
Why is hydrazine hydrate preferred?
Its aqueous form lowers vapor pressure and simplifies transport, explaining its 60.17% share of 2025 demand.