
Hydrazine Hydrate Market Size and Share
Market Overview
| Study Period | 2020 - 2031 |
|---|---|
| Market Volume (2026) | 238.44 kilotons |
| Market Volume (2031) | 327.62 kilotons |
| Growth Rate (2026 - 2031) | 6.57 % |
| Fastest Growing Market | Asia Pacific |
| Largest Market | Asia Pacific |
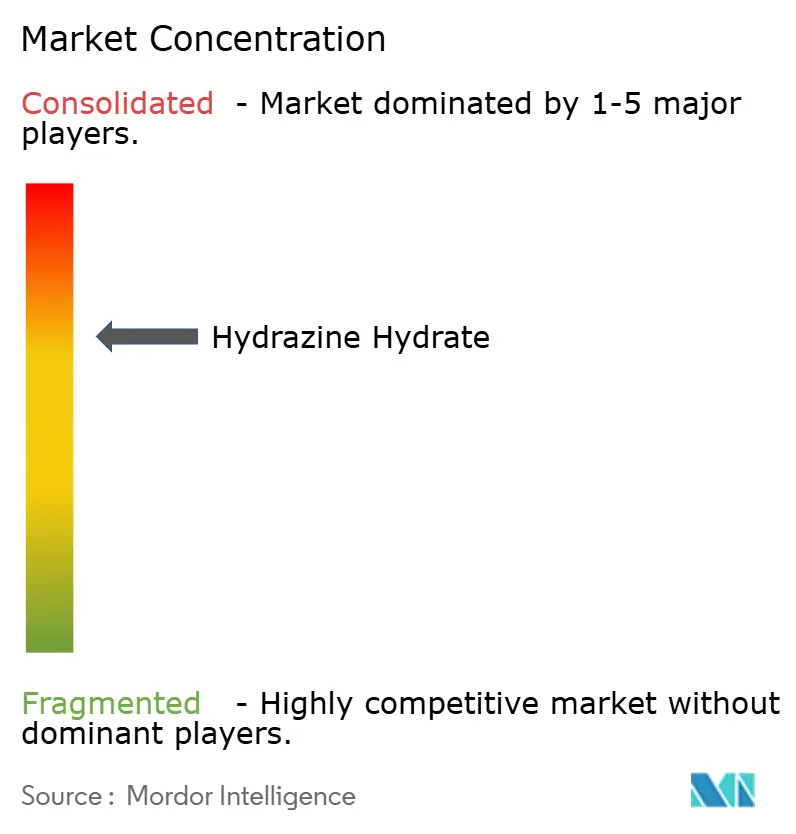
| Market Concentration | Medium |
Major Players *Disclaimer: Major Players sorted in no particular order Image © Mordor Intelligence. Reuse requires attribution under CC BY 4.0. | |
Hydrazine Hydrate Market Analysis by Mordor Intelligence
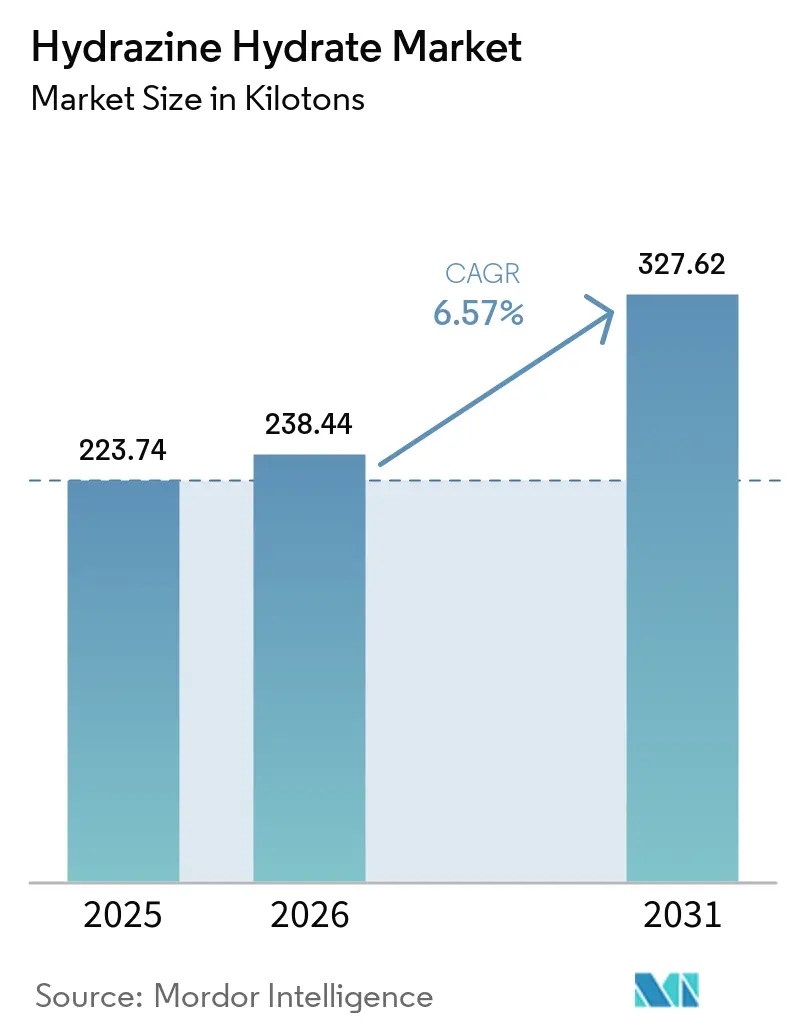
The Hydrazine Hydrate Market size was valued at 223.74 kilotons in 2025 and estimated to grow from 238.44 kilotons in 2026 to reach 327.62 kilotons by 2031, at a CAGR of 6.57% during the forecast period (2026-2031). Strong momentum comes from polymerization, blowing-agent use, expanding pharmaceutical API output, and first-generation deployments of direct hydrazine fuel cells. Process innovations—especially in the H₂O₂–ketazine route—continue to lower energy intensity and waste streams, improving cost positions for integrated producers. Growing demand for high-purity grades in aerospace and defense keeps margins firm even as mainstream industrial applications face tighter environmental scrutiny. Technology licensing, feedstock integration, and on-site hydrogen peroxide capacity are emerging as decisive competitive differentiators in the hydrazine hydrate market.
Key Report Takeaways
- By production process, the Bayer Ketazine Process led with 45.23% of hydrazine hydrate market share in 2025, while the H₂O₂–Ketazine Process is set to register the fastest 7.29% CAGR through 2031.
- By concentration, the 80–100% grade commanded 51.82% share of the hydrazine hydrate market size in 2025, and the 100% anhydrous category is poised to advance at a 7.36% CAGR between 2026 and 2031.
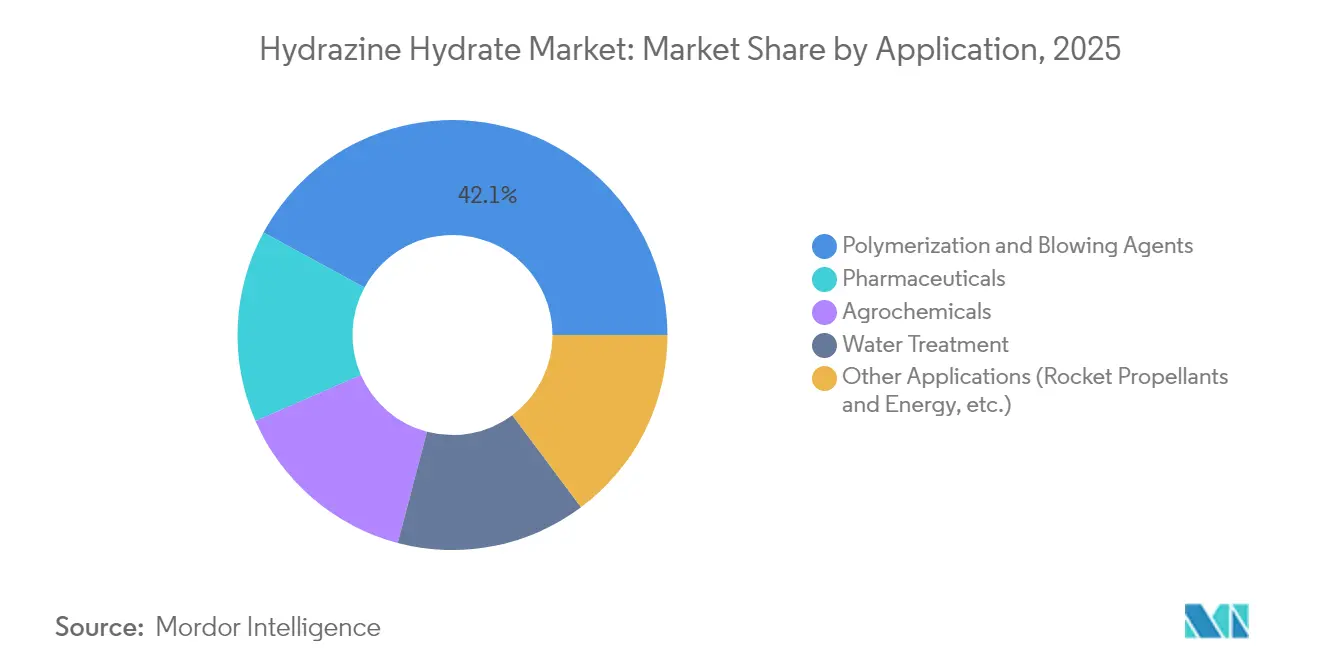
- By application, polymerization and blowing agents captured 42.10% revenue share in 2025; the “other applications” bucket—which includes rocket propellants and energy systems—shows the highest 7.68% CAGR outlook to 2031.
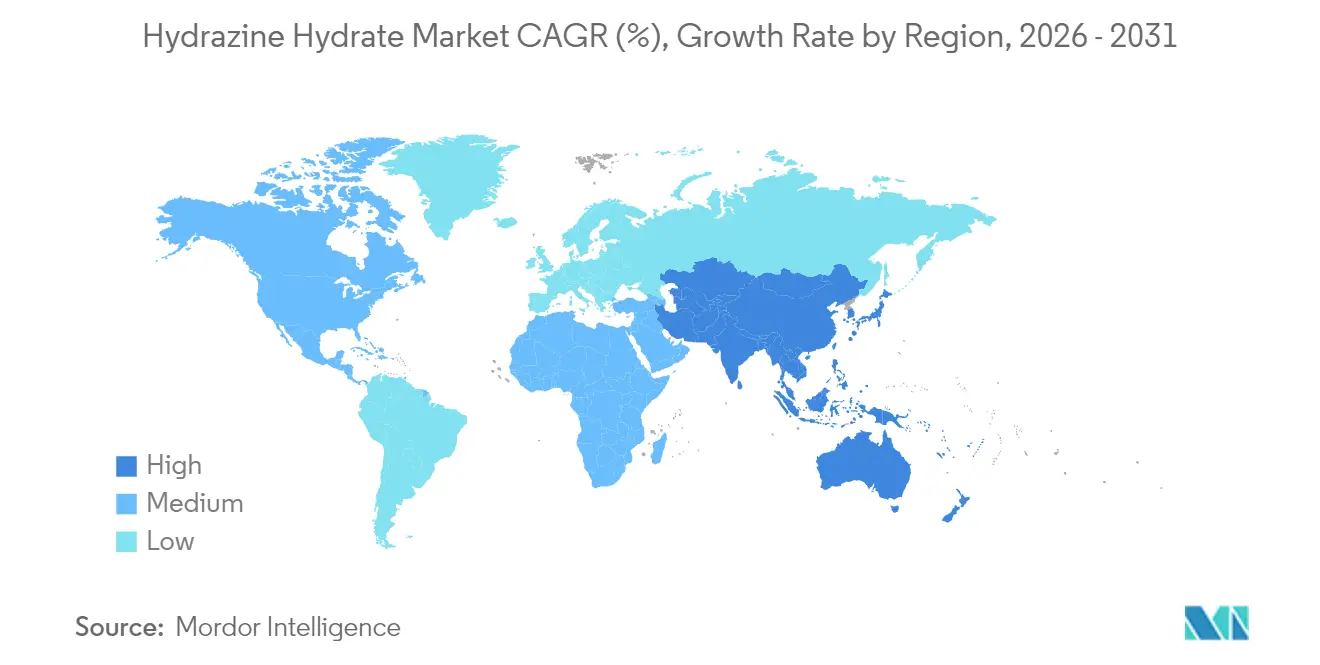
- By geography, Asia-Pacific retained 52.70% share of the hydrazine hydrate market in 2025 and is projected to expand at a 7.18% CAGR through 2031.
Note: Market size and forecast figures in this report are generated using Mordor Intelligence’s proprietary estimation framework, updated with the latest available data and insights as of 2026.
Market Trends and Insights
Drivers Impact Analysis of Hydrazine Hydrate Market*
| Driver | (~) % Impact on CAGR Forecast | Geographic Relevance | Impact Timeline |
|---|---|---|---|
| Growing demand from polymerization and blowing-agent manufacturers | +1.80% | Global, with concentration in Asia-Pacific and North America | Medium term (2-4 years) |
| Expanding pharmaceutical API production | +1.20% | Asia-Pacific core, spill-over to North America and Europe | Long term (≥ 4 years) |
| Stricter global effluent norms boosting water-treatment usage | +0.90% | Global, particularly developed markets | Medium term (2-4 years) |
| Adoption of hydrazine-based corrosion inhibitors in stationary fuel cells | +0.70% | North America & EU, expanding to Asia-Pacific | Long term (≥ 4 years) |
| Process innovations lowering energy cost of H₂O₂-ketazine route | +0.60% | Global, led by technology leaders in developed markets | Short term (≤ 2 years) |
| Source: Mordor Intelligence | |||
Growing Demand from Polymerization and Blowing-Agent Manufacturers
Regulatory phase-outs of high-GWP hydrofluorocarbons have pushed polymer producers toward hydrazine-based chemical blowing agents, giving the hydrazine hydrate market sustained volume visibility. Demand is most vivid in rigid and flexible polyurethane foams used across building insulation and automotive lightweighting. Hydrazine’s dual role as chain extender and stabilizer trims formulation complexity and improves cell uniformity, which helps converters meet tighter energy-efficiency codes[1]. Foam makers adopting fourth-generation hydrofluoroolefins tend to retain hydrazine systems because processing windows overlap, curbing changeover costs. Bio-based polymer initiatives add another leg of demand as producers test renewable feedstocks compatible with hydrazine-mediated reactions.
Expanding Pharmaceutical API Production
National reshoring policies championed in the United States and Europe have triggered a wave of continuous-manufacturing investments that favor hydrazine hydrate’s flow-chemistry compatibility. The compound is central to synthesizing modified nucleosides and nucleotides now embedded in antiviral and oncology pipelines. China and India continue to scale multipurpose API blocks, reinforcing Asia-Pacific’s lead in the hydrazine hydrate market. Novel zero-background fluorescence probes allow real-time hydrazine detection inside reactors, sharpening quality control and minimizing batch failures. Long drug-development timelines anchor predictable offtake, insulating pharmaceutical demand from short-cycle swings in other end markets.
Stricter Global Effluent Norms Boosting Water-Treatment Usage
Power producers and process plants intensify boiler-feed conditioning programs as regulators tighten discharge limits on iron, copper, and residual dissolved oxygen. Hydrazine remains the most rapid oxygen scavenger available, forming harmless nitrogen and water while doubling as a pH buffer—a dual benefit that helps operators rationalize chemical inventories. Although non-toxic carbohydrazide and amine-based alternatives gain mindshare, many high-pressure systems continue using hydrazine because of proven kinetics under elevated temperature and pressure. Municipal utilities deploy it selectively in specialized polishing loops where full oxygen removal is critical for membrane protection.
Adoption of Hydrazine-Based Corrosion Inhibitors in Stationary Fuel Cells
Data-center backup, telecom towers, and remote microgrids are adopting direct hydrazine fuel cells for quiet, instant-start power. These units operate at room temperature, sidestepping bulky compressed-hydrogen storage and enabling simpler permitting. Catalyst breakthroughs have removed platinum, trimming stack costs and supporting broader commercial roll-out. Military applications require high-energy-density cartridges that rely on ultra-pure hydrazine, boosting margins for qualified suppliers. Parallel research on decoupled electrolysis positions hydrazine oxidation as a means to improve hydrogen production efficiency, creating additive demand streams.
Restraints Impact Analysis of Hydrazine Hydrate Market*
| Restraint | (~) % Impact on CAGR Forecast | Geographic Relevance | Impact Timeline |
|---|---|---|---|
| Stringent toxicity and transport regulations | -1.40% | Global, particularly EU and North America | Short term (≤ 2 years) |
| High insurance / handling costs due to explosion risk | -0.80% | Global, with higher impact in developed markets | Medium term (2-4 years) |
| Feed-stock shortages of high-grade H₂O₂ in Asia | -0.60% | Asia-Pacific core, spill-over to global supply chains | Short term (≤ 2 years) |
| Source: Mordor Intelligence | |||
Stringent Toxicity and Transport Regulations
Hydrazine’s listing as a substance of very high concern under EU REACH forces producers and users into costly authorization dossiers and drives R&D into safer analogues. Shipping is equally complex: United Nations Model Regulations classify hydrazine as a Class 8 corrosive and Class 3 flammable liquid, obliging insulated, pressure-rated containers and certified handlers. The United States harmonized domestic rules with updated international standards in 2024, prompting relabeling and extra training across the supply chain[2]. Aerospace primes lobby for extended use exemptions, but alternative propellant programs backed by EUR 1.4 million in EU funding signal political intent to phase down hydrazine over the long run.
High Insurance and Handling Costs Due to Explosion Risk
Recent plant incidents have pushed insurers to recalibrate loss-expectancy models, inflating premiums for facilities storing more than 10 tons of hydrazine. Operators must add blast-resistant walls, advanced gas-detection arrays, and redundant inert-gas purging—all of which inflate capital outlays. Thermo-reversible gels under evaluation can immobilize hydrazine for transit, but commercial adoption hinges on cost-benefit proof in bulk logistics. Smaller formulators increasingly outsource hydrazine-based processing steps to toll manufacturers with specialized infrastructure, consolidating demand among fewer, larger players.
*Our forecasts treat driver/restraint impacts as directional, not additive. The impact forecasts reflect baseline growth, mix effects, and variable interactions.
Hydrazine Hydrate Market Segment Analysis
By Production Process:
Ketazine Routes Drive Efficiency RevolutionThe Bayer Ketazine Process retained a commanding 45.23% hydrazine hydrate market share in 2025 because of long-established global capacity networks and robust catalyst know-how. H₂O₂–ketazine lines, while newer, are adding units at a brisk 7.29% CAGR, underpinned by lower energy intensity and simplified waste treatment.
Plant debottlenecking strategies now involve membrane-based ketazine purification that recovers solvent and drives overall plant capacity without major plot-space additions. Licensing houses bundle digital twins with process packages, allowing real-time energy optimization and predictive maintenance. OEMs supplying titanium reactors report rising backlogs as Asia-Pacific customers race to meet local content rules and avoid import exposure. These dynamics keep the hydrazine hydrate market on an innovation trajectory that rewards energy-efficient flowsheets.


By Concentration:
Anhydrous Grade Captures Premium ApplicationsHigh-concentration streams (80–100%) represented 51.82% of demand in 2025 as customers favor lower shipping weight and extended shelf life. Within this band, 100% anhydrous hydrazine is forecast to grow 7.36% annually to 2031, lifted by rocket-propellant blending and advanced sensor-cleaning formulations. The hydrazine hydrate market size for lower-grade 55–80% solutions remains steady in water-treatment circuits where on-site dilution aligns with dosing equipment.
Membrane pervaporation coupled with vacuum distillation allows single-pass upgrading from 80% to 100% purity, slashing steam use and lowering greenhouse-gas footprints. Aerospace buyers, now bound by stringent propellant purity specs from space-agency audits, lock in multiyear contracts that provide volume visibility to specialty producers. Meanwhile, semiconductor fabs test ultra-dry hydrazine for surface passivation, a niche that could further reinforce anhydrous demand by the decade’s end.
By Application:
Energy Sector Disrupts Traditional Demand PatternsPolymerization and blowing-agent applications dominated 42.10% of volume in 2025, anchored by insulation demand and light-weighting initiatives in transportation. Yet the “other applications” category—covering propellants, fuel cells, and decoupled electrolysis—outpaces every segment with an 7.68% CAGR, underscoring diversification within the hydrazine hydrate market. Pharmaceutical intermediates hold mid-single-digit growth as mRNA derivative pipelines standardize hydrazine‐enabled synthesis routes.
Direct hydrazine fuel cells show round-trip efficiencies competitive with lithium-ion storage when waste-heat recovery is integrated, prompting telecom and data-center pilots. Ag-chem players face tightening residue limits that crimp hydrazine-based growth regulator volumes, yet specialty herbicide niches still rely on its unique functional profile where no drop-in replacements exist. This diversification insulates the hydrazine hydrate industry from single-segment downturns and sustains broad-based investment appetite.
Geography Analysis
APAC Hydrazine Hydrate Market
Asia-Pacific anchored 52.70% of global consumption in 2025, reflecting deep vertical integration from upstream hydrogen peroxide to downstream polymer foam converters. China holds a significant share of the world's installed capacity and continues to add H₂O₂–ketazine lines, although recent feedstock outages reminded buyers of latent supply-chain fragility. India’s production-linked incentives for APIs are catalyzing brownfield expansions that could lift national demand by 30 kilo tons before 2030. Japan maintains a niche leadership in high-purity grades for fuel-cell and semiconductor use, leveraging proprietary metallurgy for hydrazine handling systems.
North America Hydrazine Hydrate Market
North America demonstrates significant growth, driven by defense-grade propellant offtake, domestic API reshoring, and early-stage stationary fuel-cell rollouts. Federal grants for microgrid resilience include funding carve-outs for direct hydrazine technology testbeds, potentially deepening demand if cost targets are met. Canada’s specialty chemical hubs in Ontario and Quebec source hydrazine hydrate and hydrate inhibitors under long-term contracts, insuring against cross-border transport constraints tightened in 2024.
Europe Hydrazine Hydrate Market
Europe represents a mixed picture: REACH authorization costs and SVHC status raise compliance barriers, nudging some downstream users toward alternative chemistries, yet aerospace and advanced materials firms secure exemptions to prevent supply disruptions. Continental producers invest in green-hydrogen-linked hydrogen peroxide electrolyzers to decarbonize feedstocks, positioning for premium pricing once scope-3 reporting becomes mandatory. Together, these dynamics keep the hydrazine hydrate market firmly global while spotlighting regional regulatory divergence as a structural determinant of trade flows.
Regulatory Landscape
Hydrazine and hydrazine hydrate face stringent hazard-based controls across major regions, shaping permitting, packaging, and end-use patterns. In the European Union, hydrazine is on the REACH Candidate List as a Substance of Very High Concern (SVHC) since June 20, 2011, and carries harmonized CLP classifications that include Carcinogen 1B (H350) alongside acute toxicity and corrosivity; this pushes producers and downstream users toward contained industrial uses, higher compliance documentation, and tighter exposure controls.
Outside Europe, occupational and chemical-hazard frameworks reinforce similar constraints and raise the bar for transport and site safety. OSHA maintains a permissible exposure limit for hydrazine of 1 ppm in the United States, while Australia lists hydrazine in the Hazardous Chemical Information System with Carcinogenicity 1B and related acute toxicity/corrosion classifications. In India, Bureau of Indian Standards specifications and safety codes (IS 12086:2020 for product specification and IS 10871 for safety) anchor procurement and handling practices, and major-accident regimes such as Seveso III in Europe set tiered control thresholds for hydrazine hydrate storage (50 t lower-tier and 200 t upper-tier), influencing tank-farm sizing and insurance-driven safeguards.
Value Chain Analysis
The hydrazine hydrate value chain starts with upstream commodity and specialty inputs (ammonia, oxidants such as sodium hypochlorite/chlorine or hydrogen peroxide, and ketones such as acetone for ketazine routes), followed by capital-intensive synthesis and purification in tightly controlled facilities. Producers operate either legacy Raschig/urea processes or ketazine-based routes, with a growing shift toward H2O2-ketazine configurations that reduce effluent loads and improve energy performance, making access to reliable, high-grade hydrogen peroxide and on-site utilities a key integration lever.
Midstream, handling and compliance requirements (closed transfer, certified packaging, and hazardous-waste treatment) add meaningful operating overhead and tend to favor integrated players with established EHS systems and analytical quality control. Downstream distribution typically moves through specialized chemical distributors or direct contracts to large users in polymerization and blowing agents, water-treatment oxygen scavenging, pharmaceuticals and agrochemical intermediates, and niche high-purity demand for aerospace and energy systems. Bottlenecks increasingly center on availability of high-purity capacity, qualified analytical validation capability for regulated end uses, and regional transport constraints that make local production footprints and long-term offtake agreements more important for supply continuity.
Competitive Landscape
The hydrazine hydrate market exhibits moderately consolidated concentration: the five largest players collectively control around 61% of global capacity. Integrated producers spanning hydrogen peroxide, ketazine intermediates, and downstream formulations command cost and quality advantages that smaller formulators struggle to match.
Leading incumbents prioritize vertical integration and geographic diversification to cushion against regional transport restrictions and insurance cost spikes. Capital budgets favor H₂O₂–ketazine retrofits, effluent-reduction units, and high-purity isolation trains. Technology partnerships with membrane vendors and advanced analytics firms aim to unlock incremental yield gains and energy savings that translate directly into margin uplift.
Policy uncertainty around future toxicity classifications incentivizes parallel R&D tracks: while legacy hydrazine lines secure REACH authorization, companies explore ammonium dinitramide, nitrous oxide, and hydroxylammonium nitrate as next-generation propellants. Those holding process patents for hydrazine hydrate also license know-how to emerging-market entrants—both extending revenue streams and tightening global supply discipline.
Hydrazine Hydrate Industry Leaders
-
Arkema
-
LANXESS
-
Lonza
-
Otsuka Chemical Co.,Ltd.
-
Yibin Tianyuan Group
- *Disclaimer: Major Players sorted in no particular order
Hydrazine Hydrate Market Companies Covered in this Report
- Arkema
- Capot Chemical Co.,Ltd.
- Chemtex Speciality Limited
- Gujarat Alkalies and Chemicals Limited
- Haihang Industry
- Hangzhou Dayangchem Co. Ltd
- HPL Additives Limited.
- Hunan Zhuzhou Chemical Industry Group
- IRO Water Treatment Co., Ltd.
- LANXESS
- Lonza
- Matrix Fine Chemicals GmbH
- NIPPON CARBIDE INDUSTRIES CO., INC.
- Otsuka Chemical Co.,Ltd.
- Shandong ThFine Chemical Co., Ltd
- Thermo Fisher Scientific Inc.
- Vizag Chemicals
- Weifang Yaxing Chemical Co., Ltd.
- Yibin Tianyuan Group
Market Opportunities and Future Outlook
A clear whitespace area is regional import substitution paired with scale-up of compliant domestic capacity, particularly in Asia-Pacific where demand is anchored by polymer foams, APIs, and selective energy applications. India provides a recent proof point: Spl Additives Private Limited announced a proposed hydrazine hydrate expansion at RIICO Industrial Area, Hanumangarh (Rajasthan) in January 2026, targeting an increase from 195 MT per month to 1,000 MT per month, signaling room for additional local and adjacent supply-chain investments in purification, packaging, and hazardous logistics.
Technology and product-mix upgrading also present opportunity where regulations and end-user qualification tighten the market toward higher-purity and lower-emission production footprints. The industry is actively differentiating via process selection (including H2O2-ketazine flowsheets), on-site oxidant integration, and high-purity isolation trains that serve aerospace, defense, and emerging fuel-cell-related demand that depends on stringent impurity control. In parallel, EU REACH SVHC status and national exposure limits are pushing buyers to prefer suppliers with robust authorization, traceability, and transport-ready packaging, creating commercial space for qualified producers and tollers that can provide assured compliance documentation and closed-loop handling from plant gate to end-user.
Recent Industry Developments in Hydrazine Hydrate Market
- January 2026: Spl Additives Private Limited announced a proposed expansion of hydrazine hydrate capacity at RIICO Industrial Area, Hanumangarh (Rajasthan), increasing planned output from 195 MT per month to 1,000 MT per month. The move highlights India-focused supply buildout aimed at reducing reliance on imports and improving availability for downstream users that require steady, locally delivered volumes.
- July 2025: Gujarat Alkalies and Chemicals Limited completed a capacity expansion at its Dahej hydrazine hydrate facility, broadening domestic supply and strengthening pricing competitiveness against imports.
- May 2024: The United Nations Environment Programme Technology and Economic Assessment Panel (TEAP) published a progress update on transitions away from high-GWP hydrofluorocarbons, reinforcing the regulatory direction behind foam-industry formulation changes. As polymer and insulation value chains adjust blowing-agent systems, hydrazine-based chemical blowing agents and related intermediates remain tied to the compliance-driven reformulation cycle in multiple regions.
Hydrazine Hydrate Market Report Scope and Research Methodology
Market Definition and Coverage
For this methodology, the hydrazine hydrate market covers the demand for hydrazine in aqueous form, sold across industrial concentration ranges, and consumed in chemical manufacturing and treatment uses where it is used as a reactive intermediate or functional additive.
Scope exclusions: We exclude downstream finished products where hydrazine hydrate is only an embedded input and not separately traded or priced as hydrazine hydrate.
Segments Covered in This Report
- By Production Process
- Raschig Process
- Bayer Ketazine Process
- Urea Process
- H₂O₂–Ketazine Process
- By Concentration
- Less than 55%
- 55–80%
- 80–100%
- 100% (Anhydrous)
- By Application
- Polymerization and Blowing Agents
- Pharmaceuticals
- Agrochemicals
- Water Treatment
- Other Applications (Rocket Propellants and Energy, etc.)
- By Geography
- Asia-Pacific
- China
- Japan
- India
- South Korea
- ASEAN Countries
- Rest of Asia-Pacific
- North America
- United States
- Canada
- Mexico
- Europe
- Germany
- United Kingdom
- France
- Italy
- Spain
- Russia
- NORDIC Countries
- Rest of Europe
- South America
- Brazil
- Argentina
- Rest of South America
- Middle East and Africa
- Saudi Arabia
- South Africa
- Rest of Middle East and Africa
- Asia-Pacific
Data Sources, Market Sizing, and Validation
Desk Research
Desk research is used to ground the market in observable supply and demand signals before any forecasting is done. We rely on public sources such as national industrial statistics agencies, UN Comtrade trade flows, chemical safety and classification records (such as ECHA and the US EPA), and technical publications and peer reviewed journals that describe hydrazine hydrate uses and typical concentration norms.
It is then supported with supplier disclosures like annual reports, investor presentations, and regulatory filings, which help in tracking capacity additions, plant shutdowns, and reported business exposure to hydrazine derivatives. Where needed, we also reference paid subscriptions for company financials and intelligence, patent databases, and shipment level import export data to cross-check directionality in volumes and pricing. The sources listed above are illustrative and not exhaustive, and many other references were also used for data collection, validation, and clarification.
Primary Interviews and Surveys
Primary work is used to validate what desk research cannot show clearly, especially on effective pricing, concentration mix, and how demand is split across key use areas like polymer blowing agents, pharmaceuticals, agrochemicals, and water treatment. We spoke with a mix of producers, distributors, and downstream users, and the discussions were balanced across major consuming regions so pricing logic and demand indicators could be checked against real buying behavior.
Distribution of primary research fieldwork respondents
| Company type | Respondent position | Region |
|---|---|---|
| Top tier: 36% | CXOs: 12% | APAC: 50% |
| Mid tier: 42% | Functional/Unit leaders: 40% | EMEA: 32% |
| Smaller Players: 22% | Managers: 48% | Americas: 18% |
Market-Sizing & Forecasting
The core model is built using a top-down approach where production, trade, and apparent consumption signals are reconstructed by region and then adjusted for typical concentration bands and end-use intensity. Once the demand pool is formed, selective bottom-up approximations are used to keep totals realistic, including sampling supplier volumes, channel checks on availability, and a simple price per ton by concentration mix to sanity check value direction.
Key inputs used in the model include plant capacity and operating rate cues, import export movement patterns, concentration mix shifts (for example, mid-range versus high concentration grades), application-side activity in polymer foams and chemical synthesis, and regional regulatory pressure that can change handling and substitution behavior. Forecasting is run through scenario analysis, and the base case is aligned to what interviewees expect for capacity additions, pricing movement, and downstream demand over the next few years. Where bottom-up signals are missing for smaller countries, the gap is handled through proxy ratios using trade intensity and sector output indicators, and then rechecked in reviews before finalizing.
Data Validation & Update Cycle
All outputs are cross-checked against independent indicators like trade direction, capacity announcements, and expected application growth so that no single data stream overdrives the result. Variances are investigated at the country and concentration level, and outliers trigger a second pass on assumptions, with follow-up calls when a discrepancy cannot be explained through documented factors.
Before sign-off, the model and write-up go through multi-step analyst reviews, including checking unit consistency, currency timing, and year-on-year movement logic. The report is refreshed annually, and interim updates are made when there are material events such as major capacity changes or regulatory actions. Right before delivery, a final refresh pass is completed so the numbers reflect the latest available signals.
Mordor Intelligence's Hydrazine Hydrate Market Size Compared Against Other Published Estimates
Published market sizes for hydrazine hydrate often do not match because sources define the product differently and then apply different conversion methods between volume and value. The year used, assumed pricing for different concentration grades, and whether trade flows are netted or grossed up can also shift the final number.
In this study, the main gap drivers come from how aqueous grades are treated versus anhydrous material, how concentration mix is applied to pricing, and whether the model assumes a faster shift into high-purity uses like pharmaceuticals. Some estimates also lean more on a single base year value and then project forward without re-checking capacity utilization and trade changes each year, which can understate mid-cycle supply additions or overstate tightness.
Benchmark comparison
| Source | Market Size | Gaps in Research Methodology |
|---|---|---|
| Mordor Intelligence | USD 223.74 M (2025) | |
| Industry Research Publisher A | USD 413.77 M (2025) | This figure appears to be value-forward with broader pricing assumptions, and it likely blends higher-priced grades and adjacent hydrazine derivatives more aggressively, which lifts the implied value per ton versus a concentration-mix based check. |
| Industry Research Publisher B | USD 484.00 M (2024) | This estimate is anchored to a different base year and is presented as sales revenue, which can reflect invoiced value and distribution markups, and it may not normalize currency timing and grade mix consistently across regions. |
The table shows that most of the spread can be traced back to how volume is translated into dollars, especially when concentration mix and channel markups are handled differently. When pricing by grade is tied back to trade signals and plant operating cues, and when anomalies trigger re-contact with market participants, the sizing stays closer to the traded hydrazine hydrate pool as modeled and refreshed in Mordor Intelligence.
Key Questions Answered in the Report
What is the current hydrazine hydrate market size and its growth outlook?
The hydrazine hydrate market size is 238.44 kilo tons in 2026 and is projected to reach 327.62 kilo tons by 2031, reflecting a 6.57% CAGR.
Which region leads global consumption of hydrazine hydrate?
Asia-Pacific dominates with 52.70% share and is also the fastest-growing region at a 7.18% CAGR through 2031.
Why is the H₂O₂–ketazine process gaining popularity?
It reduces hot-utility demand by nearly 67%, lowers effluent loads, and aligns with green-hydrogen-peroxide feedstocks, making it the most energy-efficient production route.
How do regulatory changes in Europe affect hydrazine hydrate demand?
EU REACH classification as an SVHC raises authorization costs and encourages research into safer propellants, but aerospace and defense exemptions keep essential demand intact.
What drives the surge in high-purity anhydrous hydrazine?
Growing rocket-propellant needs, semiconductor cleaning, and premium fuel-cell cartridges require 100% purity grades, pushing this sub-segment to a 7.36% CAGR.
How concentrated is the competitive landscape?
The market is moderately consolidated with the top five suppliers controlling around 61% of capacity.