
Hydraulic Fluid Market Size and Share
Market Overview
| Study Period | 2020 - 2031 |
|---|---|
| Market Volume (2026) | 1.84 Billion liters |
| Market Volume (2031) | 2.27 Billion liters |
| Growth Rate (2026 - 2031) | 4.32 % |
| Fastest Growing Market | Asia-Pacific |
| Largest Market | Asia-Pacific |
| Market Concentration | Medium |
Major Players *Disclaimer: Major Players sorted in no particular order Image © Mordor Intelligence. Reuse requires attribution under CC BY 4.0. | |
Hydraulic Fluid Market Analysis by Mordor Intelligence
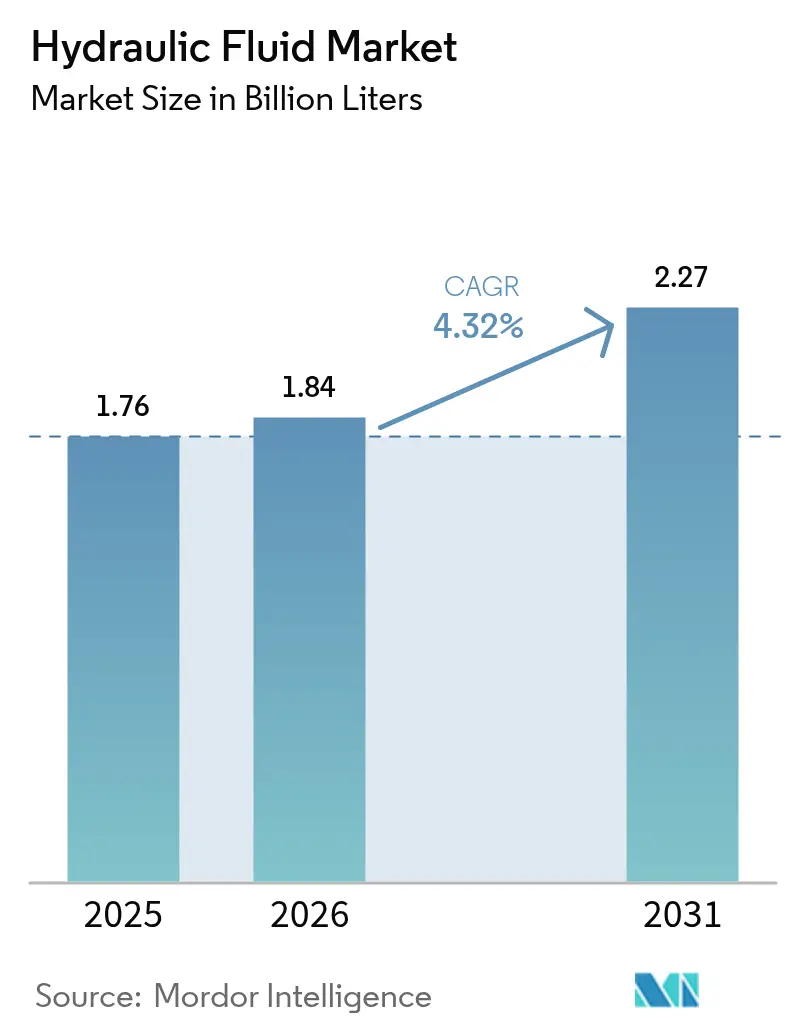
The Hydraulic Fluid Market size was valued at 1.76 billion liters in 2025 and estimated to grow from 1.84 billion liters in 2026 to reach 2.27 billion liters by 2031, at a CAGR of 4.32% during the forecast period (2026-2031). This sustained growth trajectory stems from steady infrastructure spending, a broad wave of equipment modernization, and the unmatched power density that fluid power offers in construction, mining, and agricultural machinery. Capital outlays for new earth-moving equipment, rising automation in factories, and the mechanization of large farms underpin recurring demand for high-quality fluids. Regulatory pushes for cleaner operations are encouraging end users to shift from legacy formulations toward low-viscosity and biodegradable blends, yet cost-effective mineral oils continue to dominate high-volume applications. Competitive intensity remains moderate: major lubricant suppliers leverage wide distribution footprints and technical service networks to lock in long-term service contracts, while regional specialists focus on niche applications such as fire-resistant aerospace fluids.
Key Report Takeaways
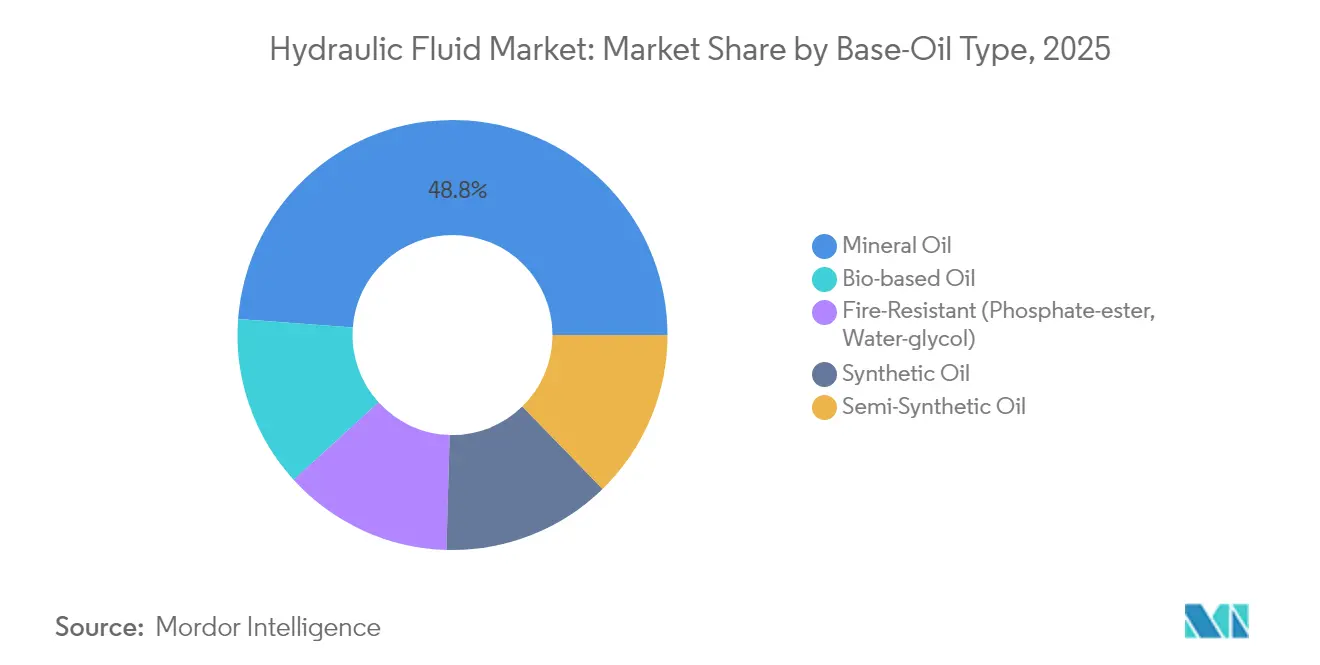
- By base-oil type, mineral oils led with 48.81% of hydraulic fluid market share in 2025, while bio-based products are forecast to expand at a 5.03% CAGR through 2031.
- By application, mobile hydraulic systems captured 54.76% of the hydraulic fluid market share in 2025; industrial stationary systems are projected to grow at a 4.26% CAGR through 2031.
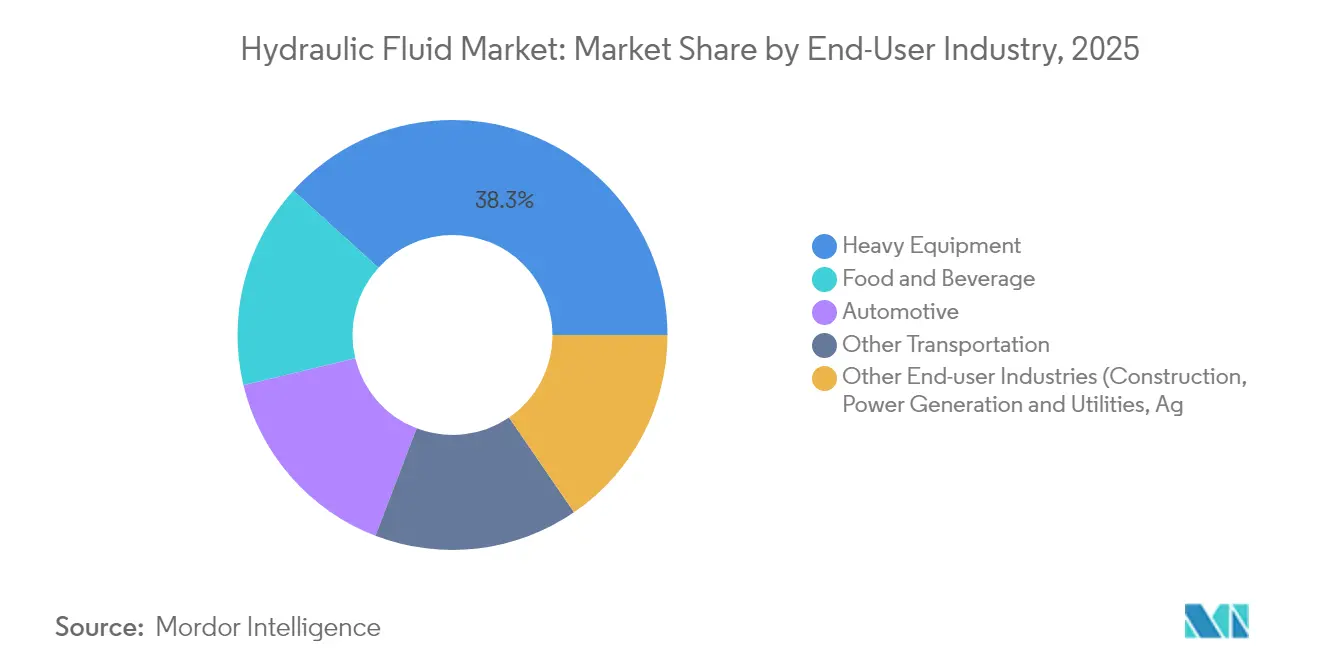
- By end-user industry, heavy equipment held 38.26% of the hydraulic fluid market size in 2025, whereas the “Other End-Industries” category is set to advance at a 5.94% CAGR between 2026 and 2031.
- By geography, Asia-Pacific commanded 40.75% revenue share in 2025, and the region is positioned to post the fastest 5.36% CAGR to 2031.
Note: Market size and forecast figures in this report are generated using Mordor Intelligence’s proprietary estimation framework, updated with the latest available data and insights as of 2026.
Global Hydraulic Fluid Market Trends and Insights
Drivers Impact Analysis*
| Driver | (~) % Impact on CAGR Forecast | Geographic Relevance | Impact Timeline |
|---|---|---|---|
| Expanding construction and mining activities | +1.2% | Global with emphasis on Asia-Pacific and Middle East | Medium term (2-4 years) |
| Automotive and EV production growth | +0.8% | Global, led by Asia-Pacific manufacturing hubs | Long term (≥ 4 years) |
| Shift toward energy-efficient hydraulics | +0.6% | North America and Europe, spreading to Asia-Pacific | Medium term (2-4 years) |
| Agricultural mechanization surge | +0.9% | Asia-Pacific core, spill-over to Latin America and Africa | Long term (≥ 4 years) |
| Adoption of fire-resistant aerospace fluids | +0.3% | Global, concentrated in aerospace manufacturing regions | Short term (≤ 2 years) |
| Source: Mordor Intelligence | |||
Expanding Construction and Mining Activities
Construction equipment accounts for 76% of hydraulic equipment usage and therefore dominates fluid consumption. Robust infrastructure pipelines under China’s Belt and Road framework and India’s National Infrastructure Pipeline translate into sustained purchases of excavators, loaders, and cranes that demand premium fluids capable of coping with heat, dust, and extended duty cycles. Safety regulations in U.S. underground mining stipulate MSHA-approved fire-resistant fluids, boosting demand for phosphate-ester and water-glycol blends[1]U.S. Department of Labor, “MSHA hydraulic fluid fire safety regulations,” dol.gov. The post-pandemic rebound in mega-projects, alongside urbanization and resource extraction, creates a durable tailwind for the hydraulic fluid market.
Automotive and EV Production Growth Boosting Demand for Advanced Hydraulics
Electric-vehicle assembly lines still rely on high-force hydraulic presses and battery-pack lifting rigs. These stations require fluids with superior electrical insulation and thermal stability, prompting formulation innovation such as water-based and low-conduction esters. TotalEnergies recently debuted water-based lubricants aimed at EV cooling loops, underscoring how fluid suppliers are repositioning around new drivetrain architectures[2]TotalEnergies, “Launch of water-based lubricant for EV,” totalenergies.com . While steer-by-wire and brake-by-wire cut conventional automotive fluid volumes, incremental opportunities in EV battery production, giga-presses, and body-in-white operations offset volume losses.
Shift Toward Energy-Efficient Hydraulic Equipment in Manufacturing
Plant operators target lower total cost of ownership, so interest in low-traction, low-viscosity hydraulic fluids is rising. Laboratory testing shows torque losses fall by up to 30% when systems are filled with advanced, friction-optimized blends. U.S. Department of Energy efficiency standards for pumps and compressors amplify this shift by nudging OEMs and users to combine variable-speed drives with ultra-shear stability fluids. ISO 4413 design guidelines also highlight energy considerations, encouraging the adoption of fluids that cut internal leakage and heat generation.
Agricultural Mechanization Surge in Emerging Economies
India produced more than 1 million tractors in 2024 and now shows wheat mechanization at 69% and rice at 50%. Subsidy schemes like the Sub-Mission on Agricultural Mechanization reduce up-front equipment costs, accelerating fluid demand from pump, harvester, and planter hydraulics. OEMs such as Kubota are expanding in-house hydraulic component output to secure supply for precision farming machines, further enlarging the installed base that consumes biodegradable fluids acceptable for sensitive soil environments. Similar trends in Southeast Asia and Africa strengthen the growth outlook.
Restraints Impact Analysis*
| Restraint | (~) % Impact on CAGR Forecast | Geographic Relevance | Impact Timeline |
|---|---|---|---|
| Crude-oil price volatility | -0.7% | Global, greater effect in price-sensitive markets | Short term (≤ 2 years) |
| High cost and limited supply of bio and synthetics | -0.5% | Global, stronger in emerging economies | Medium term (2-4 years) |
| Rapid electrification of mobile machinery | -0.4% | Developed markets leading, gradual spread elsewhere | Long term (≥ 4 years) |
| Source: Mordor Intelligence | |||
Volatility in Crude-Oil Prices Impacting Mineral-Oil Fluid Costs
Base-oil prices track crude swings. OPEC+ production adjustments ripple through Group II and Group III feedstocks, creating budgeting headaches for end users that rely on large hydraulic fluid inventories. Supply upsets caused by refinery outages or geopolitical tensions can rapidly squeeze margins for blenders who operate under fixed-price supply contracts. Because mineral oil accounts for nearly half of all liters sold, price spikes ripple across the hydraulic fluid market and may prompt short-term demand deferral.
High Cost and Limited Supply of Synthetic and Bio-Based Fluids
Vegetable-oil esters can cost up to three times more than mineral oils, primarily due to tight supply of high-oleic feedstocks and specialized additive packages. Storage stability remains a concern; lab data reveal oxidative degradation after prolonged warehousing, pushing users to shorter change intervals. Performance additives required for extreme-temperature service raise blending costs, limiting uptake to applications where spill risk or fire safety outweighs price sensitivity.
*Our forecasts treat driver/restraint impacts as directional, not additive. The impact forecasts reflect baseline growth, mix effects, and variable interactions.
Segment Analysis
By Base-Oil Type: Bio-Based Innovation Challenges Mineral Dominance
Mineral oils controlled 48.81% of the hydraulic fluid market in 2025, a position underpinned by favorable cost-performance ratios and broad OEM approvals. Bio-based products, while only mid-single-digit share, are forecast to register the quickest 5.03% CAGR as end users pursue sustainability certifications and regulators tighten spill-prevention rules. The hydraulic fluid market size for bio-based grades is expected to widen noticeably in agriculture and marine sectors as biodegradable features align with environmental mandates. Bio-ester oxidation risks once limited adoption, yet modern antioxidant packages now extend fluid life, as shown by Chevron’s Clarity Bio EliteSyn AW launch that uses a renewable synthetic base to tackle sludge formation. Synthetic esters remain entrenched in aerospace flight-control systems where phosphate-ester performance cannot be compromised.
Growth prospects differ across regions. Europe pushes maritime operators toward EU Ecolabel-approved fluids, propelling demand for FUCHS PLANTOHYD series that meets rapid biodegradability criteria. North America focuses on high-performance Group III blends aimed at energy savings. Asia-Pacific blends cost advantage with rising green requirements, so regional blenders balance mineral and vegetable-oil inputs to maintain competitiveness. Despite upward momentum, price differentials will slow wholesale substitution, ensuring mineral oil remains the volume backbone of the hydraulic fluid market through 2031.


By Application: Mobile Systems Drive Growth Despite Electrification
Mobile hydraulic systems held 54.76% of 2025 volume and are projected to climb at a 5.98% CAGR, reflecting brisk construction equipment turnover and an expanding fleet of mechanized farm machinery. In value terms, this segment commands premium margins because OEMs specify tighter cleanliness and oxidation standards to lengthen service intervals. The hydraulic fluid market size for mobile systems could surpass 1.35 billion liters by 2031 if replacement cycles in Asia’s rental fleets stay on course. Electro-hydraulic integration remains a key transition point; Caterpillar’s Cat 651 Scraper pairs electric control with high-pressure pumps, requiring fluids that resist micro-dieseling under dynamic load.
Stationary industrial systems exhibit slower unit growth but stable per-machine consumption. Factory automation, die-casting, and injection-molding machines depend on precise pressure control, so fluid suppliers promote zinc-free anti-wear chemistries to safeguard servo valves. Predictive maintenance projects use in-line sensors to monitor viscosity and contamination, enabling proactive top-ups and longer drains. Hybrid drive concepts may curb aggregate liters in some presses, yet high-force operations such as steel mills will continue to rely on fluid power. Overall, the application mix reinforces the critical role of hydraulics where electric motors alone cannot deliver comparable power density.
By End-User Industry: Heavy Equipment Dominance Faces Diversification
Heavy equipment, spanning earth-moving and mining fleets, contributed 38.26% of total liters in 2025. Large excavators, bulldozers, and dump trucks rely on multiple high-capacity circuits, so they remain the single largest consumer group in the hydraulic fluid market. OEM renewal programs emphasize low-viscosity fluids that can cut idle-time fuel burn and meet Tier 4 final emission rules. Concurrently, “Other End-Industries” such as food processing, marine, and renewable energy display the fastest 5.94% CAGR, underpinned by automation and stringent safety codes. The hydraulic fluid market share for these emerging segments is modest today, yet their double-digit adoption of biodegradable and H1 food-grade fluids lifts unit revenues.
Automotive factories represent a swing sector. Traditional platforms phase out hydro-boost steering and hydraulic brakes, but giga-press investments for EV bodies increase demand for heavy-duty hydraulic presses. Food and beverage plants swap mineral oils for NSF-H1 approved synthetic esters to eliminate contamination risks, opening niche premium opportunities. Rail and marine operators likewise shift toward specialized fire-resistant blends to comply with stricter environmental regulations in coastal zones. The expanding end-industry canvas illustrates how fluid suppliers diversify to insulate against cyclical swings in heavy equipment demand.
Geography Analysis
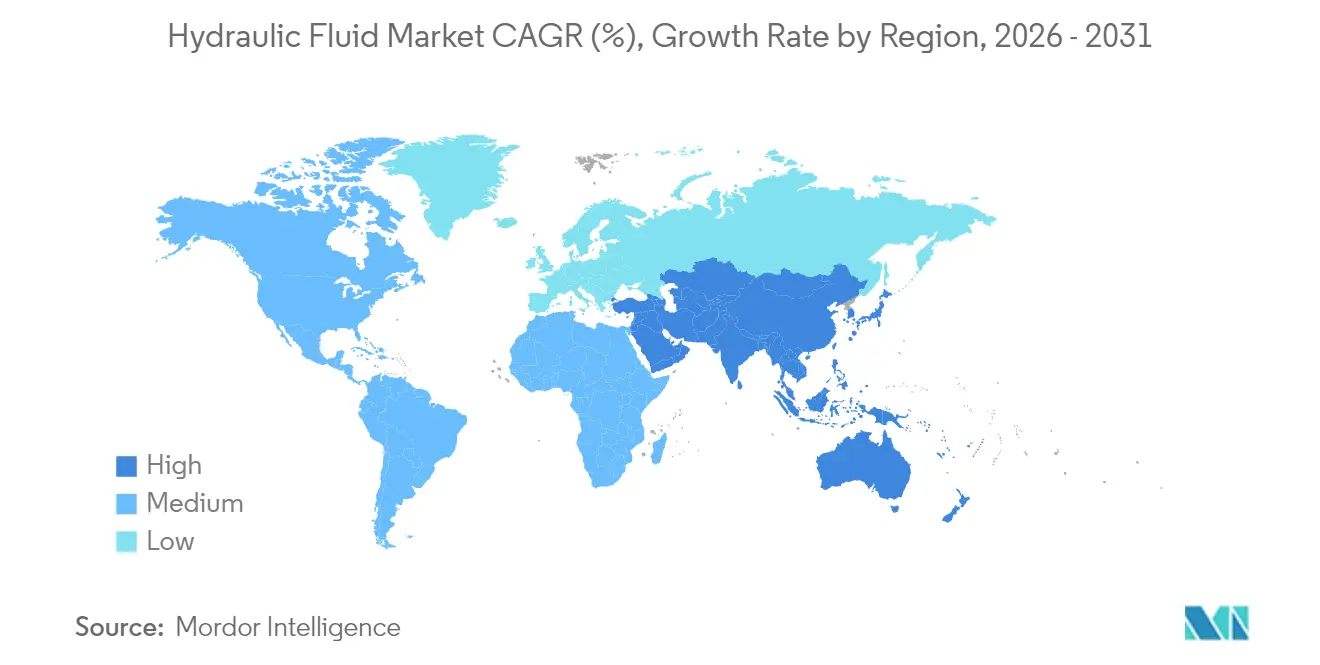
Asia-Pacific remained the epicenter of hydraulic fluid consumption, holding 40.75% of global volume in 2025 and maintaining the quickest 5.36% CAGR outlook. China’s leadership in construction machinery and India’s tractor boom underpin regional dominance. ExxonMobil reinforced its local supply chain by completing the Singapore Resid Upgrade Project in 2025, adding 20,000 barrels per day of EHC 340 MAX basestock that supports broader adoption of high-performance fluids. Kawasaki Heavy Industries doubled hydraulic component capacity in India to service domestic demand and reduce import reliance. Policy-driven infrastructure expansion paired with large-scale agricultural mechanization cements Asia-Pacific’s pre-eminence in the hydraulic fluid market.
North America remains technologically influential despite slower unit growth. The continent leads trials of sensor-integrated fluids that enable predictive analytics, and major blenders like Chevron are debuting renewable base oils to align with ESG targets. Manufacturing reshoring sparks incremental lubrication demand for machine tools and robotic cells, partially offsetting losses from electric-only light vehicles that use fewer hydraulic components. Canada’s co-hosting role at Hannover Messe 2025 spotlights cross-border initiatives around clean technologies requiring specialty fluids. Europe prioritizes environmental compliance, thus favoring biodegradable formulations in forestry, offshore, and civil-works projects. Germany’s advanced forging and die-casting hubs rely on premium zinc-free blends that withstand ultra-high pressures. France and Italy, both strong in aerospace, drive demand for fire-resistant phosphate-esters. Meanwhile, South America and the Middle East & Africa, though smaller today, show high upside as mining ventures accelerate and governments commit to road and rail corridors. Local supply chains remain underdeveloped, so imports dominate, making currency fluctuations a strategic concern for purchasers in these regions. Overall, geography-specific drivers add nuance to the global hydraulic fluid market growth narrative, yet the common denominator across continents is the indispensable role of fluid power in heavy-duty tasks.

Value Chain Analysis
Hydraulic fluid value creation starts upstream with feedstocks for mineral and synthetic base oils (crude-derived vacuum gas oil and specialty chemical intermediates), followed by base oil production (Group I/II/III and synthetics) and additive manufacturing (anti-wear, oxidation inhibitors, viscosity modifiers, corrosion inhibitors, and demulsifiers). Formulators and blenders combine base stocks and additive packages into OEM- and application-specific grades (including biodegradable esters and fire-resistant fluids), then validate performance through lab and field testing to meet key hydraulic system requirements such as wear protection, filterability, and oxidation stability.
Downstream, distribution runs through direct industrial accounts, equipment OEM and dealer networks, lubricant distributors, and aftermarket service providers that bundle fluids with maintenance programs, condition monitoring, and filtration services. The chain is sensitive to base oil availability and logistics disruptions, so major integrated suppliers leverage captive basestock and regional hubs (for example, ExxonMobil basestocks supply from Singapore and the United States, and Luberef base oil production in Saudi Arabia) to support consistent quality and lead times for high-volume hydraulic grades.
Competitive Landscape
The hydraulic fluids market exhibits moderate fragmentation. BP’s recent strategic review of its Castrol business hints at portfolio realignment that could reshape competitive dynamics. ExxonMobil, Chevron, and TotalEnergies round out the top tier by coupling base-oil self-sufficiency with co-engineered OEM approvals, while regional champions such as FUCHS, Sinopec, and CNPC focus on localized blends that match specific climate and duty-cycle conditions.
Product differentiation gravitates toward sustainability and performance. TotalEnergies’ water-based lubricant for EV cooling loops stands out as a radical chemistry pivot addressing electrical conductivity limits in next-generation factories. FUCHS advances its PLANTOHYD biodegradable range to satisfy stricter European spill regulations. Digitalization provides a secondary competitive lever: suppliers embed condition-monitoring sensors into fill ports, bundling data dashboards with fluid contracts to lock in customer loyalty. Such service-based models raise switching costs and blur the line between product and after-sales analytics.
Hydraulic Fluid Industry Leaders
Chevron Corporation
Exxon Mobil Corporation
BP p.l.c
Shell plc
TotalEnergies
- *Disclaimer: Major Players sorted in no particular order


Market Opportunities and Future Outlook
White-space is concentrated in formulations that simultaneously address spill-risk compliance and energy efficiency in hydraulic systems, where end users seek lower traction losses without sacrificing wear protection and cleanliness. Demand pull is visible in sectors that already specify higher-performance fluids, including MSHA-driven fire-resistant applications in mining and phosphate-ester use cases in aerospace, alongside OEM and operator interest in low-viscosity, high-shear-stability fluids for energy-efficient hydraulics.
Supply-side moves also create room for faster adoption of specialty fluids in regions that historically relied on imports. In July 2026, LANXESS started local production of Reolube phosphate ester-based fire-resistant hydraulic fluids at its Jhagadia facility in India to serve the India, Middle East, and Africa region, improving availability for high-safety applications where water-glycol and phosphate-ester fluids are specified. On the technology front, synthetic ester development and third-party validation activities (such as VBASE Oil Company publishing testing on secondary polyol ester technology in February 2026) reinforce a pathway for premium hydraulic fluids positioned around measurable efficiency and stability performance, supporting upgrades in industrial and mobile fleets that are modernizing equipment and maintenance practices.
Recent Industry Developments
- April 2026: Shell updated specifications for its Shell Fire-Resistant Hydraulic Fluid S1 DU on its official industrial lubricants platform. The update supports procurement and compliance requirements for users operating in higher fire-risk environments such as metalworking, mining, and tunneling, where documentation and product conformity are key to maintenance planning.
- February 2025: BP announced a strategic review of its global Castrol lubricants business. The move signaled portfolio optimization in industrial lubricants, an area that includes hydraulic fluids, and it set up potential changes in investment focus, product prioritization, or asset alignment across the sector.
- September 2024: Chevron introduced Clarity Bio EliteSyn AW, positioning the product for marine and construction applications where biodegradable performance is valued. The launch broadened options for operators balancing environmental requirements with hydraulic protection needs in spill-sensitive settings.


Research Methodology Framework and Report Scope
Market Definition and Coverage
This market covers hydraulic fluids used as the working medium in hydraulic systems across industrial and mobile equipment. The estimate is based on field hydraulic fluid consumption and the refill demand tied to service and maintenance activity, tracked by where hydraulic systems operate and where refilling occurs.
Scope exclusions: Excludes adjacent lubricants that are not used for power transmission in hydraulic systems, such as engine oils, greases, and most gear oils.
Segmentation Overview
- By Base-Oil Type
- Mineral Oil
- Synthetic Oil
- Semi-Synthetic Oil
- Bio-based Oil
- Fire-Resistant (Phosphate-ester, Water-glycol)
- By Application
- Mobile Hydraulic Systems
- Industrial/Stationary Hydraulic Systems
- By End-user Industry
- Automotive
- Other Transportation
- Heavy Equipment
- Food and Beverage
- Other End-user Industries (Construction, Power Generation and Utilities, Agriculture, etc.)
- By Geography
- Asia-Pacific
- China
- India
- Japan
- South Korea
- Rest of Asia-Pacific
- North America
- United States
- Canada
- Mexico
- Europe
- Germany
- United Kingdom
- Italy
- France
- Rest of Europe
- South America
- Brazil
- Argentina
- Rest of South America
- Middle East and Africa
- Saudi Arabia
- South Africa
- Rest of Middle East and Africa
- Asia-Pacific
Data Sources, Market Sizing, and Validation
Desk Research
Desk research starts with public datasets that help map where hydraulic equipment is used and how fluid demand typically tracks activity levels. We refer to sources such as the U.S. Energy Information Administration for base oil and feedstock indicators, the U.S. Geological Survey for mining activity context, Eurostat and UN Comtrade for trade flows of lubricating preparations, and OSHA for safety and usage context around industrial fluids.
We also review company filings and investor presentations from fluid and lubricant suppliers, along with press releases, distributor catalogs, and trade association publications that discuss fluid standards and change intervals. In a few places, we supplement with paid subscriptions for company financials, news and financials, patent databases, and an import and export shipment-level database to cross-check directional trends. These are illustrative sources only, and other public references were used for data collection, validation, and clarification.
Primary Interviews and Surveys
Primary work is used to anchor the model in purchase behavior, especially around drain intervals, refill rates, and how demand varies between mobile equipment and factory hydraulics. We spoke with a mix of fluid manufacturers, additive and base oil participants, distributors, and large end users, then reconciled the inputs across APAC, EMEA, and the Americas so the final view does not over-represent one region.
Distribution of primary research fieldwork respondents
| Company type | Respondent position | Region |
|---|---|---|
| Top tier: 29% | CXOs: 14% | APAC: 47% |
| Mid tier: 57% | Functional/Unit leaders: 29% | EMEA: 34% |
| Smaller Players: 14% | Managers: 57% | Americas: 19% |
Market-Sizing & Forecasting
Sizing combines top-down and bottom-up logic. The top-down view reconstructs demand from the installed base of hydraulic equipment and typical fluid consumption per unit, then we stress-test totals with selective supplier and channel checks. Before finalizing the aggregate, we adjust for differences in operating intensity and service practices that show up across industries.
Key inputs include equipment operating hours in construction and mining, replacement and drain interval patterns, the share of hydraulic systems using mineral versus synthetic formulations, average refill volumes per maintenance event, and the impact of environmental rules that increase demand for certain biodegradable or fire-resistant use cases. Forecasts are primarily run through scenario analysis, where the drivers above are moved within realistic ranges and then aligned to what interviewees expect for fleet activity, maintenance spending, and fluid upgrade rates. When bottom-up pieces are incomplete in smaller countries or niche end uses, we fill gaps using comparable equipment density and service cadence proxies, and then we re-check against trade and production signals.
Data Validation & Update Cycle
Validation checks the modeled liters against independent signals such as lubricant trade flows, base oil availability trends, and the direction of equipment production and utilization. We review outliers at the segment and country level, and when a number appears inconsistent with a known industry shift, we re-check assumptions and re-contact sources to confirm what changed.
Each dataset and calculation step goes through more than one analyst review before sign-off so calculation errors and mismatched units are caught early. Reports are refreshed annually, with interim updates when material events affect feedstock pricing, regulations, or equipment demand. Before delivery, we run a final pass to ensure the latest public indicators and interview feedback are reflected in the model.
Mordor Intelligence's Hydraulic Fluid Market Size Measured Against Other Published Estimates
Published market sizes for hydraulic fluids often do not match because the scope is drawn in different ways, and because the unit of measurement is not consistent across reports. Differences also show up in how refill demand is treated, how quickly price or formulation changes are updated, and whether the estimate ties back to equipment activity signals.
Engine and driveline lubricants sit outside Mordor Intelligence's hydraulic fluid scope, which keeps the total anchored to fluids used for hydraulic power transmission rather than the wider lubricant pool some publications include. Differences also show up when one estimate reports value in USD and another reports volume in liters, or when aggressive assumptions are made on synthetic mix shift and drain interval tightening without field validation.
Benchmark comparison
| Source | Market Size | Gaps in Research Methodology |
|---|---|---|
| Mordor Intelligence | USD 1.76 B (2025) | |
| Trade Journal A | USD 8.70 B (2024) | Uses a value-based view that appears to include broader hydraulic lubricants sold alongside nearby lubricant categories, and the stated segmentation emphasizes mobile equipment and point of sale, which can pull in adjacent fluid spend. |
| Global Publisher B | USD 18.26 B (2024) | Presents a revenue total that likely reflects a wider fluid set and different counting rules across types and applications, and it is not clear how unit conversions and country coverage align to a liters-based demand pool. |
The table shows that most of the spread is explained by unit choice and what gets counted as part of hydraulic fluid demand versus broader lubricant spending. Our model stays traceable because the liters build links back to equipment usage and maintenance cadence, and then the implied value is treated as a translation layer rather than the starting point.


Key Questions Answered in the Report
How big is the Hydraulic Fluid Market?
The Hydraulic Fluid Market size is expected to reach 1.84 billion liters in 2026 and grow at a CAGR of 4.32% to reach 2.27 billion liters by 2031.
What is the current Hydraulic Fluid Market size?
In 2026, the Hydraulic Fluid Market size is expected to reach 1.84 billion liters.
How is machinery electrification influencing hydraulic fluid consumption?
Electrification trims fluid volumes in some mobile equipment, yet high-force tasks still require hydraulics, keeping demand resilient.
Which is the fastest growing region in Hydraulic Fluid Market?
Asia-Pacific is estimated to grow at the highest CAGR over the forecast period (2026-2031).
Page last updated on:


 Your data is secure and never sold or shared.


