
Market Overview
| Study Period | 2020 - 2031 |
|---|---|
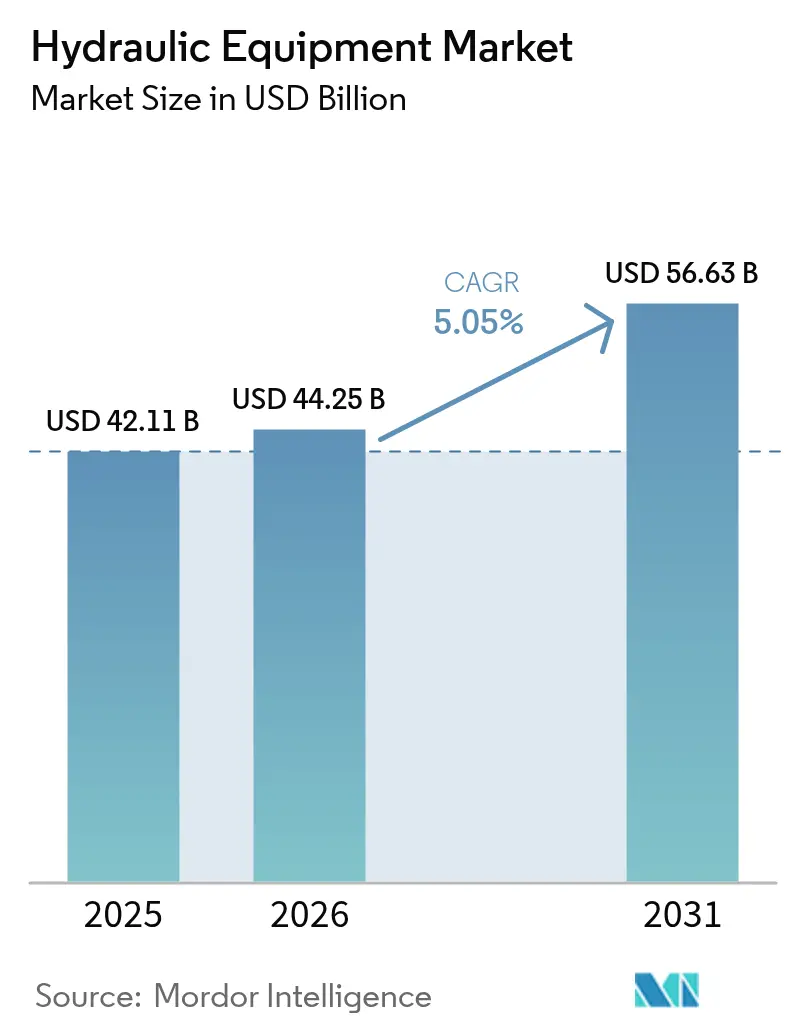
| Market Size (2026) | USD 44.25 Billion |
| Market Size (2031) | USD 56.63 Billion |
| Growth Rate (2026 - 2031) | 5.05% CAGR |
| Fastest Growing Market | Asia Pacific |
| Largest Market | North America |
| Market Concentration | Medium |
Major Players
*Disclaimer: Major Players sorted in no particular order Image © Mordor Intelligence. Reuse requires attribution under CC BY 4.0. |
|
Hydraulic Equipment Market Analysis by Mordor Intelligence
The hydraulic equipment market size was valued at USD 42.11 billion in 2025 and estimated to grow from USD 44.25 billion in 2026 to reach USD 56.63 billion by 2031, at a CAGR of 5.05% during the forecast period (2026-2031). This steady momentum underscores the sector’s resilience in the face of cyclical slowdowns, raw material volatility, and intensifying pressures from electrification. Robust public infrastructure spending in the United States and China, rising warehouse automation in global e-commerce, and expanding precision agriculture underpin demand, even as equipment makers accelerate the shift toward energy-efficient electro-hydraulic hybrids. Heightened consolidation, exemplified by Applied Industrial Technologies' acquisition of Hydradyne, signals how suppliers are responding to margin compression and the need for digital, power-dense solutions. North America remains the largest regional base, supported by unprecedented water infrastructure appropriations, while the Asia-Pacific records the fastest gains as China and India commit multi-trillion-dollar stimulus to transport and urban services.
Key Report Takeaways
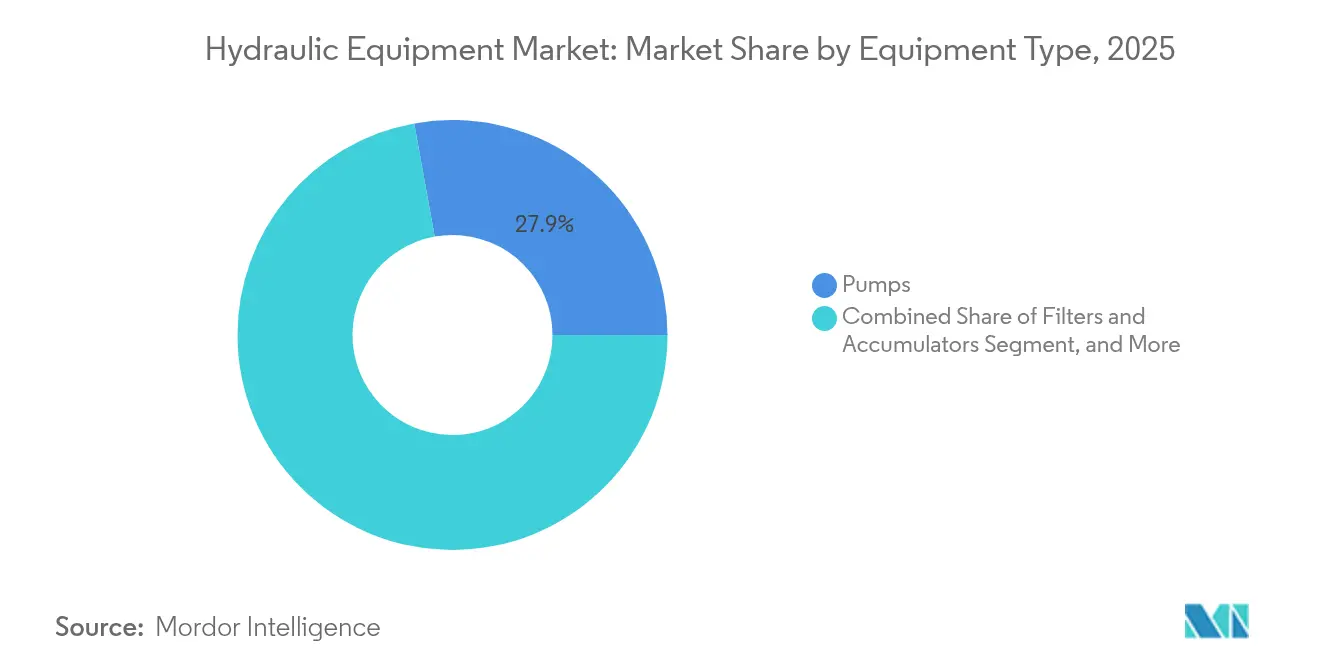
- By equipment type, pumps led with 27.85% of hydraulic equipment market share in 2025; filters and accumulators are projected to grow at a 6.18% CAGR through 2031.
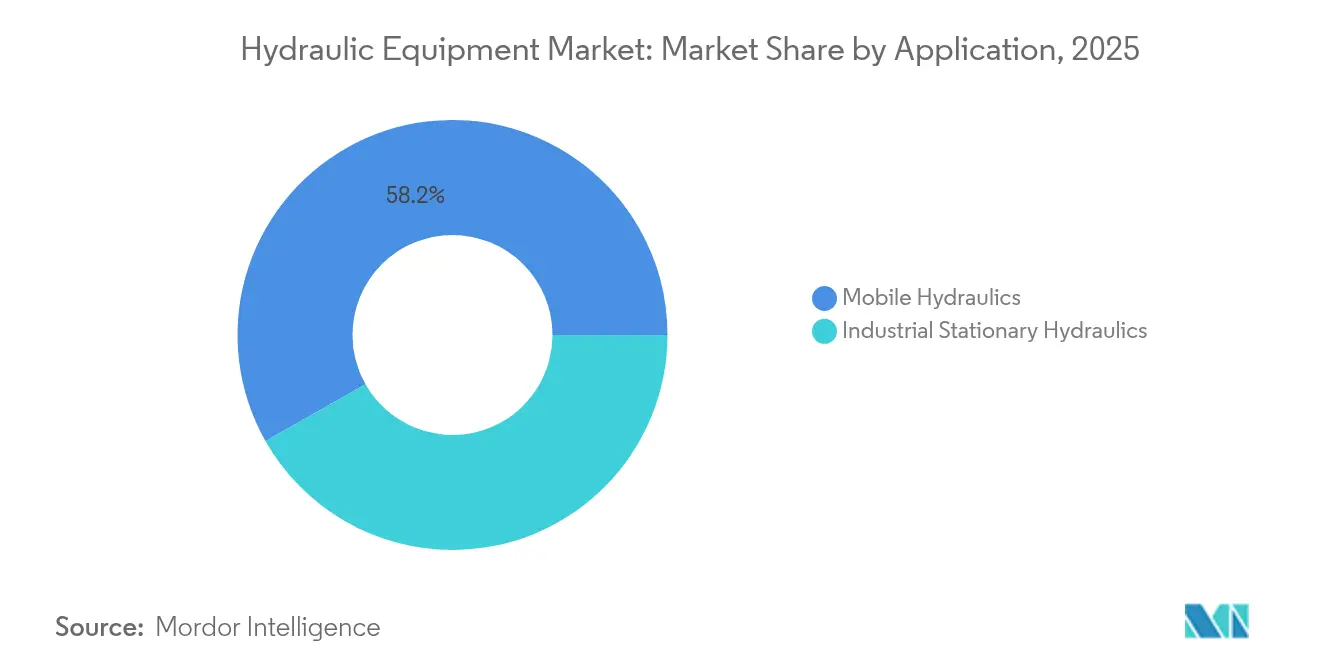
- By application, mobile hydraulics captured 58.20% revenue in 2025 and is advancing at an 7.72% CAGR to 2031.
- By end-user, construction dominated with 31.05% contribution in 2025; aerospace and defense is forecast to expand at a 6.35% CAGR to 2031.
- By operating-pressure range, medium-pressure systems held 42.35% of the hydraulic equipment market size in 2025, while high-pressure systems are projected to post a 7.29% CAGR through 2031.
- By geography, North America retained 37.65% share in 2025; Asia-Pacific is set to register an 8.07% CAGR and deliver the fastest regional growth to 2031.
Note: Market size and forecast figures in this report are generated using Mordor Intelligence’s proprietary estimation framework, updated with the latest available data and insights as of 2026.
Global Hydraulic Equipment Market Trends and Insights
Drivers Impact Analysis*
| Driver | (~) % Impact on CAGR Forecast | Geographic Relevance | Impact Timeline |
|---|---|---|---|
| Accelerated warehouse automation in e-commerce fulfillment | +1.20% | Global, with concentration in North America and Europe | Medium term (2-4 years) |
| Government-funded mega infrastructure programmes | +1.80% | North America, Asia-Pacific core, spill-over to Europe | Long term (≥ 4 years) |
| Shift to energy-efficient electro-hydraulic hybrids | +0.90% | Global, early adoption in Europe and North America | Long term (≥ 4 years) |
| Increasing off-highway electrification driving compact power-dense hydraulics | +0.70% | North America and Europe, expanding to Asia-Pacific | Medium term (2-4 years) |
| Growing adoption of precision agriculture machinery | +0.60% | Global, with early gains in North America, Brazil, India | Medium term (2-4 years) |
| Ageing industrial machinery replacement cycle in OECD | +0.50% | North America and Europe | Short term (≤ 2 years) |
| Source: Mordor Intelligence | |||
Accelerated Warehouse Automation in E-commerce Fulfillment
Explosive e-commerce order volumes compel distribution centers to deploy autonomous forklifts, shuttle systems, and goods-to-person robots that rely on compact servo-hydraulic cylinders for milli-meter accuracy. Amazon’s network of mobile robots illustrates how 24/7 operation requires leak-free, sensor-equipped hydraulics offering predictive failure alerts to minimize downtime.[1]Logistics Management Editors, “Autonomous Forklift Market to Reach USD 12.45 Billion by 2034,” LOGISTICSMGMT.COM Warehouse operators typically report 40% productivity gains, enabling component suppliers to charge premium prices for ultra-reliable, contamination-controlled assemblies.
Government-Funded Mega-Infrastructure Programmes
Multi-year public works—from the USD 1.2 trillion U.S. Infrastructure Investment and Jobs Act to China’s USD 1.4 trillion local-government debt plan—create demand visibility for excavators, concrete pumps, and large-bore cylinders.[2]Reuters Staff, “China Approves USD 1.4 Trillion Debt Package for Local Governments,” REUTERS.COM Extended project pipelines allow OEMs to lock-in long-term contracts, expand regional service hubs, and co-develop application-specific hydraulics for bridge, port, and renewable-energy construction.
Shift to Energy-Efficient Electro-Hydraulic Hybrids
Electro-hydrostatic actuators from Bosch Rexroth demonstrate up to 30% energy savings while retaining the power density vital for mobile machinery.[3]Bosch Rexroth AG, “Electro-Hydraulic Actuators Deliver 30% Energy Savings,” BOSCHREXROTH.COM Hybrid circuits recuperate braking energy and slash idle losses, helping equipment makers meet Stage V and Tier 4f emissions limits without sacrificing rapid response or lifting capacity.
Increasing Off-Highway Electrification
OEMs electrifying compact loaders and aerial work platforms increasingly specify high-pressure micro-hydraulic pumps that deliver identical force from smaller battery packs. Component miniaturization eases packaging constraints in zero-emission drivetrains, while silent operation and instant torque improve operator comfort, raising adoption in Europe’s low-emission job sites.
Restraints Impact Analysis*
| Restraint | (~) % Impact on CAGR Forecast | Geographic Relevance | Impact Timeline |
|---|---|---|---|
| Total cost of ownership higher than electric drives in light-duty ranges | -1.10% | Global, most pronounced in Europe and North America | Medium term (2-4 years) |
| Intensifying raw-material price volatility for steel and rare earths | -0.80% | Global, with acute impact in Asia-Pacific manufacturing | Short term (≤ 2 years) |
| Rising ESG scrutiny over hydraulic-fluid leakage | -0.60% | Europe and North America, expanding globally | Long term (≥ 4 years) |
| Skilled-labour shortage for maintenance and retrofits | -0.40% | OECD countries, emerging in Asia-Pacific | Medium term (2-4 years) |
| Source: Mordor Intelligence | |||
Intensifying Raw-Material Price Volatility for Steel and Rare Earths
Steel prices swung 40% in 2024, while China’s dominance of rare-earth processing exposes magnet-motor supply chains to geopolitical risk.[4]U.S. Geological Survey, “Critical Minerals List 2024,” USGS.GOV Tariffs of 44–54% on Chinese hydraulic components further compress margins, forcing suppliers to hedge commodities, redesign to reduce material intensity, or pursue scale through mergers.
Skilled-Labor Shortage for Maintenance and Retrofits
NFPA surveys indicate that 35% of fluid-power technicians will retire within the next decade, while training pipelines struggle to meet demand.[5]National Fluid Power Association, “Workforce Development Survey 2024,” NFPA.COM Shortfalls prolong downtime on high-pressure systems, inflate service contracts, and drive some fleet operators to delay upgrades, throttling replacement sales.
*Our forecasts treat driver/restraint impacts as directional, not additive. The impact forecasts reflect baseline growth, mix effects, and variable interactions.
Segment Analysis
By Equipment Type: Pumps Retain Primacy, Filters Accelerate
Pumps anchored 27.85% of the hydraulic equipment market in 2025 as the indispensable power-source across construction, agriculture, and industrial machinery. Variable-displacement and load-sensing models cut fuel draw, satisfying OEM efficiency targets and boosting aftermarket retrofit sales. The hydraulic equipment market size for pumps is positioned to advance with infrastructure investment cycles through 2031. Filters and accumulators log the quickest gains at a 6.18% CAGR as stricter ISO 4406 cleanliness codes make contamination control decisive during warranty negotiations. Demand for high-flow, low-delta-pressure filter media elevates margins, while nitrogen-charged bladders store regenerative energy in hybrid circuits, extending the hydraulic equipment market share of this sub-segment across mobile applications.
Valve suppliers capitalize on precision flow control required by tele-operation and autonomous tasks. Cylinders benefit from e-commerce warehouse robotics that necessitate repeatable, high-cycle linear motion. Motors and transmissions cater to specialty mobile equipment where torque density and overload capacity remain critical. Ancillary components—reservoirs, manifolds, coolers—gain from integrated power-packs that simplify OEM assembly lines and shorten time-to-market.


By End-User Industry: Construction Dominates, Aerospace Accelerates
Construction contributed 31.05% of hydraulic equipment market revenue in 2025, buoyed by global public-works pipelines and commercial real-estate starts. Fleet operators adopt electro-hydraulic hybrids to meet stricter job-site emissions caps, sustaining high utilization and parts consumption. The hydraulic equipment market size for construction is poised for stable mid-single-digit growth as bridge, port, and rail projects consume long-stroke actuators and heavy-duty pumps over multi-year timelines. Aerospace and defense, however, posts the sharpest trajectory at 6.35% CAGR as commercial narrow-body production ramps and defense agencies modernize airframes. High-pressure, weight-optimized actuation for flight-control and landing-gear commands premium pricing, increasing the hydraulic equipment market share captured by aerospace suppliers.
Agriculture maintains steady gains as precision farming embeds GPS-guided hydraulics for centimeter-level seed placement. Material-handling thrives on omnichannel retail logistics, while oil and gas demand stabilizes around offshore construction and pipeline maintenance. Machine-tool, plastics, and automotive segments experience mixed trends tied to global manufacturing cycles yet remain indispensable volume anchors for seal, valve, and small-bore cylinder demand.
By Application: Mobile Hydraulics Expands Rapidly
Mobile hydraulics held 58.20% revenue in 2025 and is expected to achieve the segment’s highest 7.72% CAGR to 2031. Equipment replacements in North America and capacity additions in Asia amplify shipments of swing drives, travel motors, and load-sensing pumps. The push toward electro-hydraulic hybrids positions suppliers with advanced energy-recovery valves to gain disproportionate share. The hydraulic equipment market size for the mobile segment widens as regulatory credits reward CO₂-saving systems. Stationary industrial hydraulics remains a mature but essential base, with servo-valves and proportional pumps supporting precision metal-forming and injection-molding processes.
By Operating-Pressure Range: High-Pressure Systems Gain Momentum
Medium-pressure architectures (150–350 bar) comprised 42.35% of 2025 revenue, prized for balanced cost-performance in mainstream excavators and presses. High-pressure (>350 bar) solutions, however, exhibit a 7.29% CAGR as aerospace, tunneling, and exo-skeleton robotics require compact, power-dense packages. Material advances in chrome-plated rods and high-temperature seals prove critical for endurance. Low-pressure (<150 bar) markets remain price-sensitive and face substitution risk from all-electric actuators in lightweight tasks.
Geography Analysis
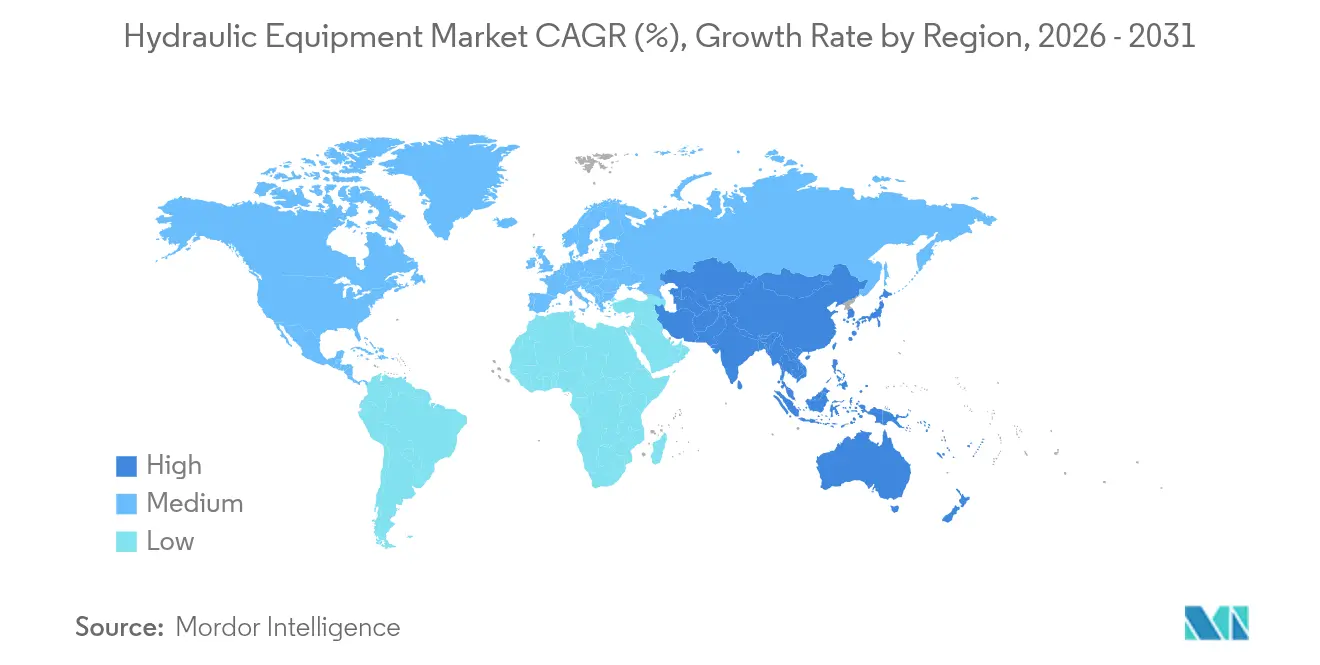
North America generated 37.65% of global revenue in 2025, supported by USD 68.8 billion in obligated water-infrastructure funds and USD 850 million dedicated to reclamation projects. Robust warehouse-automation investments and aging fleet replacements underpin sales of cylinders, proportional valves, and filtration kits. Nevertheless, the softness of transport equipment presents a headwind, prompting suppliers to emphasize aftermarket service contracts and digitalized maintenance offers.
The Asia-Pacific region registers the fastest growth, with an 8.07% CAGR through 2031, as China’s USD 1.4 trillion credit package and India’s urban-rail and water-supply programs sustain demand peaks beyond domestic cycles. Local OEMs partner with component specialists to meet Tier 4f standards, while tariff disputes prompt multinational suppliers to diversify assembly footprints into Southeast Asia. High-pressure micro-pumps and contamination-resistant valves are seeing a rising take-up in Korean and Japanese precision-manufacturing clusters.
Europe presents a mixed outlook: German fluid-power orders fell 8% in 2024, yet projects such as France’s Grand Paris Express and Italy’s wind-farm builds drive niche high-pressure requirements. PFAS restrictions are accelerating the shift to bio-based seals, prompting significant R&D investment across the hydraulic equipment market. The REPowerEU plan’s EUR 300 billion (USD 339 billion) allocation for renewable energy infrastructure multiplies demand for telescopic cylinders in offshore wind installation vessels, cushioning macroeconomic softness.

Regulatory Landscape
Safety, conformity, and efficiency requirements are tightening for hydraulic machinery and systems, with the most immediate pressure in Europe. The EU Machinery Regulation (EU) 2023/1230 is moving through its transition window toward application from 20 January 2027, replacing Machinery Directive 2006/42/EC, and directly affecting design, documentation, and conformity assessment for machinery using hydraulic power. In March 2026, the European Commission published Implementing Decision (EU) 2026/546, updating references to harmonised machinery standards across equipment categories that commonly embed hydraulics and raising the bar for manufacturers and importers to keep compliance mapping current.
Standards updates are also affecting product specifications and validation protocols across global supply chains. ISO published ISO 18464:2025, introducing a design methodology aimed at energy-efficient hydraulic systems, and ISO 10767-3:2025 for measuring pressure ripple levels in hydraulic motors, both of which influence OEM qualification and benchmarking. In June 2026, the UK Department for Business and Trade issued a machinery notice that references ISO 4413:2010 (hydraulic fluid power, general rules and safety requirements), underscoring the need for UK-focused conformity planning alongside EU alignment for globally shipped hydraulic equipment.
Competitive Landscape
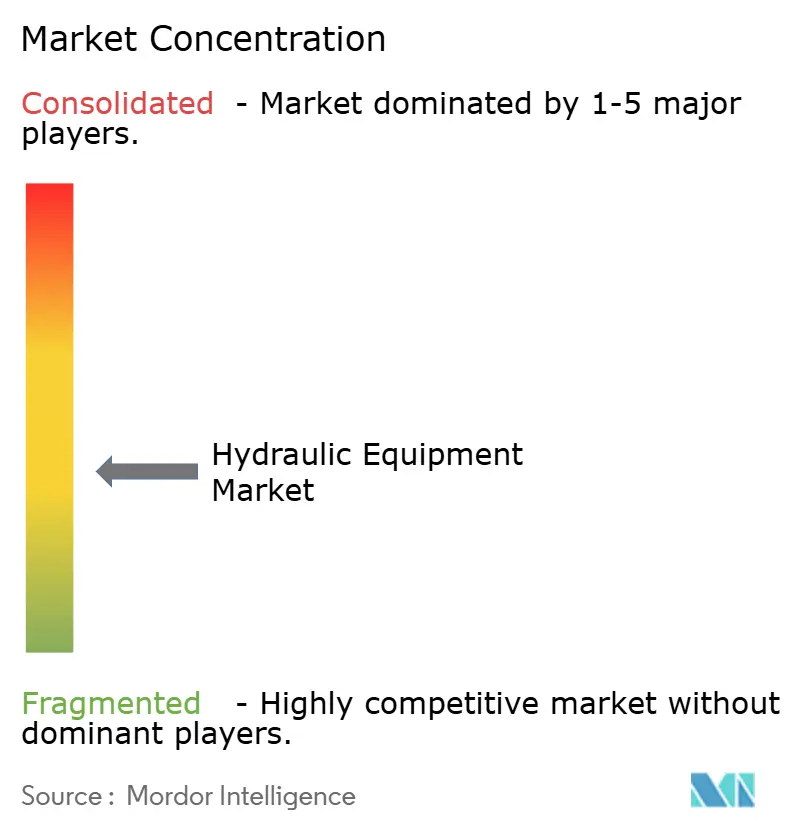
The hydraulic equipment market remains moderately fragmented, yet consolidation is accelerating as suppliers pursue scale and technological depth. Applied Industrial Technologies’ acquisition of Hydradyne (USD 260 million sales) enlarges its service footprint in mobile hydraulics and enhances engineered-systems capabilities. Atlas Copco’s planned USD 218 million acquisition of National Tank & Equipment strengthens its niche in high-pressure filtration and dewatering systems, broadening cross-selling potential in the mining and construction sectors.
Strategic moves pivot on electrification, digital condition monitoring, and ESG compliance. Bosch Rexroth’s integration of HydraForce deepens its mobile-valve stack, enabling differentiated load-sensing architectures for hybrid excavators. Parker Hannifin secures record margins by streamlining its aerospace and filtration portfolios, demonstrating how disciplined inventory and pricing can offset sectoral weakness. Mid-tier players are pursuing IoT-enabled predictive maintenance modules to ease the skilled labor bottleneck and lock in recurring software-as-a-service revenue.
White-space opportunities multiply in autonomous construction, renewable-energy erection, and precision farming. Suppliers able to merge high-pressure capability with energy-harvesting and sensorized analytics stand to capture a premium share as OEMs re-platform equipment around zero-emission mandates. The hydraulic equipment market, therefore, rewards those investing in material science, digital twins, and plug-and-play sub-systems that lower OEM engineering costs and accelerate time-to-compliance.
Hydraulic Equipment Industry Leaders
-
Bosch Rexroth AG
-
Parker Hannifin Corporation
-
Danfoss A/S
-
KYB Corporation
-
Eaton Corporation plc
- *Disclaimer: Major Players sorted in no particular order

Market Opportunities and Future Outlook
System-level integration is creating whitespace for suppliers that can deliver hydraulics as validated subsystems rather than discrete components, particularly in mobile equipment and industrial automation where downtime, leakage, and energy use are under scrutiny. HYDAC introduced its Fluid Architecture Engineering approach at CONEXPO 2026, which emphasizes designing the full fluid environment (tank sizing, deaeration, contamination control, and component interactions). This shift supports higher-value offerings such as integrated power units, cleanliness-managed filtration loops, and engineered manifolds, which can reduce OEM validation effort and lower field failure rates.
Digitalization and sensing add another near-term layer around condition monitoring and predictive maintenance, an area tied to the skilled-labor bottleneck cited by industry bodies. The NFPA 2025 Industrial Technology Roadmap highlights automation as a primary customer driver and prioritizes miniaturized sensors, multifunction wireless pressure/temperature/flow measurement, and predictive algorithms, aligning with demand for sensor-equipped valves, cylinders, and filtration assemblies. Suppliers that package hydraulics with electronics and software into interoperable architectures, such as digital-twin-ready data models and standardized interfaces, can expand recurring aftermarket revenue through diagnostics, fluid health management, and retrofit kits for aging industrial machinery in OECD markets.
Recent Industry Developments
- July 2026: Danfoss signed a definitive agreement to acquire Alfagomma, a hose and fittings manufacturer, to integrate into its Fluid Conveyance division. The move broadens Danfoss coverage of critical fluid-transport components that sit alongside pumps, motors, and valves in mobile and industrial hydraulic systems. Portfolio bundling across conveyance and power components strengthens platform selling and can simplify sourcing for OEMs and distributors.
- June 2026: Parker Hannifin launched the GLFTrolley, a portable hydraulic filtration unit designed to remove free water and contaminants from hydraulic fluids in industrial applications. Point-of-use filtration supports reliability and extends component life in high-duty systems where contamination drives unplanned downtime. The product also reinforces the shift toward maintenance solutions that help plants manage fluid cleanliness with fewer specialized technicians.
- August 2024: Parker Hannifin introduced the T7G Series of truck hydraulic pumps in its Pump and Motor Division Europe, designed to meet the ISO 7653 mounting standard. The vane-pump update targets diesel as well as hybrid, electric, and hydrogen vehicles, aligning truck auxiliaries with evolving powertrains. Standard-compliant mounting and updated drive technology can shorten OEM integration cycles and support retrofit demand in mixed fleets.


Research Methodology Framework and Report Scope
Market Definition and Coverage
For this study, the hydraulic equipment market covers hydraulic power transmission and control hardware that creates, directs, and regulates fluid power in machines, including key components used in mobile and industrial equipment and their replacement demand.
Scope exclusions: Excludes full machines and vehicles that merely contain hydraulic systems, along with stand-alone hydraulic fluids, basic fittings, and general maintenance services.
Segmentation Overview
-
By Equipment Type
- Pumps
- Valves
- Cylinders
- Motors
- Filters and Accumulators
- Transmissions
- Others
-
By End-user Industry
- Construction
- Agriculture
- Material Handling
- Aerospace and Defence
- Machine Tools
- Oil and Gas
- Hydraulic Press
- Plastics
- Automotive
- Other End-users
-
By Application
- Mobile Hydraulics
- Industrial Stationary Hydraulics
-
By Operating-Pressure Range
- Low (Less than 150 bar)
- Medium (150-350 bar)
- High (Greater than 350 bar)
-
By Geography
-
North America
- United States
- Canada
- Mexico
-
South America
- Brazil
- Argentina
- Colombia
- Rest of South America
-
Europe
- United Kingdom
- Germany
- France
- Italy
- Spain
- Rest of Europe
-
Asia-Pacific
- China
- Japan
- South Korea
- India
- Rest of Asia-Pacific
-
Middle East and Africa
-
Middle East
- Saudi Arabia
- United Arab Emirates
- Rest of Middle East
-
Africa
- South Africa
- Egypt
- Rest of Africa
-
Middle East
-
North America
Data Sources, Market Sizing, and Validation
Desk Research
Desk work started by mapping what is counted as hydraulic equipment and where it is consumed most, and then aligning this with public production, trade, and end-market activity indicators. We referenced sources such as US Census Bureau manufacturing and trade tables, UN Comtrade customs statistics, OECD industrial production series, and central bank or national statistics office machinery investment data, which help ground volumes and cycles by region.
To avoid building the model from a single data stream, we also reviewed company annual reports and investor presentations for product mix and demand commentary, along with association websites and reputable press for policy and infrastructure themes. In selected cases, we used paid subscriptions for company financials and intelligence, patent databases for innovation direction, and import or export shipment-level databases to sanity-check directional movement in component flows. These examples are not exhaustive, and many other public sources were also used for data collection, validation, and clarification.
Primary Interviews and Surveys
Primary work focused on validating how hydraulic component demand changes with construction cycles, industrial capex, and replacement patterns, and then testing pricing and mix assumptions with people who see orders and tenders firsthand. We spoke with manufacturers, distributors, system integrators, and large end users across the main consuming regions so gaps from desk estimates could be closed and assumptions could be stress-tested before the final numbers were locked.
Distribution of primary research fieldwork respondents
| Company type | Respondent position | Region |
|---|---|---|
| Top tier: 30% | CXOs: 20% | APAC: 41% |
| Mid tier: 49% | Functional/Unit leaders: 20% | EMEA: 33% |
| Smaller Players: 21% | Managers: 60% | Americas: 26% |
Market-Sizing & Forecasting
Sizing was built using a top-down approach where production, trade, and machinery investment signals were used to reconstruct the addressable demand pool for hydraulic components by region, and then split into major use areas based on consumption patterns shared by industry participants. When the logic was set, the totals were checked through selective bottom-up approximations, such as sampled component ASP multiplied by shipment proxies, channel checks with distributors, and cross-checks against supplier revenue exposure, which are then used to adjust outliers.
Key model inputs included off-highway equipment production trends, construction and infrastructure spending direction, industrial production and machine tool activity, replacement and overhaul intensity in high-duty applications, and component price movement tied to metals and machining costs. Forecasts were run using scenario analysis supported by expert views on cycle timing, and then smoothed where needed to avoid unrealistic step changes. Where country level gaps existed, we filled them using proxy indicators like machinery output and import dependence, before rolling them back to regional totals.
Data Validation & Update Cycle
Outputs were validated by comparing the final market totals with independent signals like equipment production cycles, trade direction, and the implied share of hydraulic content in key end markets. Large variances were investigated through assumption reviews, currency conversion checks, and re-testing of price and mix inputs, followed by multi-step internal analyst review before sign-off.
The study is refreshed on an annual schedule, and interim updates are triggered when material events affect demand or pricing, such as major infrastructure policy shifts or sharp changes in industrial activity. Before delivery, a final fresh pass is completed so the published numbers reflect the latest available data and field feedback.
Mordor Intelligence's Hydraulic Equipment Market Sizing Compared With Other Published Estimates
Published hydraulic equipment market figures often do not match because the scope is not the same, and the year used as the base can also differ. Differences also come from how firms handle pricing, currency timing, and whether replacement demand is treated as a steady layer or is modeled as more cyclical.
The benchmark table shows a wide spread mainly because some estimates push the definition closer to fluid power systems or adjacent spend, and they often anchor on different base years and longer forecast horizons. The table also hints at another driver, which is how mobile versus industrial demand is weighted, since construction cycles can temporarily lift the total when assumptions are aggressive.
Benchmark comparison
| Source | Market Size | Gaps in Research Methodology |
|---|---|---|
| Mordor Intelligence | USD 44.25 B (2026) | |
| Industry Research Publisher A | USD 53.31 B (2025) | Uses a different base year and a broader cut of end uses by component and application, which can lift the starting value versus a 2026 anchor and a tighter component-only accounting. |
| Global Research Publisher B | USD 57.55 B (2024) | Anchors the model in 2024 and applies a higher long-horizon growth path, which can be influenced by optimistic cycle assumptions and limited transparency on how replacement demand and price progression are handled. |
The table points to scope and base-year choices as the main reasons for the gap, and in Mordor Intelligence's model the total is counted as the value of hydraulic components sold into end uses, with 2026 used as the base year and pricing aligned to observed component mix and currency timing. With clear inputs and repeatable checks, users can trace how each assumption moves the total, and then adjust it for their own planning scenarios without rebuilding the whole model.


Key Questions Answered in the Report
How fast is the hydraulic equipment market expected to grow through 2031?
It is forecast to expand from USD 44.25 billion in 2026 to USD 56.63 billion by 2031, marking a 5.05% CAGR driven by infrastructure outlays and mobile-equipment electrification.
What sub-segment leads hydraulic equipment demand?
Pumps dominate with 27.85% revenue share thanks to their indispensable role as the power source in virtually every hydraulic circuit.
Which region offers the highest growth opportunity?
Asia-Pacific posts an 8.07% CAGR through 2031 as China and India unleash multi-trillion-dollar infrastructure and urbanization programs.
Why are electro-hydraulic hybrids gaining traction?
They deliver up to 30% energy savings and help OEMs meet stringent emissions rules while maintaining hydraulic power density.
What is the main restraint facing suppliers today?
Extreme volatility in steel and rare-earth prices compresses margins and complicates long-term pricing agreements.
How are companies addressing the skilled-labor gap in maintenance?
Leading firms embed sensors and develop predictive-maintenance software that reduces service time and broadens the technician talent pool.
Page last updated on:


