
Hyderabad Data Center Market Size and Share
Market Overview
| Study Period | 2020 - 2032 |
|---|---|
| Forecast Data Period | 2026 - 2032 |
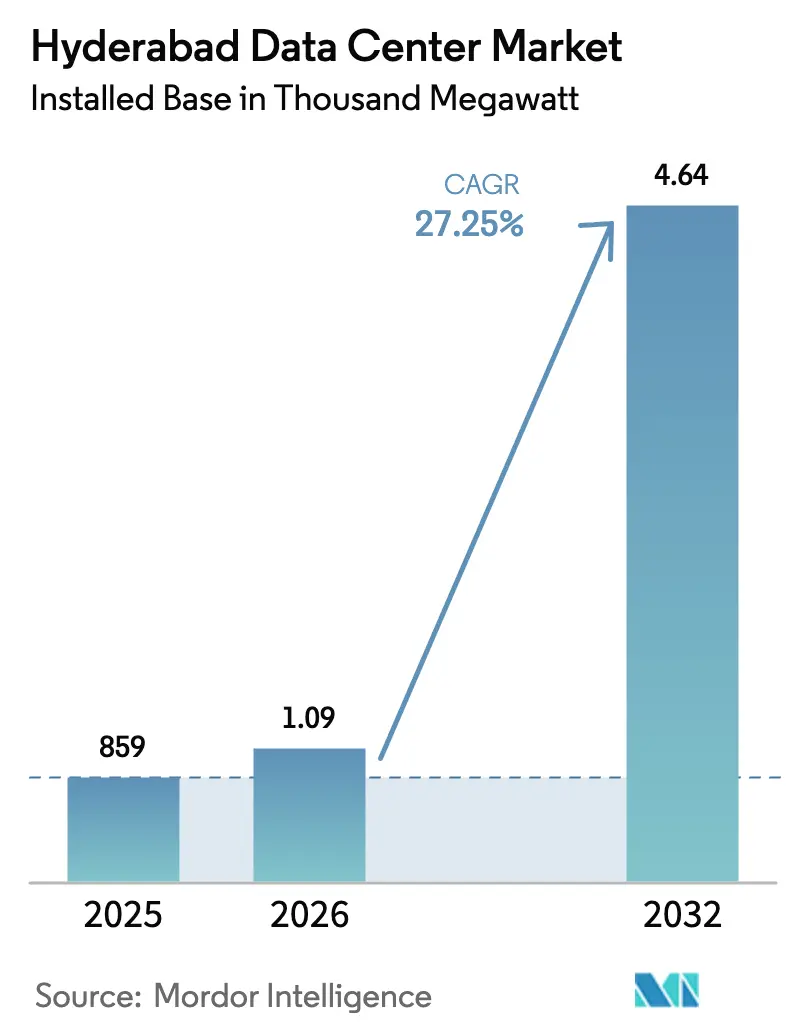
| Base Year Market Size (2025) | 859 Thousand megawatt |
| Market Volume (2026) | 1.09 Thousand megawatt |
| Market Volume (2032) | 4.64 Thousand megawatt |
| Growth Rate (2026 - 2032) | 27.25 % |
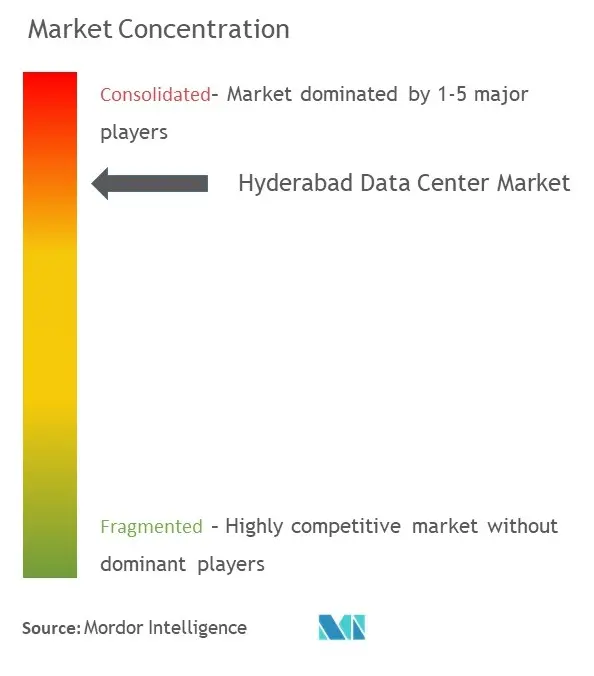
| Market Concentration | Medium |
Major Players *Disclaimer: Major Players sorted in no particular order Image © Mordor Intelligence. Reuse requires attribution under CC BY 4.0. | |
Hyderabad Data Center Market Analysis by Mordor Intelligence
The Hyderabad data center market size is expected to grow from 859 MW of installed IT load in 2025 to 1,093.1 MW of installed IT load in 2026 and is forecast to reach 4,640.8 MW by 2032 at 27.25% CAGR over 2026-2032. Surging hyperscale capital expenditure, Telangana’s single-window incentives, and the Digital Personal Data Protection (DPDP) Act anchor this expansion. Hyperscale operators benefit from land costs that average 40% below Mumbai while enjoying comparable fiber density, a combination that accelerates regionwide capacity planning. Intensifying AI and GPU demand lifts rack power densities to 20–40 kW, steering investment toward liquid-cooled halls and Tier IV redundancy. Meanwhile, 5G backhaul traffic and OTT streaming reinforce edge-node builds that complement hyperscale nodes, sustaining a balanced absorption curve. Execution risks persist around grid reliability and real-estate inflation, but coordinated state subsidies and renewable-power mandates soften these headwinds.
Key Report Takeaways
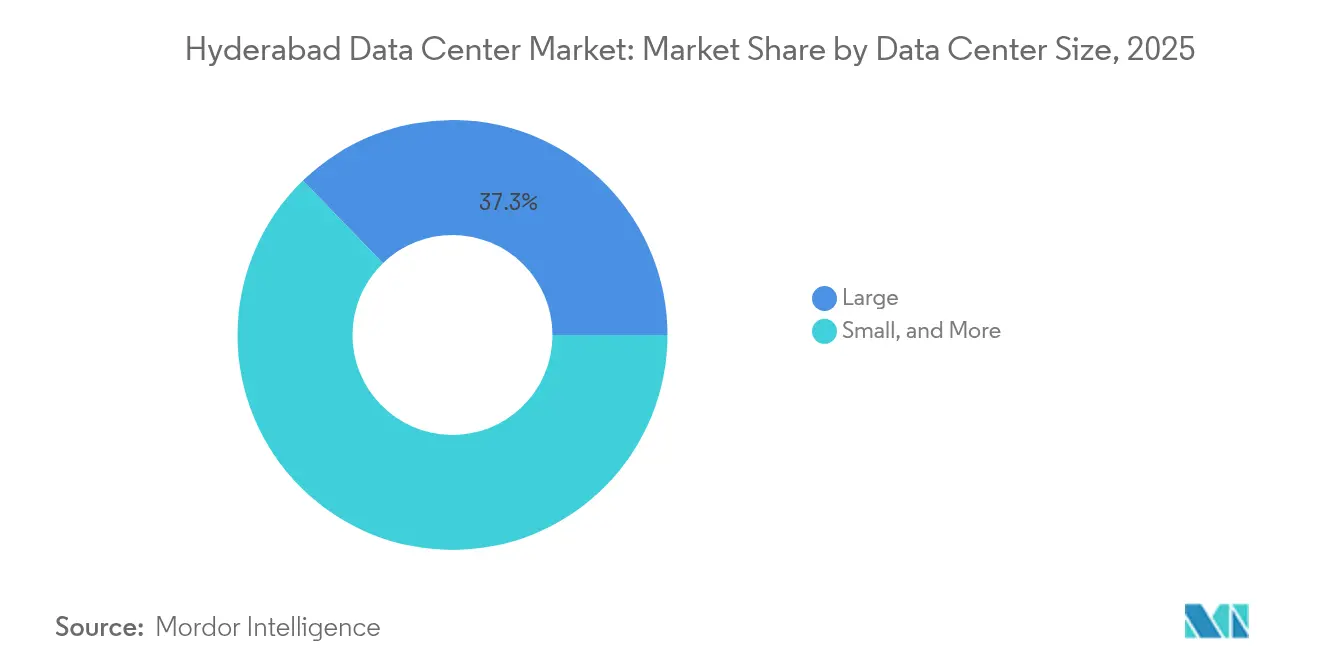
- By data center size, Large facilities held 37.25% of Hyderabad data center market share in 2025, whereas Massive sites are expanding at a 23.07% CAGR through 2032.
- By tier standard, Tier III captured 56.45% revenue share in 2025; Tier IV facilities are forecast to grow at a 20.68% CAGR to 2032.
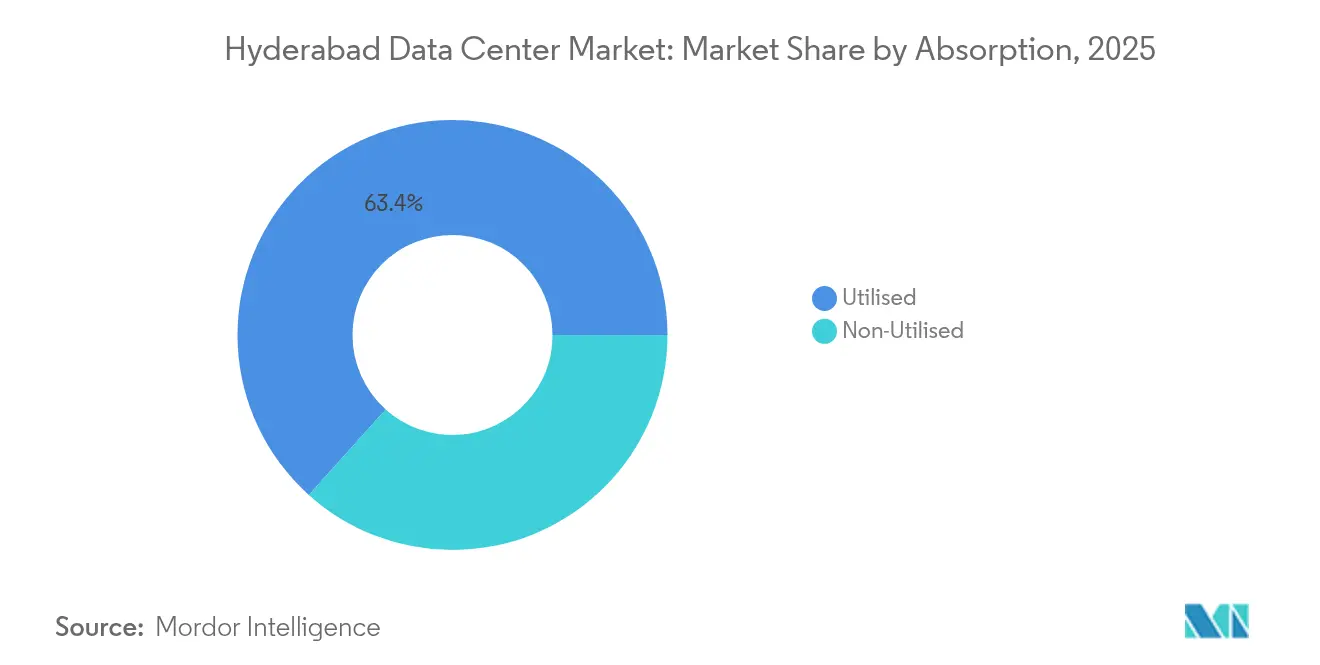
- By absorption, the Utilised category accounted for 63.35% of Hyderabad data center market size in 2025 and is advancing at a 24.41% CAGR through 2032.
Note: Market size and forecast figures in this report are generated using Mordor Intelligence’s proprietary estimation framework, updated with the latest available data and insights as of 2026.
Hyderabad Data Center Market Trends and Insights
Drivers Impact Analysis*
| Driver | (~) % Impact on CAGR Forecast | Geographic Relevance | Impact Timeline |
|---|---|---|---|
| Exploding mobile-data consumption and 5G roll-out | +4.20% | National; Hyderabad, Chennai, Bangalore lead | Medium term (2–4 years) |
| Indian data-localization mandates (DPDP Act) | +3.80% | National; concentrated in metro hubs | Short term (≤2 years) |
| Hyperscale cloud region roll-outs in Hyderabad | +5.10% | Hyderabad-centric; Telangana spillover | Long term (≥4 years) |
| Surge in OTT, gaming and AI workloads | +3.50% | National; Hyderabad as southern hub | Medium term (2–4 years) |
| Single-window clearance and CAPEX subsidies | +2.10% | Telangana specific | Short term (≤2 years) |
| Aerospace and defense R and D corridor demand | +1.50% | Hyderabad aerospace cluster | Long term (≥4 years) |
| Source: Mordor Intelligence | |||
Hyperscale Cloud Region Roll-outs Drive Unprecedented Capacity Expansion
Amazon’s USD 4.4 billion commitment and Microsoft’s six-site blueprint create a gravitational pull that redirects capacity away from saturated Mumbai corridors. Each anchor facility targets >100 MW IT load, catalyzing supplier ecosystems and creating roughly 48,000 direct and indirect jobs yearly [1].Incentives include Telangana’s 10-year power-duty exemptions and fast-track environmental clearances that compress construction timelines by up to six months. Land parcels along the Outer Ring Road (ORR) trade 40% below equivalent plots in Navi Mumbai, lowering per-MW capex even after factoring in redundancy requirements. Network operators respond by extending dark-fiber rings to these greenfield campuses, ensuring sub-2-millisecond latency to Hyderabad’s financial district.
Data Localization Mandates Create Immediate Enterprise Demand
The DPDP Act obliges all entities handling sensitive personal data to localize storage inside India, setting an immediate demand floor [2]. Financial institutions face even stricter Reserve Bank of India norms, prompting Tier IV preference for core banking workloads. Flipkart’s renewable-powered Tier IV build-out in Hyderabad illustrates how compliance spurs higher-spec deployments that fetch premium rack rates. Multinationals serving Indian consumers now factor Hyderabad colocation costs into global data-sovereignty budgets, ensuring consistent absorption even during macro-slowdowns.
Mobile-Data Explosion and 5G Infrastructure Deployment Accelerate Edge Requirements
Average per-capita mobile data usage crossed 25 GB per month in 2025, and 5G traffic is climbing 60% year on year. Airtel Nxtra alone is investing USD 600 million to triple capacity to 400 MW, with Hyderabad hosting a major slice to backhaul 5G traffic. Sub-10 ms latency thresholds for autonomous-vehicle testbeds and industrial IoT lines demand micro-edge pods within 30 km of users. Operators integrate computational-fluid-dynamics-optimized cooling to dissipate the additional heat generated by 5G radios, cutting PUE by 5–7% relative to legacy sites.
AI and Gaming Workloads Drive Premium Tier IV Adoption
CtrlS’s AI-ready campus showcases 400-GPU clusters and immersion-cooled racks that sustain >40 kW per rack while holding PUE below 1.1. Gaming-platform traffic spikes by as much as 300% during tournaments, requiring deterministic latency under 5 ms. Tier IV redundancy eliminates the revenue risk of mid-game outages, justifying 40–50% higher rental yields. Sustainability is central; the campus sources 70% of its power from off-site solar and feeds waste heat into neighboring commercial complexes.
Restraints Impact Analysis*
| Restraint | (~) % Impact on CAGR Forecast | Geographic Relevance | Impact Timeline |
|---|---|---|---|
| Grid-reliability issues and high diesel backup costs | -2.80% | Hyderabad metro and ORR zones | Short term (≤2 years) |
| Escalating real-estate prices in HITEC and Gachibowli | -1.90% | Core IT corridors | Medium term (2–4 years) |
| Delays in fiber RoW approvals across ORR | -1.20% | ORR expansion areas | Medium term (2–4 years) |
| Seasonal water scarcity limiting liquid cooling | -0.80% | Greater Hyderabad | Long term (≥4 years) |
| Source: Mordor Intelligence | |||
Grid Reliability Challenges Elevate Operational Costs
Peak-summer demand forces load-shedding that triggers diesel-genset run-time spikes of 25–30%, inflating OPEX and carbon footprints [3]. Repetitive fluctuations shorten UPS life cycles, risking availability downgrades below Tier III despite design intent. Operators pilot hydrogen-fuel-cell backups that promise 99.999% availability while slashing scope-1 emissions, but commercial viability hinges on the state’s upcoming green-hydrogen incentive scheme.
Real-Estate Cost Inflation Constrains Expansion in Prime Locations
Land in HITEC City now trades at USD 9 million per acre, nearly doubling since 2022, squeezing IRR for anything under 40 MW builds. Microsoft’s purchase of a 48-acre parcel 40 km out signals a shift to peri-urban zones, but longer fiber runs and right-of-way delays can add 3–5 months to go-live schedules. Smaller operators lacking hyperscale balance sheets are forced into joint-venture models or brownfield retrofits.
*Our forecasts treat driver/restraint impacts as directional, not additive. The impact forecasts reflect baseline growth, mix effects, and variable interactions.
Segment Analysis
By Data Center Size: Massive Facilities Lead Next-Generation Deployments
Massive sites—defined as >80 MW IT load—grow at a 23.07% CAGR through 2032, reflecting hyperscalers’ tilt toward campus-style economics. Amazon’s new campus clusters three 100 MW blocks behind a single 400 kV substation, yielding a 12% capex advantage per MW compared with two separate 50 MW sites. Large facilities still hold 37.25% Hyderabad data center market share in 2025, serving mid-sized cloud regions and BFSI outsourcing nodes. Medium and Small halls focus on edge caching and disaster-recovery needs for local enterprises. Immersion cooling at scale lets Massive campuses hit PUE 1.05, reinforcing their long-run cost leadership.
The capex heft of Massive formats elevates entry barriers, shifting bargaining power toward land aggregators and specialized EPC firms. Renewable-power purchase agreements often exceed 300 MW, stimulating state-level solar-park tenders that bundle power and green credits. Because each new Massive hub anchors multiple availability zones, network carriers race to pre-lay high-strand-count fiber rings, ensuring latency parity with Mumbai for pan-India traffic.

By Tier Standard: Tier IV Acceleration Reflects AI Infrastructure Demands
Tier IV footprints exhibit 20.68% CAGR, outpacing Tier III despite the latter’s 56.45% base-year share. GPU training clusters cannot tolerate mid-job resets that wipe multi-day computational cycles, so 99.995% uptime is economically rational. CtrlS’s Tier IV halls demonstrate integrated dual-active power feeds, 2N+1 cooling, and rack densities exceeding 40 kW. Meanwhile, Tier III remains optimal for SaaS and ERP workloads, balancing reliability and cost. Tier II serves backup-tape vaulting and non-critical archiving.
Higher-tier migration introduces a services layer—continuously monitored electrical switchgear, predictive maintenance using digital twins, and ISO 27017 cloud-security frameworks—to which hyperscalers attach premium SLAs. Capital intensity rises 40–50%, but operators partially offset this through green bonds and sustainability-linked loans like AdaniConneX’s USD 1.44 billion raise.
By Absorption: Utilised Segment Dominance Validates Market Fundamentals
With 63.35% 2025 share, the Utilised category validates supply-demand alignment, and is forecast to log 24.41% CAGR by 2032. Hyperscale colocation occupies the lion’s share; AWS and Microsoft pre-commit 15-year leases, derisking developer balance sheets. Retail colocation thrives on SMB digitalization drives, offering 5-kW half-rack plans with burstable bandwidth. Wholesale colocation appeals to SaaS unicorns needing contiguous cages minus the capex burden. BFSI contributes 35% of active white space, underpinned by real-time payment rails and algorithmic-trading nodes.
Utilisation gains are aided by power-contract innovation—pay-as-you-grow clauses align tenant payments with actual draw, improving cash flow for both sides. Developers also integrate on-site 30 MWh battery farms that provide ride-through and peak-shave grid tariffs, enhancing ROI while supporting state renewable targets.
Geography Analysis
Hyderabad sits at the geographic intersection of southern and central India, yielding latency under 30 ms to 60% of the country’s population centers. Telangana’s single-window clearances compress statutory cycles to <30 days, a distinct advantage over Karnataka’s multi-agency sign-offs that can stretch to 90 days. Renewable-energy sourcing is buoyed by the state’s 5 GW solar roadmap, enabling corporate PPAs priced 15% below grid tariffs, a draw for sustainability-focused operators. Regional Ring Road completion, though delayed, will link peripheral land banks to fiber routes, lowering last-mile trenching costs.
Within Hyderabad, HITEC City and Gachibowli remain preferred nodes for latency-critical BFSI tenants, yet land scarcity nudges new builds toward Shamshabad and Yacharam along the ORR. These peri-urban pockets offer 20–30% cheaper parcels but require greater investment in dual-path fiber to maintain sub-2-ms intra-metro latency. International reach is enabled via Mumbai–Hyderabad–Chennai terrestrial super-routes that interconnect to SEA-ME-WE-6 and IAX subsea systems, giving local tenants onward links to Singapore under 60 ms round-trip. Government plans for India’s first data-analytics park in Gachibowli reinforce the cluster’s talent magnet, supporting 10,000 new analytics jobs and deepening enterprise demand.
Hyderabad’s aerospace-defense corridor adds a secure-cloud niche; OEMs and R&D labs require hybrid colocation meeting ITAR-equivalent controls. This demand boosts higher-margin service revenue—zero-trust architectures, air-gapped backup vaults, and tamper-evident racks. The corridor’s requirements ripple into peripheral zones, spurring micro-edge pods at factory floors where inline quality-inspection AI models reside.
Regulatory Landscape
Hyderabad data center development is shaped by national compliance requirements alongside Telangana state enablement. At the national level, the Digital Personal Data Protection (DPDP) Act anchors in-country storage and processing practices for personal data, while sector regulators such as the Reserve Bank of India influence resilience and risk controls for BFSI workloads, which commonly translate into higher-availability expectations and stricter auditability requirements for facility selection.
At the state level, Telangana has positioned data centers as essential services under its Data Centres Policy (2016) and ICT Policy (2021-2026), and paired this with a single-window clearance mechanism to shorten approval cycles. The policy toolkit also supports open access power for renewable sourcing, aligning with Telangana Clean Green Energy Policy 2025. This reinforces the market shift toward PPAs and sustainability-linked financing structures for new campuses across ORR-linked growth zones.
Value Chain Analysis
The Hyderabad data center value chain begins with land aggregation and utilities provisioning in corridor locations such as Fab City, Chandanvelly, and Meerkhanpet, followed by design and EPC execution for Tier III and Tier IV builds that increasingly incorporate liquid/immersion cooling. Power procurement and reliability engineering remain key upstream inputs, with operators combining grid supply, open access renewable procurement, and on-site backup systems to manage availability and cost in a market that is sensitive to summer load-shedding.
In the developer-operator layer, hyperscale and colocation providers turn tenant demand into campus-scale projects and vendor ecosystems. Sify expanding an AI-ready campus in Fab City (targeting a 250 MW build-out) and STT GDC India signing an MoU for a 100 MW+ campus in Meerkhanpet with a USD 404 million investment show how anchor sites pull in electrical equipment, cooling systems, modular components, and specialized O&M services. Downstream, tenants include hyperscalers and enterprises, with financing and sustainability mechanisms becoming more embedded in delivery, as reflected by IFC providing Sify Infinit Spaces Limited a USD 71 million sustainability-linked loan in July 2026 to support data center development.
Competitive Landscape
Market structure is moderately fragmented yet tilting toward consolidation. AWS, Microsoft, and Google wield scale leadership, but local champions CtrlS and Pi Datacenters leverage rapid-build expertise and customer-proximity to defend share. NTT’s USD 1.26 billion AI-focused campus signals rising foreign capital appetite, prompting domestic incumbents to accelerate expansion roadmaps.
Strategic moves highlight this arms race. CtrlS signed a January 2025 MoU with Telangana to streamline land and power allotment, aiming to triple local capacity to 200 MW. AdaniConneX raised a record USD 1.44 billion sustainability-linked loan, earmarking a multi-site pipeline that includes a 50 MW liquid-cooled block in Hyderabad. Aurum Equity Partners’ USD 400 million green campus underscores investor confidence in AI-ready, renewables-heavy builds. Market wide, average rack rates rose 7% year on year despite capacity additions, proving demand depth.
Regulatory complexity and technical specialization erect barriers that limit the viable competitor pool, yet white-space niches—secure government cloud, AI test clusters, 5G edge nodes—enable smaller innovators to prosper without head-to-head price wars. Partnerships—carrier-neutral IX points, renewable-energy aggregators, and modular-build specialists—emerge as critical levers for accelerated go-live schedules and differentiated SLAs.
Hyderabad Data Center Industry Leaders
-
Sify Technologies Limited
-
STT Telemedia
-
Reliance industries
-
CtrlS
-
Nxtra Data Limited
- *Disclaimer: Major Players sorted in no particular order
Market Opportunities and Future Outlook
Large land-bank development tied to Telangana-led infrastructure programs creates room for campus-scale builds outside saturated inner-city corridors. Public reporting in 2026 pointed to a state push toward a dedicated, large-format development model, including plans for a 1,500-acre data center city near Chevella (around 55 km from Hyderabad), alongside cluster growth in Bharat Future City, Chandanvelly, and Fab City. These locations are framed for high-power, multi-building deployments.
AI-ready capacity and high-density retrofits form a second opportunity lane, with operators and investors tying underwriting to AI compute needs. The market evidence includes Sify advancing an AI-ready Hyderabad campus build-out and CtrlS outlining large investment plans in 2026 for AI-ready clusters at Chandanvelly and Meerkhanpet, alongside hyperscale commitments such as Amazon laying a foundation stone for a significant project in Bharat Future City. Together, these plans pull through demand for liquid-cooled halls, high-capacity substations, carrier-neutral fiber rings, and sustainable power procurement structures, while also widening the addressable ecosystem for specialized EPC, thermal management, and O&M providers.
Recent Industry Developments
- July 2026: Amazon foundation stone laid for a major data center project in Bharat Future City, Hyderabad; phase 1 operations targeted within 24 months. The investment directly expands Hyderabad's data center capacity and strengthens the region as a hyperscale hub.
- July 2026: CtrlS Datacenters announces an investment of INR 10,000 crore to develop two AI-ready data center clusters at Chandanvelly and Meerkhanpet. The capacity addition bolsters AI-ready footprint and density, signaling a high-end campus deployment trend.
- June 2026: CPP Investments announced USD 1 billion commitment to scale AI-ready data center capacity. The foreign capital backing accelerates capacity growth and AI-friendly infrastructure in Hyderabad.
Research Methodology Framework and Report Scope
Market Definition and Coverage
For this study, the Hyderabad data center market is defined as IT load capacity (in MW) that is installed and operational within the Hyderabad metro area, covering facilities that host compute and storage for enterprise, cloud, and colocation demand.
Scope exclusions: It excludes planned, committed, and early-stage pipeline capacity that is not yet commissioned, and it also excludes captive IT rooms that do not operate as a data center facility.
Segmentation Overview
- By Data Center Size
- Small
- Medium
- Large
- Mega
- Massive
- By Tier Standard
- Tier I and II
- Tier III
- Tier IV
- By Absorption
- Non-Utilised
- Utilised
- By Colocation Type
- Hyperscale
- Retail
- Wholesale
- By End-User Industry
- BFSI
- Cloud Service Providers
- E-Commerce
- Government
- Manufacturing
- Media and Entertainment
- Telecom
- Other End Users
- By Colocation Type
Data Sources, Market Sizing, and Validation
Desk Research
Desk research helped us establish a baseline for the city demand environment and build feasibility, before any primary checks were done. We referenced public sources such as the Telecom Regulatory Authority of India (TRAI), the Ministry of Electronics and Information Technology (MeitY), the Central Electricity Authority (CEA), and India's National Internet Exchange (NIXI) to understand internet traffic direction, policy signals, and power availability trends that affect where IT load is ultimately deployed.
We also reviewed state policy documents and incentive notes, plus company annual reports, investor presentations, and credible local business press to map data center announcements to realistic delivery windows. In a few areas, paid subscriptions were used for company financials and intelligence, patent lookups around cooling and power equipment were reviewed for technical context, and shipment-level import-export patterns for relevant electrical and mechanical items were checked. The desk sources listed here are not exhaustive, and other public and paid references were used for data collection, cross-checks, and clarifications.
Primary Interviews and Surveys
We interview data center operators, developers, cloud and colocation buyers, power specialists, and facility managers in Hyderabad and elsewhere in India. Their input helps clarify occupancy, rack density, realized pricing, delivery timing, and power constraints, while also resolving gaps in public project records. Analysts re-contact respondents when reported capacity or timing differs materially from documented evidence.
Distribution of primary research fieldwork respondents
| Company type | Respondent position |
|---|---|
| Top tier: 28% | CXOs: 15% |
| Mid tier: 47% | Functional/Unit leaders: 32% |
| Smaller Players: 25% | Managers: 53% |
Market-Sizing & Forecasting
Market sizing was built using a top-down approach where supply-side capacity tracking and commissioning schedules reconstruct the installed IT load for Hyderabad, and then the resulting totals are checked against demand-side absorption signals. Once the city total is set, it is split and reconciled using a limited bottom-up approximation based on known facility footprints, typical rack density ranges, and sampled MW per hall assumptions, with gaps filled through expert re-checks.
The main model inputs included installed IT load (MW), under-construction capacity that has secured land and power, typical rack power density shifts driven by AI and high-performance compute, power availability and redundancy planning, and visible changes in colocation utilization over time. To forecast, scenario analysis was applied so the build-out curve reflects differences in power readiness, delivery lead times, and tenant pre-commitments, and these scenarios were aligned to the consensus view from interviews. Where a site-level number could not be validated, conservative commissioning timing was used first and then adjusted only when multiple sources pointed to the same change.
Data Validation & Update Cycle
Outputs were validated by comparing the model against independent checks such as known commissioned campuses, power allocation milestones, and the implied utilization path that the market would need to follow to reach the forecast. When a variance looked large, the drivers were unpacked and reviewed again, and follow-up calls were triggered if timelines, MW values, or definitions were not consistent across sources.
Before sign-off, results go through multi-step analyst reviews, where assumptions are challenged and calculations are re-run to ensure arithmetic and logic are consistent. The report is refreshed annually, and interim updates are made when material events occur, such as large campus announcements turning into commissioned capacity or major policy changes affecting power and land. Right before delivery, we do a fresh pass so clients receive the latest updated view.
Mordor Intelligence's Hyderabad Data Center Market Sizing Compared With Other Published Estimates
Published market estimates for Hyderabad often do not line up because each publisher uses a different yardstick for what counts as market size, and they also choose different timing points for counting capacity. In this market, the biggest swings usually come from mixing up installed capacity with pipeline supply, and from treating planned hyperscale land positions as if they were already live IT load.
By checking commissioning status, power energization, and facility live dates, Mordor Intelligence keeps the 2025 market size tied to installed IT load in Hyderabad, which avoids counting early-stage pipeline MW that is still moving through approvals and construction sequencing.
Benchmark comparison
| Source | Market Size | Gaps in Research Methodology |
|---|---|---|
| Mordor Intelligence | USD 859.00 M (2025) | |
| Industry Data Platform A | USD 2.12 B (2025) | Counts total supply as a broad bucket, which includes live, under construction, committed, and early stage capacity, so the number is not restricted to commissioned IT load. |
| Regional Research Note B | USD 47.00 M (2024) | Uses a narrower installed-capacity snapshot and appears closer to older live capacity, without normalizing for upgrades, recent commissioning, or consistent MW definitions across facility types. |
The spread in the table is mainly explained by what is being counted at the city level, where one approach blends pipeline with live capacity and another stays closer to a single-time snapshot. Our method stays repeatable because the total is built from clear capacity status rules, and then validated through multiple independent checks before the forecast curve is finalized.
Key Questions Answered in the Report
How fast is capacity growing in Hyderabad?
The Hyderabad data center market size stands at 1,093.1 MW of installed IT load in 2026 and is projected to reach 4,640.8 MW by 2032, translating into a 27.25% CAGR over 2026-2032.
Which facility size is expanding the quickest?
Massive campuses larger than 80 MW are advancing at a 23.07% CAGR, driven by hyperscale demand for consolidated, AI-ready capacity.
Why are Tier IV builds gaining traction?
AI and gaming workloads cannot tolerate outages, so operators justify Tier IV’s 99.995% uptime despite higher capex, leading to a 20.68% CAGR for this standard.
What role does the DPDP Act play?
The 2023 data-localization law forces enterprises to store personal data in-country, guaranteeing a baseline of demand for compliant Hyderabad facilities.
How severe are grid-reliability issues?
Frequent power cuts increase diesel-genset usage by up to 30%, raising OPEX; operators are piloting hydrogen fuel cells to mitigate this risk.
Which companies are investing the most?
Amazon, Microsoft, and NTT headline with multi-billion-dollar commitments, while local leader CtrlS and new entrant AdaniConneX accelerate expansion through green financing.
- Artificial Intelligence (AI) Data Center Market AI facilities across all regions, split by facility type, component and tier.
- Data Center Construction Market Construction across all regions, split by tier, facility size and facility type.
- Data Center Server Market Servers worldwide, split by tier, facility size and facility type.
- Canada Data Center Water Consumption Market Canada water use, split by source of water procurement, facility type and facility size.
- US Data Center Rack Market The US's racks, split by rack size and end-user.
- Mega Data Center Market Global mega facilities demand, split by solution, facility type and cooling technology.
- Australia Data Center Storage Market Storage demand across Australia, covering storage technology, storage type and facility type.
- Thailand Data Center Rack Market Racks demand across Thailand, covering rack size, rack height and rack type.
- Saudi Arabia Data Center Construction Market Construction in Saudi Arabia, split by tier.
- United States Data Center Storage Market Storage in the US, split by storage technology, storage type and end user.