
Market Overview
| Study Period | 2020 - 2031 |
|---|---|
| Market Size (2026) | USD 109.33 Billion |
| Market Size (2031) | USD 161.46 Billion |
| Growth Rate (2026 - 2031) | 8.11 % |
| Fastest Growing Market | Africa |
| Largest Market | Asia Pacific |
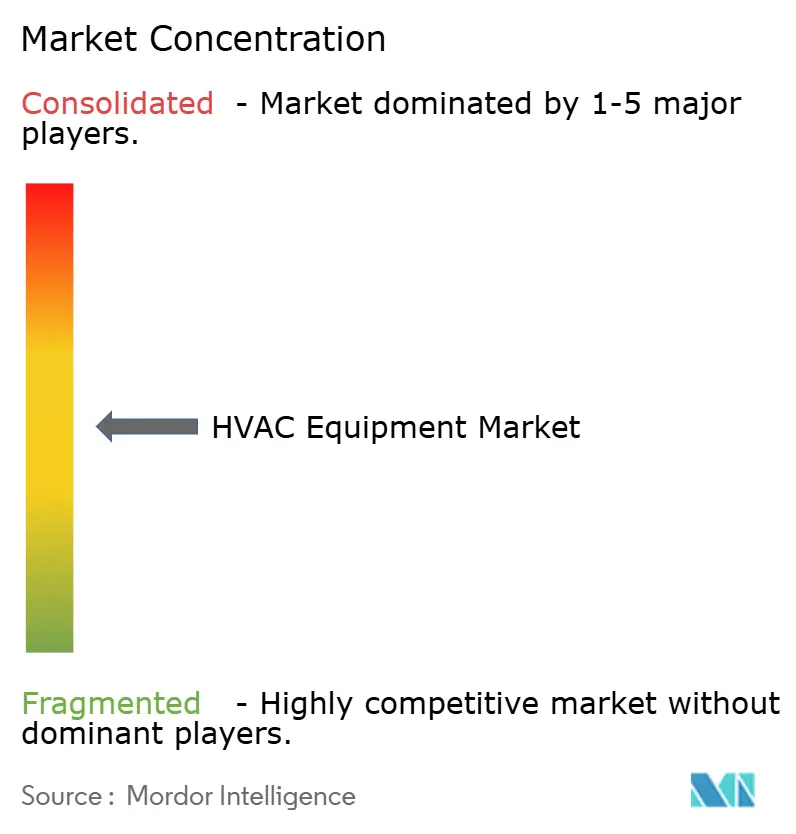
| Market Concentration | Medium |
Major Players *Disclaimer: Major Players sorted in no particular order Image © Mordor Intelligence. Reuse requires attribution under CC BY 4.0. | |
HVAC Equipment Market Analysis by Mordor Intelligence
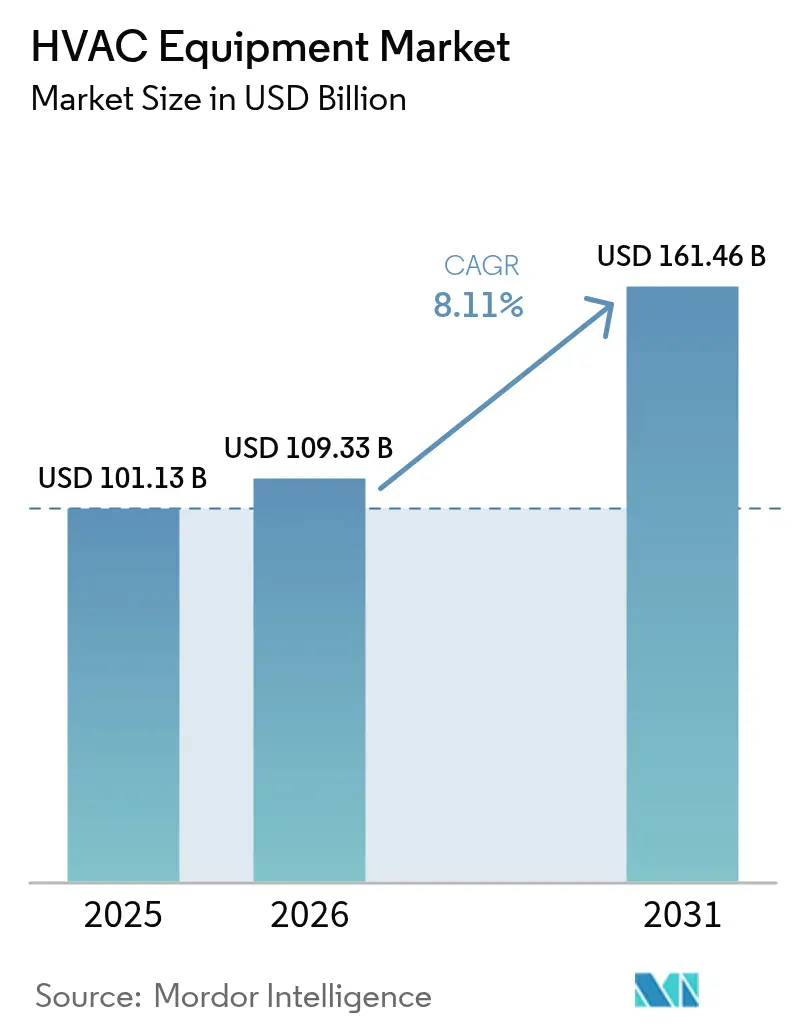
The HVAC equipment market size is projected to expand from USD 101.13 billion in 2025 and USD 109.33 billion in 2026 to USD 161.46 billion by 2031, registering an 8.11% CAGR between 2026 and 2031. Heightened policy pressure to eliminate fossil-fuel boilers in Europe, rapid data-center construction in cold-climate corridors, and widespread adoption of variable-refrigerant-flow (VRF) systems in Asian high-rises are accelerating equipment replacement cycles and pulling forward new-build demand. Europe’s Energy Performance of Buildings Directive eliminated standalone gas boilers in new projects from 2025, sending heat-pump retrofits sharply higher and compressing payback periods to seven years. Hyperscale cloud operators clustering campuses in the Nordics and the Frankfurt-London-Amsterdam-Paris-Dublin (FLAP-D) corridor now cover up to 70% of annual cooling hours with free cooling, slashing mechanical-chiller runtimes and lifting precision-cooling capital budgets. Meanwhile, VRF systems are replacing ducted splits in Chinese, Indian, and Southeast Asian towers because they fit tight floorplates, deliver zone-level control, and cut energy use by 20%-30%.
Key Report Takeaways
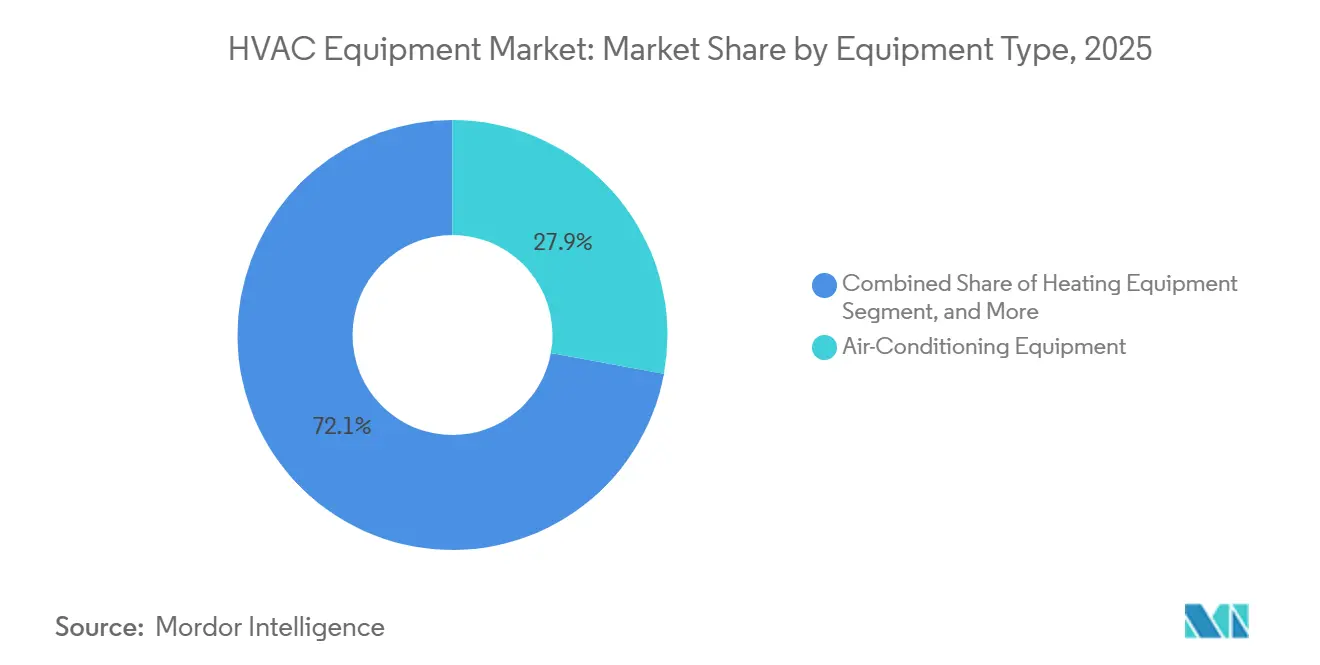
- By equipment type, air-conditioning systems retained the largest 27.89% share of the HVAC equipment market in 2025, while heating equipment delivered the fastest 8.78% CAGR through 2031.
- By installation type, retrofit and replacement projects accounted for 62.33% of 2025 revenue; however, new construction is advancing at an 8.58% CAGR on the back of data-center and Asian high-rise pipelines.
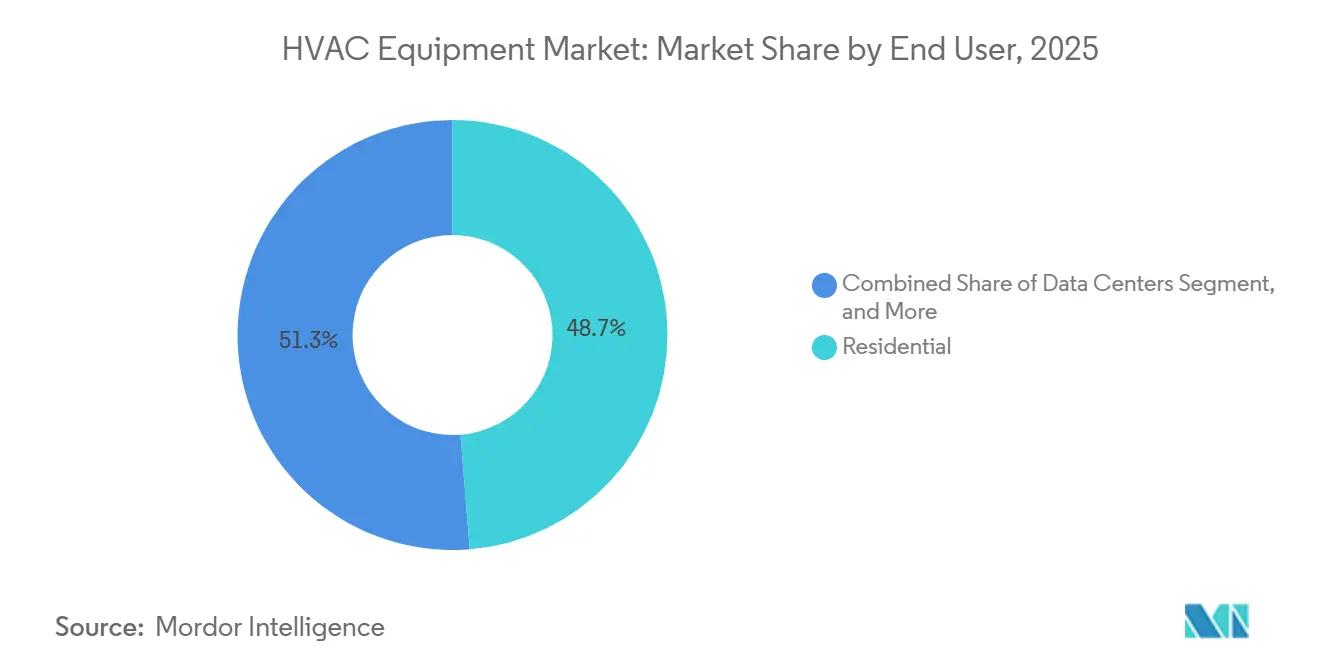
- By end user, residential applications represented 48.72% of 2025 spending, whereas data centers are expanding at an 8.74% CAGR as rack densities accelerate liquid-cooling adoption.
- By commercial building type, data centers led with 21.34% revenue share in 2025; healthcare facilities are forecast to post the quickest 9.33% CAGR to 2031.
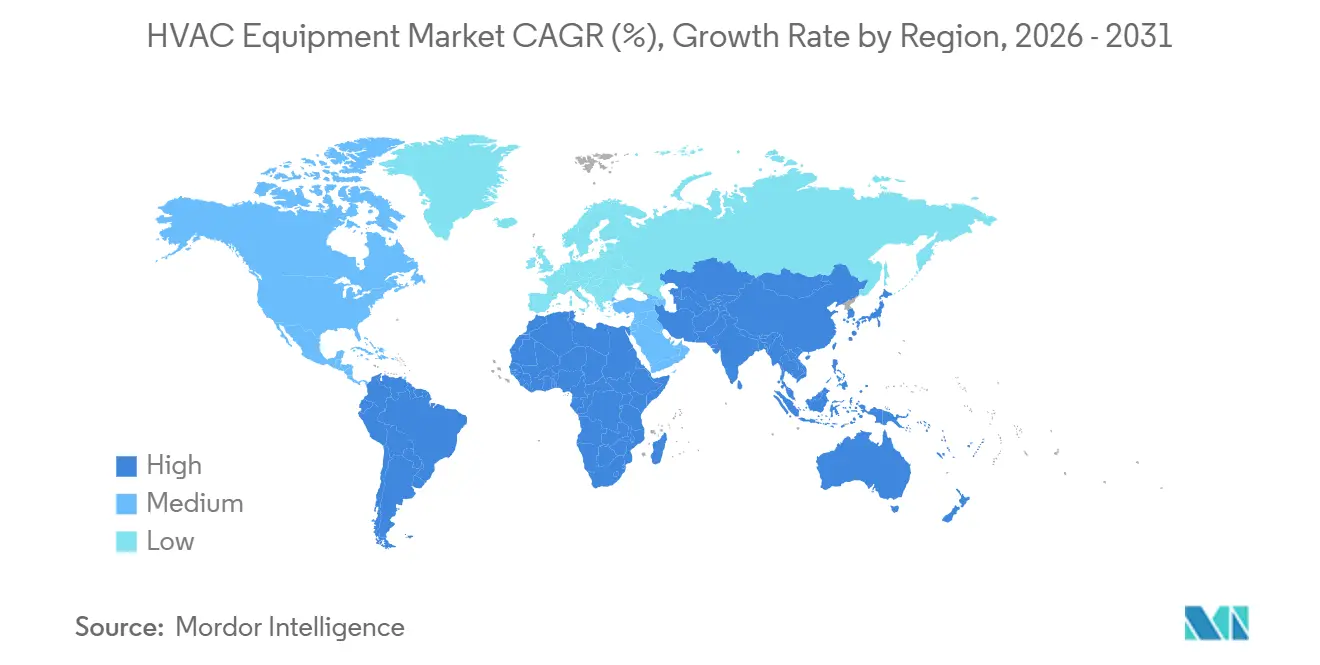
- By geography, Asia Pacific captured 38.56% of 2025 sales; Africa, though smaller in absolute size, is projected to grow the fastest at 9.12% CAGR.
Note: Market size and forecast figures in this report are generated using Mordor Intelligence’s proprietary estimation framework, updated with the latest available data and insights as of 2026.
Market Trends and Insights
Drivers Impact Analysis of HVAC Equipment Market*
| Driver | (~) % Impact on CAGR Forecast | Geographic Relevance | Impact Timeline |
|---|---|---|---|
| Stringent building energy codes in Europe accelerating heat-pump adoption | +1.8% | Europe, with spillover to UK and Scandinavia | Medium term (2-4 years) |
| Surge in data-center construction in Nordics and FLAP-D region elevating precision cooling demand | +1.5% | Europe (Nordics, FLAP-D), North America | Short term (≤ 2 years) |
| Rapid uptake of variable-refrigerant-flow systems in high-rise Asian residential complexes | +1.3% | Asia Pacific (China, India, ASEAN) | Medium term (2-4 years) |
| Inflation Reduction Act tax credits catalyzing early furnace replacement cycles | +1.2% | United States | Short term (≤ 2 years) |
| District-heating expansion in Eastern Europe spurring large-capacity boiler retrofits | +0.9% | Eastern Europe (Poland, Czech Republic, Hungary) | Long term (≥ 4 years) |
| Solar-hybrid HVAC packages gaining traction in off-grid African mining camps | +0.6% | Africa (Botswana, Zambia, DRC) | Long term (≥ 4 years) |
| Source: Mordor Intelligence | |||
Stringent Building Energy Codes in Europe Accelerating Heat-Pump Adoption
Europe’s 2024 directive outlawed new fossil-fuel boilers from 2025 and requires the worst 16% of non-residential buildings to meet minimum energy-performance thresholds by 2030, forcing owners to install air- or ground-source heat pumps that exceed seasonal performance factors of 3.5.[1] National statutes amplify the push: France’s RE2020 caps carbon intensity at 4 kg CO₂ e /m²-year for homes, Germany’s amended Gebäudeenergiegesetz demands 65% renewable heat, and both frameworks align economically when carbon taxes and avoided gas purchases reduce payback periods below a decade. OEMs have responded. Daikin tripled Belgian capacity to 1.5 million units per year by 2027, underscoring confidence that policy-led demand will persist. Heat-pump adoption, therefore, delivers the single-largest positive uplift to the HVAC equipment market growth outlook.
Surge in Data-Center Construction in Nordics and FLAP-D Region Elevating Precision Cooling Demand
Cloud hyperscalers continue clustering megawatt-scale facilities in the Nordics, where average annual temperatures of 5 °C-12 °C allow air-side economizers to serve up to 70% of cooling hours, cutting power-usage-effectiveness below 1.2. Meta’s 150 MW campus in Odense leveraged seawater cooling to eliminate winter mechanical refrigeration and save USD 12 million per year in energy expense. Microsoft’s Stockholm expansion relies on adiabatic towers operating within 2 °C of ambient.[2] Direct-to-chip liquid solutions now pull 80% of heat before it enters data halls, permitting 30 kW-per-rack densities that command price premiums over legacy air units. Precision cooling, therefore, becomes a high-margin subsegment, pushing the overall HVAC equipment market upwards.
Rapid Uptake of VRF Systems in High-Rise Asian Residential Complexes
VRF systems captured 35% of new high-rise installations in China, India, and Southeast Asia in 2025 because they eliminate bulky duct shafts, enable room-by-room temperature control, and modulate compressors to match part-load demand. Mumbai’s 78-story World One tower serves 400 apartments from rooftop condensers, avoiding facade clutter and streamlining maintenance. Vietnamese building codes adopted in 2024 introduced compulsory energy certificates, favoring VRF with a part-load efficiency ratio above 4.0. LG’s Multi V 5 provides simultaneous heating and cooling, recovering waste heat to cut annual HVAC energy by 18%. Subsidy schemes in China reimburse 15% of incremental VRF costs, triggering 22% sales growth at Gree in 2025.
Inflation Reduction Act Tax Credits Catalyzing Early Furnace Replacement Cycles
The United States 25C credit refunds 30% of the cost, up to USD 2,000, for qualifying heat pumps and USD 600 for efficient furnaces, pushing replacements forward by roughly 18 months. Carrier reported a 28% jump in residential heat-pump shipments in 1H 2025, with Rheem noting that 40% of units qualified for enhanced, income-based caps. Lennox opened a USD 70 million plant in Texas dedicated to heat-pump production in 2024, banking on sustained double-digit domestic growth. Although a technician shortage extended installation backlogs into mid-2026, OEM backorders confirm that incentives materially increase addressable demand.
Restraints Impact Analysis of HVAC Equipment Market*
| Restraint | (~) % Impact on CAGR Forecast | Geographic Relevance | Impact Timeline |
|---|---|---|---|
| High upfront cost of low-GWP refrigerant transition for OEMs | -1.2% | Global, with acute pressure in EU and North America | Medium term (2-4 years) |
| Talent shortage of certified HVAC technicians in mature markets | -0.9% | United States, Germany, United Kingdom, Canada | Short term (≤ 2 years) |
| Semiconductor supply-chain volatility constraining VRF inverter availability | -0.7% | Global, with bottlenecks in Asia Pacific manufacturing hubs | Short term (≤ 2 years) |
| Stringent F-gas quotas in EU increasing compliance burden for importers | -0.6% | European Union, with spillover to UK and EFTA states | Medium term (2-4 years) |
| Source: Mordor Intelligence | |||
High Upfront Cost of Low-GWP Refrigerant Transition for OEMs
EU F-gas quotas fall to 2.4% of 2015 baselines by 2030, forcing R410A retirement and driving capital spending of USD 50 million-USD 100 million per manufacturing site to retool for mildly flammable A2L refrigerants. Daikin cites USD 18 million to convert a single line; Johnson Controls expects USD 250 million group-wide through 2027, compressing margins by 120 bp during the transition. Larger heat-exchanger coils, additional leak sensors, and new safety certifications add USD 300-USD 500 per unit, costs difficult to pass through in price-sensitive segments. Until tooling amortizes, the drag on profitability acts as a modest brake on HVAC equipment market expansion.
Talent Shortage of Certified HVAC Technicians in Mature Markets
Retirements and lagging apprenticeship enrolment leave the United States short of an estimated 50,000 technicians by 2030.[3] ACCA members blamed workforce shortages for a 15% backlog of sold but not installed units in 2025. Germany faced a 60,000-installer deficit in 2025, delaying 18% of planned heat-pump projects. The United Kingdom enrolled only 3,200 HVAC apprentices in 2024, against targets of 15,000. A2L refrigerant protocols require extra certification, yet fewer than 30% of technicians had completed the 40-hour course by mid-2025. Labor scarcity, therefore, caps the pace at which the HVAC equipment market can physically deploy ordered systems.
*Our forecasts treat driver/restraint impacts as directional, not additive. The impact forecasts reflect baseline growth, mix effects, and variable interactions.
HVAC Equipment Market Segment Analysis
By Equipment Type:
Heat Pumps Extend Lead Over Legacy HeatingHeating equipment expanded at an 8.78% CAGR through 2031, outpacing the overall HVAC equipment market as heat pumps displaced furnaces and boilers in both new projects and retrofits. By 2025, heating revenue, heat pumps captured 58%, while boilers and furnaces retained 32%, because large-capacity commercial boilers remain economical for district-heating upgrades in Eastern Europe. The shift widened after EU rules banned standalone fossil-fuel boilers, and the United States, by combining federal and utility rebates, compressed payback periods from 10 to 6 years.
Air-conditioning equipment, although accounting for the largest 27.89% slice of 2025 revenue, grew more slowly because North American and Western European households operate at near-saturation and focus on efficiency-driven replacements. Nonetheless, VRF and liquid-cooling solutions posted double-digit gains inside the air-conditioning category, buoyed by mixed-use high-rises and data-center rack densities. Ventilation products accounted for 22% of 2025 sales, following upgrades in healthcare and education to MERV 13 filtration under ASHRAE 241. The blend of robust heating growth and steady cooling replacements confirms a balanced demand mix that supports the long-run expansion of the HVAC equipment market.

By Installation Type:
Retrofit Dominates Value While New Construction AcceleratesRetrofit and replacement accounted for 62.33% of 2025 revenue, reflecting the aging global building stock and energy-savings math that favor swapping fixed-speed units for inverter-driven models. Replacing a 20-year-old 10 SEER unit with a 2025 model featuring a 16 SEER rating can result in significant energy savings. The older unit consumes 60% more electricity compared to the newer model, leading to annual savings of USD 400 to USD 600 for commercial owners. These savings not only reduce operational costs but also justify the early replacement of outdated equipment.
New construction, however, is advancing at an 8.58% CAGR thanks to data-center campuses in the Nordics and FLAP-D corridor, residential towers in India, Vietnam, and the Philippines that specify VRF at first fit-out, and Middle-Eastern industrial plants requiring precision cooling. Developers frequently allocate 8%-12% of project budgets to mechanical systems in high-performance buildings, driving significant upfront demand. The convergence of retrofit techniques, modular AHUs, ductless minis, and rooftop packaged units blurs boundaries, yet retrofit remains the value anchor of the HVAC equipment market size in the near term.
By End User:
Data Centers Propel High-Value GrowthResidential buyers accounted for 48.72% of 2025 revenue, but growth lags at a 7.8% CAGR because penetration in developed economies exceeds 90% and the replacement interval stretches to 15 years. Data centers, conversely, contributed only 8% of 2025 revenue yet are expanding at an 8.74% CAGR as AI inference workloads triple rack heat densities and mandate liquid-cooling architectures commanding 40%-60% price premiums.
Commercial buildings posted 32% of 2025 revenue and an 8.5% CAGR as hospitals rushed to meet ASHRAE 170 ventilation rules, hotels installed guest-room mini-splits, and offices integrated HVAC with occupancy analytics through smart-building software. Industrial facilities accounted for 12% of turnover, rising 7.2% annually, driven by semiconductor, pharmaceutical, and food-processing lines that demand tight thermal tolerances. Collectively, these trends reinforce data centers as the premium growth wedge inside the broader HVAC equipment market.
By Commercial Building Type:
Healthcare and Hospitality Lift Mixed-Use SpendingData-center projects dominated the category, accounting for 21.34% of commercial building share in 2025, leveraging liquid-cooling and redundancy requirements that yield gross margins of 35%-40 % for OEMs. As infection-control standards mandated increased ventilation in patient rooms, healthcare facilities captured an 18% market share, witnessing an 9.33% CAGR. This growth highlights the rising emphasis on maintaining stringent air quality standards to ensure patient safety and reduce the risk of airborne infections.
Hospitality properties accounted for 16% of commercial spending, rising 8.2% annually as VRF retrofits enabled guest-level billing and reduced idle-room waste by 40%. Office buildings delivered a 22% share but only a 6.8% CAGR due to hybrid-work patterns, while retail lagged at 12% share and 5.5% growth because landlords shifted HVAC responsibility to tenants via ductless splits. Education facilities rounded out the mix at 11% share, advancing 7.8% annually through the replacement of 30-year-old rooftop units. This segmentation underscores how regulatory and comfort-driven upgrades steer the HVAC equipment market toward higher-margin niches.
Geography Analysis
APAC HVAC Equipment Market
Asia Pacific held 38.56% of 2025 revenue, anchored by China’s 85 million room-air-conditioner shipments and India’s surge in inverter-AC penetration from 30% in 2023 to 60% in 2025. Southeast Asian high-rises are increasingly adopting VRF systems, while Japanese households are swapping out their aging split systems for low-GWP models. As a result, the region is set to outpace the global average, with a projected growth rate of 8.3% CAGR.
North America, Europe and Middle East HVAC Equipment Market
North America delivered 26% of 2025 turnover and 7.9% CAGR, shaped by the Inflation Reduction Act’s tax credits and data-center builds in Virginia, Texas, and Oregon. Europe contributed 22% of revenue, advancing at an 8.6% CAGR, as the boiler ban drives heat-pump retrofits and Scandinavia leads ground-source adoption, with seasonal performance factors above 4.5. The Middle East posted 8% share and an 8.8% CAGR on megaprojects such as Saudi Arabia’s NEOM city and United Arab Emirates data hubs, where 45 °C summers require oversizing and redundancy.
South America and Africa HVAC Equipment Market
South America added 6% of 2025 volume and 7.5% CAGR, buoyed by Brazil’s residential rebound yet tempered by Argentine volatility, while Africa, starting from a USD 4 billion 2025 base, is forecast to expand at a leading 9.12% CAGR as mining camps adopt solar-hybrid packaged units and urban centers retrofit inverters to curb electricity costs. Together, these dynamics position Asia Pacific as the revenue anchor and Africa as the percentage-growth frontier of the HVAC equipment market.
Regulatory Landscape
Regulatory pressure is increasingly tied to refrigerant phase-down schedules and building energy-performance requirements, both of which push equipment turnover. In the United States, the EPA finalized restrictions under the AIM Act for HFC uses in variable refrigerant flow (VRF) systems, with January 1, 2026 as a key cutoff for the manufacture or import of certain HFC-containing VRF components, while allowing limited transition provisions for installation of pre-2026 components into 2027 or 2028 depending on permitting status. In parallel, the U.S. Department of Energy issued a July 2026 Notice of Proposed Rulemaking to revise its energy conservation standards process rule, signaling a more procedure-driven pathway for new or revised efficiency standards that OEMs and importers must track for compliance planning.
In Europe, policy continues to link building decarbonization targets to minimum performance and product requirements, supporting heat-pump adoption and pulling forward replacement cycles. The EU maintains Ecodesign and energy-labeling requirements for air heating and cooling products, including ongoing work on ENER LOT 1 and 2 updates for heat pumps and hybrid heat pumps (up to 70 kW) with evolving test procedures such as the compensation method. Alongside the Energy Performance of Buildings Directive (EU) 2024/1275 dynamics cited in the report context, these rules add compliance complexity around low-GWP refrigerants, safety, and declared seasonal performance, shaping product roadmaps and certification timelines across suppliers.
Value Chain Analysis
The HVAC equipment value chain starts with raw materials and critical inputs (copper, aluminum, steel, and semiconductors), which flow into core components such as compressors, inverters, valves, motors, heat exchangers, controls, and refrigerants, before OEMs assemble these into heating equipment, ventilation equipment, and air-conditioning equipment (including VRF, chillers, and packaged systems). Finished goods then move through layered route-to-market channels that combine large distributors and wholesalers with OEM branches, followed by mechanical contractors and service firms that design, install, commission, and maintain systems, particularly in retrofit and replacement projects that represented 62.33% of 2025 revenue in the report context.
Bottlenecks and differentiation are increasingly concentrated in components and software. Semiconductor volatility can constrain inverter-driven VRF and control boards, while A2L refrigerant transitions introduce additional safety-related parts and certification steps that affect upstream component suppliers and downstream OEM production schedules. Digital partners are also moving closer to the delivery chain: Carrier and Google Cloud announced a March 2025 partnership to integrate AI capabilities into home energy management linked to HVAC, and Siemens and Microsoft announced a June 2025 collaboration to connect Siemens Building X with Azure IoT Operations. Together, these developments reinforce a shift toward connected equipment, monitoring, and analytics that extends value beyond hardware into commissioning and lifecycle services.
Competitive Landscape
The five largest vendors, Daikin Industries, Carrier Global, Trane Technologies, Johnson Controls, and Mitsubishi Electric, controlled roughly 42% of 2025 global revenue, yielding a moderately concentrated competitive field. Daikin led with an 11% share and filed 127 inverter- and R32-related patents between 2024 and 2025, aiming to lock in leadership in the refrigerant transition. Carrier vaulted to second place in European heat pumps by acquiring Viessmann Climate Solutions for EUR 12 billion (USD 13.6 billion) in 2025, adding 13,000 employees and 2.8 million-unit annual capacity.
Chinese manufacturers Gree, Midea, and Haier, commanding a dominant 68% share of the domestic residential split market, are now setting their sights on the Middle Eastern and African markets. Leveraging economies of scale, they're managing to price their products 20%-30% lower than their Western counterparts. A testament to this strategy is Midea's 2025 joint venture in Cairo, which has already ramped up shipments to a notable 1.2 million units annually, catering to both North Africa and the Gulf states.
Technology platforms differentiate incumbents: Johnson Controls’ OpenBlue suite integrates HVAC, lighting, and security data to cut whole-building energy by 28%, winning 18 million ft² of contracts in 2025. Gradient Comfort introduced window heat pumps for U.S. rentals, targeting markets where landlords ban wall penetrations, challenging traditional packaged terminal units. Early completion of low-GWP transitions also confers an advantage; Daikin and Mitsubishi Electric captured incremental European share in 2025 while rivals retooled lines. Overall, innovation pace, rather than price alone, now shapes competitive wins in the HVAC equipment market.
HVAC Equipment Industry Leaders
-
Daikin Industries Ltd.
-
Carrier Global Corp.
-
Mitsubishi Electric Corp.
-
Lennox International Inc.
-
Midea Group
- *Disclaimer: Major Players sorted in no particular order
HVAC Equipment Market Companies Covered in this Report
- Daikin Industries Ltd.
- Carrier Global Corp.
- Trane Technologies PLC
- Johnson Controls International PLC
- Mitsubishi Electric Corp.
- Lennox International Inc.
- Rheem Manufacturing Co.
- Midea Group
- Gree Electric Appliances Inc.
- NIBE Group
- Panasonic Holdings Corporation
- Samsung Electronics Co., Ltd.
- LG Electronics Inc.
- Bosch Thermotechnology
- Vaillant Group
- Alfa Laval AB
- Stiebel Eltron GmbH and Co. KG
- Systemair AB
- Greenheck Fan Corporation
- FläktGroup
- TROX GmbH
- Swegon Group AB
- Hitachi-Johnson Controls Air Conditioning
- Danfoss A/S
Market Opportunities and Future Outlook
Policy-led electrification and the refrigerant transition continue to create defined whitespace across localized manufacturing, compliant product platforms, and deployment capacity. In Europe, OEM investment is aligning with post-boiler-ban retrofit demand and Ecodesign and labeling compliance. Daikin inaugurated a new approximately EUR 300 million heat-pump production facility in the Lodz region of Poland in May 2026, and Johnson Controls expanded its Holme, Denmark site in May 2026 with added production space and a test center compliant with EN 14511 for high-capacity heat pumps. These steps support supplier opportunities around shortening lead times for low-GWP heat pumps, obtaining safety certifications, and delivering installation-ready packages for retrofit channels.
In Asia, capacity additions point to demand pull from new construction, high-rise VRF adoption, and the need for regional sourcing. Carrier signed a lease in February 2026 for a Rs 1,000 crore manufacturing facility in Sri City, India, while FlaktGroup announced a new manufacturing facility in Pune, India (Project GAGAN) with a stated capacity of 6,500 units annually and targeted full operation by June 2026. On the component side, Nidec Global Appliance advanced construction of an Embraco compressor plant in India targeting a ramp-up in late 2026 with a stated 6 million-unit annual capacity. Overall, the investments strengthen opportunities for OEMs and component makers to localize compressors, inverters, and heat-pump and VRF production, alongside contractor enablement and service networks that address technician constraints and A2L handling requirements already visible in mature markets.
Recent Industry Developments in HVAC Equipment Market
- July 2026: Carrier completed the sale of its Riello business to Ariston Group for gross proceeds of about USD 440 million. The divestiture streamlines Carrier's portfolio toward its core HVAC and intelligent climate priorities, tightening capital allocation to segments such as heat pumps and commercial cooling where technology differentiation is increasing.
- May 2026: Daikin inaugurated a new heat-pump production facility in the Lodz region of Poland, backed by an investment of around EUR 300 million. The added European footprint supports shorter lead times and higher local availability of heat pumps as the region accelerates retrofit activity under tightening building decarbonization rules.
- March 2025: Carrier and Google Cloud announced a partnership to integrate AI capabilities into home energy management systems connected to residential HVAC equipment. The collaboration reflects a shift in the value proposition from standalone equipment toward grid-interactive, software-enabled solutions that can support utilities and homeowners managing peak loads and electrification.
HVAC Equipment Market Report Scope and Research Methodology
Market Definition and Coverage
This market covers revenue earned from selling HVAC equipment used to heat, cool, and ventilate residential, commercial, and industrial spaces, counted at the point of equipment sale across major regions.
Scope exclusions: We exclude installation labor, ongoing maintenance and repair services, and extended service contracts that are billed separately from the equipment.
Segments Covered in This Report
- By Equipment Type
- Heating Equipment
- Boilers and Furnaces
- Heat Pumps
- Unitary Heaters
- Ventilation Equipment
- Air Handling Units
- Humidifiers and Dehumidifiers
- Air Filters
- Fan Coil Units
- Air-Conditioning Equipment
- Unitary Air Conditioners
- Ducted Splits
- Ductless Mini-Splits
- Packaged Rooftops
- Variable Refrigerant Flow (VRF) Systems
- Room Air Conditioners
- Packaged Terminal Air Conditioners
- Chillers
- Unitary Air Conditioners
- Heating Equipment
- By Installation Type
- New Construction
- Retrofit / Replacement
- By End User
- Residential
- Commercial
- Industrial
- By Commercial Building Type
- Office Buildings
- Healthcare Facilities
- Hospitality and Leisure
- Retail Stores and Malls
- Educational Institutions
- Data Centers
- By Geography
- North America
- United States
- Canada
- Mexico
- South America
- Brazil
- Argentina
- Rest of South America
- Europe
- United Kingdom
- Germany
- France
- Italy
- Rest of Europe
- Asia Pacific
- China
- Japan
- India
- South Korea
- Rest of Asia Pacific
- Middle East and Africa
- Middle East
- United Arab Emirates
- Saudi Arabia
- Rest of Middle East
- Africa
- South Africa
- Egypt
- Rest of Africa
- Middle East
- North America
Data Sources, Market Sizing, and Validation
Desk Research
Desk research is used to set the factual base for HVAC equipment demand and then to pressure test the model outputs. We refer to public datasets such as US EIA energy and heating fuel trends, Eurostat construction and energy indicators, UN Comtrade trade flows for HVAC related product categories, and IEA cooling demand and efficiency context. We also review technical and adoption signals from sources such as ASHRAE publications, national standards and building code updates, and peer reviewed journals that track refrigerants and efficiency improvements.
To translate these signals into market value, we review company annual reports, investor presentations, and earnings call notes for pricing direction, mix shifts, and capacity additions. A few paid subscriptions are used selectively for company financials and intelligence, news and financials, patent databases, and shipment level import export checks, which help us avoid gaps where public reporting is thin. These desk inputs are carried into interview guides so assumptions can be challenged early, rather than after the model is built. The sources listed here are illustrative and not exhaustive, since many other public and paid references were also used for collection, cross checks, and clarification.
Primary Interviews and Surveys
Primary work is used to verify assumptions that desk research cannot confirm cleanly, especially replacement timing, channel markups, and how pricing is moving by equipment category. We speak with a mix of manufacturers, distributors, installers, and large buyers across APAC, EMEA, and the Americas so regional construction cycles and retrofit activity are captured. Insights from these conversations are then used to tune variable ranges before totals are finalized.
Distribution of primary research fieldwork respondents
| Company type | Respondent position | Region |
|---|---|---|
| Top tier: 33% | CXOs: 17% | APAC: 45% |
| Mid tier: 50% | Functional/Unit leaders: 26% | EMEA: 33% |
| Smaller Players: 17% | Managers: 57% | Americas: 22% |
Market-Sizing & Forecasting
For sizing, we start with a top-down build where construction activity, retrofit replacement share, and trade and production signals are translated into equipment demand, which is then valued using representative price ladders by equipment type. To keep the totals grounded, the results are corroborated with selective bottom-up approximations, such as sampled supplier revenue roll ups by region and simple volume times ASP checks for higher visibility equipment groups.
A few HVAC specific inputs are treated as core drivers in the model, which keeps the numbers traceable from year to year. These include new construction versus retrofit mix, regional floor space additions, heat pump and high efficiency product penetration, refrigerant transition timing that affects product redesign and pricing, and the split of commercial activity across offices, healthcare, education, and data centers. When volume signals are incomplete, gaps are handled using proxies such as import intensity, capacity expansion announcements, and distributor feedback, and then adjusted during analyst review.
Forecasting is done using scenario analysis supported by exponential smoothing on key time series, and then tuned using expert expectations on pricing and adoption changes. Since cost and regulation can shift quickly, assumptions are refreshed for major events like efficiency rule changes, refrigerant restrictions, and construction slowdowns, and then carried through the regional roll up.
Data Validation & Update Cycle
Model outputs are checked against independent market signals so mismatches can be caught early, including swings that do not align with construction permits, trade movement, or disclosed revenue direction. Variance checks are run by region and by major equipment group, and then reviewed in more than one analyst pass before sign off, which helps reduce single person bias.
When large gaps show up, respondents are re contacted to confirm whether the issue is definition related, timing related (pricing updates can lag), or linked to a local policy change that shifted demand across years. Reports are refreshed annually, with interim updates triggered by material events that can change pricing or unit demand meaningfully. Before delivery, a final pass is completed so clients receive the latest updated view rather than an older snapshot.
Mordor Intelligence's Hvac Equipment Market Size Versus Other Published Estimates
Published market sizes for HVAC equipment often differ, even when the topic label looks identical. The spread usually comes from what is counted as equipment versus a broader system view, how retrofit replacement is treated, and whether the current year is a measured base or an early forecast point.
The main gap comes from scope, where services, installation labor, and bundled system revenues are sometimes added to equipment totals, and then differences get widened by unlike assumptions on ASP changes during refrigerant and efficiency transitions. By keeping the 2026 value tied to equipment revenue by type and by new build versus retrofit splits, and by refreshing the pricing inputs during refrigerant changeovers, Mordor Intelligence avoids mixing contractor labor and service revenue into the equipment number.
Benchmark comparison
| Source | Market Size | Gaps in Research Methodology |
|---|---|---|
| Mordor Intelligence | USD 109.33 B (2026) | |
| Global Consultancy A | USD 258.96 B (2025) | Uses a broader HVAC systems revenue view with a 2025 base year, which commonly aggregates wider system definitions and bundled value that can go beyond equipment sales alone. |
| Industry Publisher B | USD 229.22 B (2025) | Uses a 2025 equipment total with different base year timing and category mix assumptions, and may apply alternate price escalation paths across heating and cooling, which shifts the starting level. |
The benchmark spread is largely explained by what is included in the revenue pool and how base year timing is handled. When the market is kept to equipment sales and cross checked against construction, retrofit activity, trade signals, and category level pricing movement, the outcome stays easier to reproduce and to audit during annual refreshes.
Key Questions Answered in the Report
How fast is the HVAC equipment market expected to grow between 2026 and 2031?
The HVAC equipment market is forecast to expand at an 8.11% CAGR from 2026 to 2031, rising from USD 109.33 billion in 2026 to USD 161.46 billion by 2031.
Which equipment type is gaining the most revenue share?
Heating equipment, driven by heat pumps, already commands 58% of heating revenue and outpaces the overall market with an 8.78% CAGR through 2031.
Why are data centers a strategic segment for HVAC suppliers?
Precision-cooling gear achieves 35%-40% gross margins and is advancing at an 8.74% CAGR because AI-driven rack densities require liquid-cooling architectures.
How do European policies affect HVAC demand?
The Energy Performance of Buildings Directive bans new fossil-fuel boilers from 2025 and mandates deep retrofits of the worst 16% of buildings by 2030, generating a sustained heat-pump replacement cycle.
What limits the pace of HVAC installations in the United States?
A technician shortage that could reach 50,000 workers by 2030 has already created a 15% backlog of sold-but-not-installed units, delaying full realization of policy-driven demand.
Which region is poised for the highest percentage growth?
Africa is forecast to lead percentage growth, expanding at a 9.12% CAGR as solar-hybrid packaged units and inverter retrofits gain traction in mining and urban markets.