
Market Overview
| Study Period | 2020 - 2031 |
|---|---|
| Forecast Data Period | 2026 - 2031 |
| Base Year Market Size (2025) | USD 10.74 Billion |
| Market Size (2026) | USD 11.15 Billion |
| Market Size (2031) | USD 13.12 Billion |
| Growth Rate (2026 - 2031) | 3.31 % |
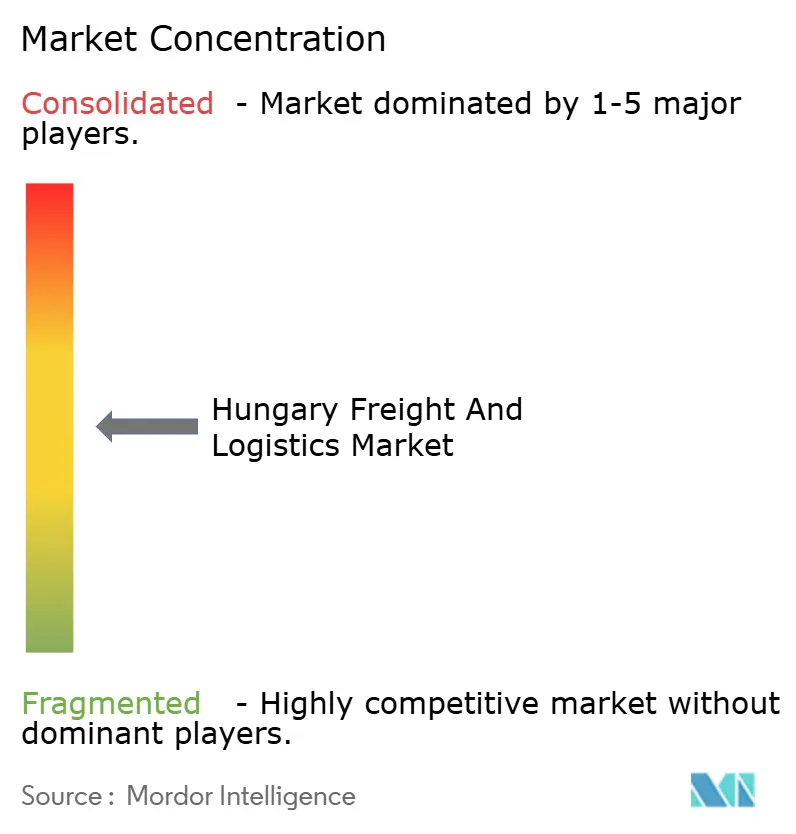
| Market Concentration | Medium |
Major Players *Disclaimer: Major Players sorted in no particular order Image © Mordor Intelligence. Reuse requires attribution under CC BY 4.0. | |
Hungary Freight And Logistics Market Analysis by Mordor Intelligence
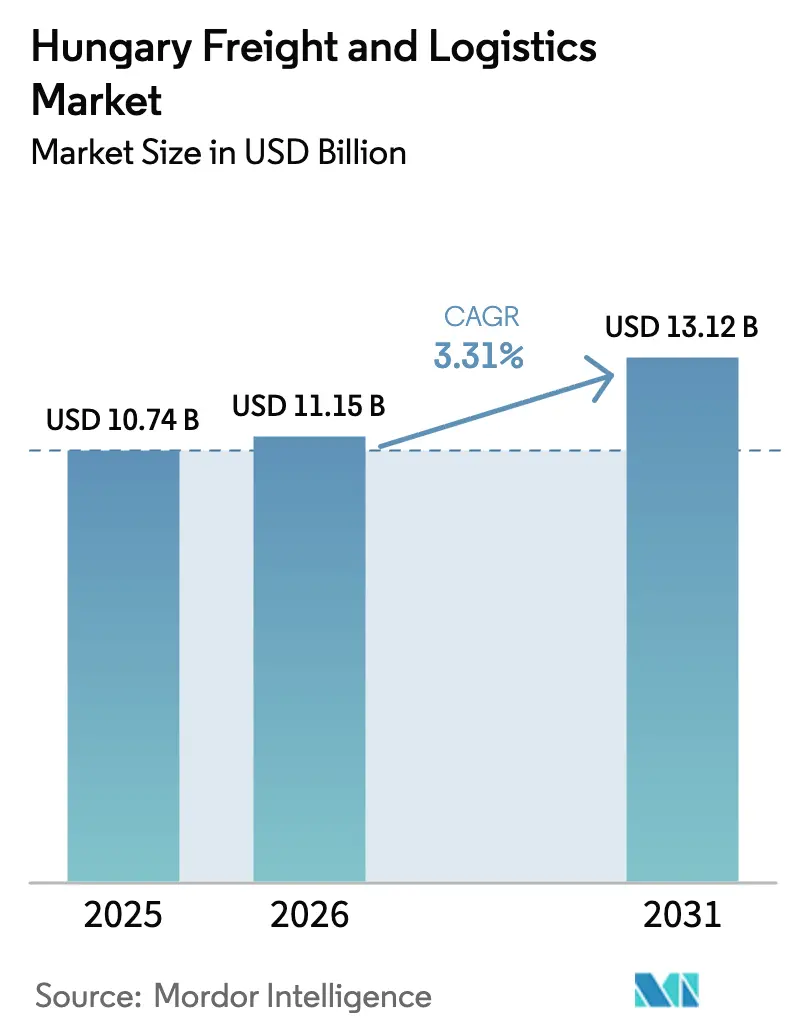
The Hungary Freight And Logistics Market size is estimated at USD 11.15 billion in 2026, and is expected to reach USD 13.12 billion by 2031, at a CAGR of 3.31% during the forecast period (2026-2031).
The Hungary freight and logistics market benefits from its gateway role on the Rhine-Danube and Orient-East Med corridors, steady EU Cohesion Fund inflows, and expanding e-commerce volumes that lift courier, express, and parcel activity. Ongoing motorway and rail upgrades raise service reliability, while a wave of automotive and battery investments anchors long-haul freight volumes. Competitive intensity is moderate, as multinational integrators fight regional specialists for temperature-controlled contracts and just-in-time automotive flows. Labor scarcity, fuel-price volatility, and temporary rail works temper growth, yet digital freight platforms and intermodal hubs continue to unlock productivity.
Key Report Takeaways
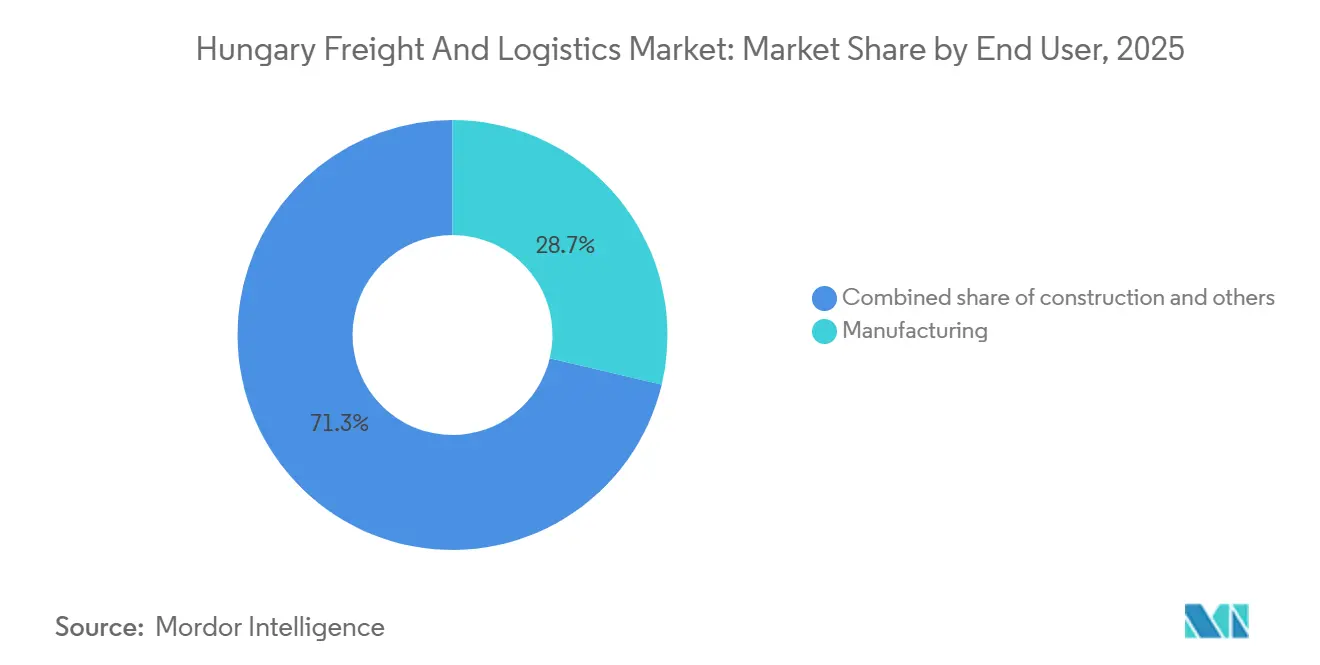
- By end user industry, manufacturing led with 28.72% of the Hungary freight and logistics market share in 2025; Wholesale and Retail Trade is forecast to expand at a 3.74% CAGR through 2031.
- By logistics function, freight transport accounted for 44% of the Hungary freight and logistics market size in 2025, while CEP services are advancing at a 4% CAGR through 2031.
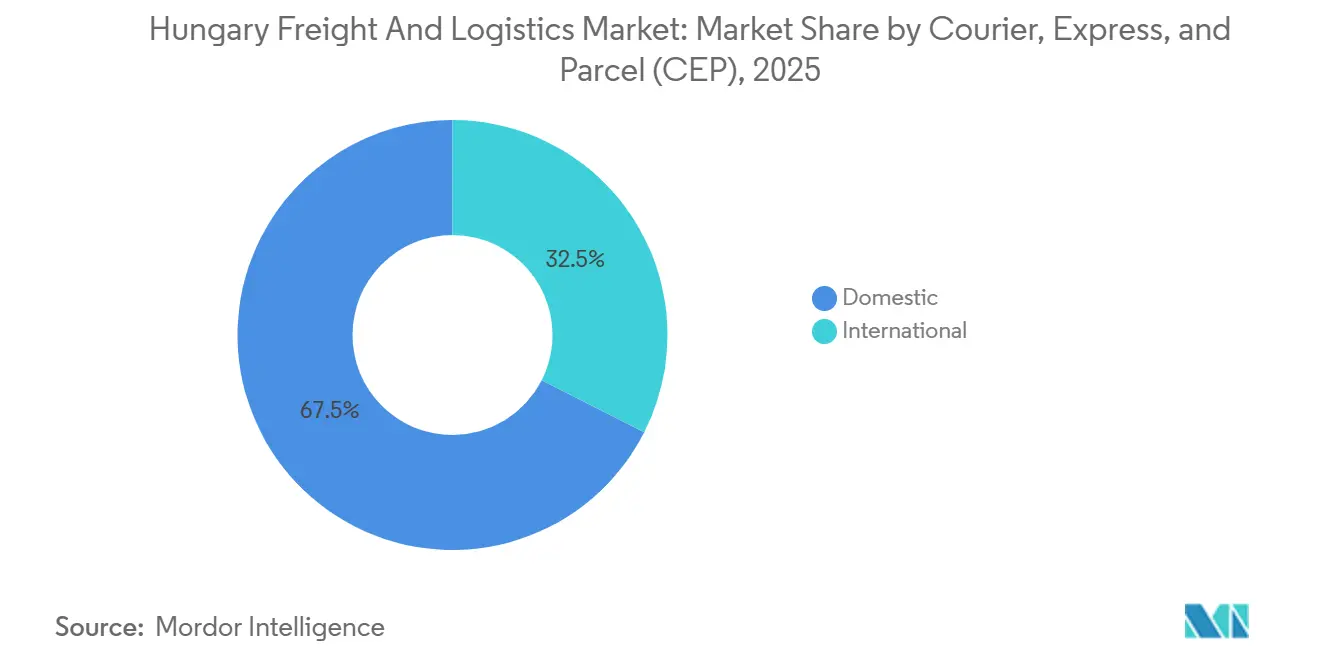
- By CEP destination, domestic shipments captured 67.53% of volume in 2025; international parcels are projected to grow at a 3.83% CAGR through 2031.
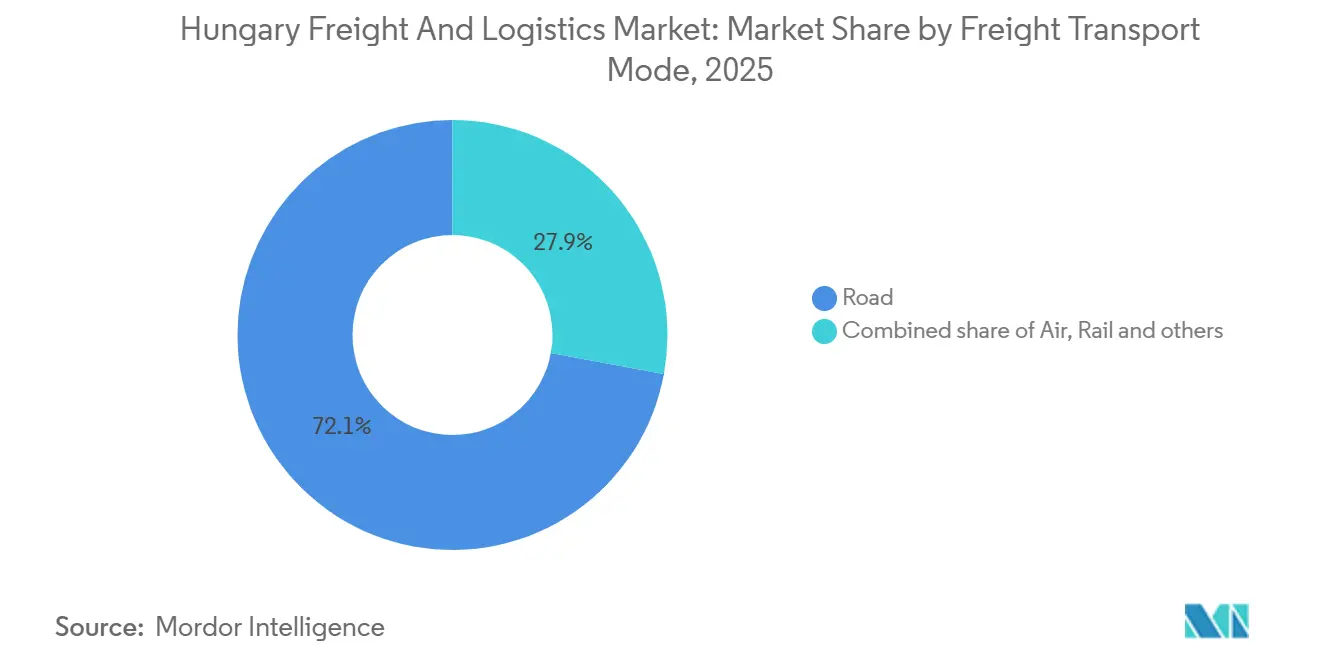
- By freight transport mode, road haulage commanded 72% revenue share in 2025, whereas air cargo is forecast to grow at a 4% CAGR through 2031.
- By warehousing and storage, non-temperature controlled facilities commanded 90.31% of the revenue share in 2025; temperature controlled space is accelerating at a 3.52% CAGR between 2026 and 2031.
- By freight forwarding mode, sea and inland waterways led with 69.87% revenue share in 2025; air forwarding is projected to post a 3.46% CAGR to 2031.
Note: Market size and forecast figures in this report are generated using Mordor Intelligence’s proprietary estimation framework, updated with the latest available data and insights as of January 2026.
Hungary Freight And Logistics Market Trends and Insights
Drivers Impact Analysis*
| DRIVER | (~) % IMPACT ON CAGR FORECAST | GEOGRAPHIC RELEVANCE | IMPACT TIMELINE |
|---|---|---|---|
| Strategic position as EU land-bridge & corridor investments | +0.9% | National, with concentration in Budapest, Győr, Debrecen corridors | Medium term (2-4 years) |
| E-commerce boom spurring last-mile demand | +0.7% | National, urban clusters (Budapest, Debrecen, Szeged) lead adoption | Short term (≤ 2 years) |
| Road & rail upgrades via EU Cohesion Funds | +0.6% | National, priority on TEN-T core network segments | Long term (≥ 4 years) |
| Automotive-battery near-shoring logistics demand | +0.8% | Regional, concentrated in Debrecen, Győr, Kecskemét industrial zones | Medium term (2-4 years) |
| Budapest Airport Cargo City expansion | +0.2% | National, spillover to regional distribution hubs | Short term (≤ 2 years) |
| Digital freight-platform adoption | +0.1% | National, early gains in cross-border lanes | Medium term (2-4 years) |
| Source: Mordor Intelligence | |||
Strategic Position as EU Land-Bridge & Corridor Investments
Hungary’s central position along the Rhine-Danube and Orient-East Med corridors makes it a key transit point between Western Europe and the Balkans. Backed by EUR 370 million (USD 431 million) in EU grants for road, rail, and terminal upgrades, the country is boosting freight capacity. The Budapest-Belgrade double-track line will cut transit times by 40% and shift cargo from road to rail, easing M5 congestion. Greater reliability for automotive and retail flows is driving hub consolidation around Budapest, where developers are adding speculative warehouses near the ring road. Despite short-term congestion during construction, Hungary is strengthening its role as a key European logistics bridgehead.[1]European Commission, “TEN-T Infrastructure,” EC.EUROPA.EU.
E-commerce Boom Spurring Last-Mile Demand
Hungarian e-commerce revenue is forecast to reach EUR 4.8 billion (USD 5.6 billion) by 2028, an 8.2% CAGR that outpaces overall freight growth[2]Statista Analysts, “E-commerce Hungary Outlook,” STATISTA.COM. A 67% cross-border shopping rate pushes integrators to design networks that balance domestic density with pan-regional sortation, driving parcel locker rollouts and micro-fulfillment nodes. GLS Hungary already handles 25 million annual parcels through 1,000 lockers and 50 depots with a 99.7% delivery success rate, a performance rooted in automation and route optimization. Such reliability encourages retailers to promise next-day service nationwide, increasing shipment frequency and shrinking average consignment size. Urban emission zone plans in Budapest accelerate the shift toward electric vans, prompting fleet renewal and charging-hub investment. Consequently, the Hungary freight and logistics market receives a steady influx of high-margin CEP revenue that counterbalances lower-yield bulk transport.
Road & Rail Upgrades via EU Cohesion Funds
Hungary’s EUR 21.7 billion (USD 25.3 billion) Cohesion Fund envelope finances 450 kilometers of motorway rehabilitation, 300 kilometers of rail electrification, and three intermodal terminals, though inflationary pressures extend build schedules by up to 18 months. The M4 extension to the Romanian border opened late-2025 sections that cut eastbound transit times for automotive suppliers. While rail tonnage dipped during corridor works, long-term capacity gains will restore shipper confidence once double-track segments open. Operators that pre-book slots or lease block trains secure a competitive advantage, especially for heavy components moving to Debrecen and Gyor. The Hungary freight and logistics market, therefore, accepts short-term disruptions as a trade-off for durable speed gains and modal diversification.
Automotive-Battery Near-Shoring Logistics Demand
BMW, CATL, and BYD have committed more than EUR 10 billion (USD 11.66 billion) to Hungarian plants, which together add thousands of daily inbound and outbound shipments. BMW Debrecen alone requires 120 just-in-time truck movements per day, while CATL imports lithium compounds via the Port of Koper for rail transfer to Debrecen. These flows demand temperature-controlled containers, bonded warehousing, and real-time visibility, lifting average revenue per shipment. Waberer’s reserved 50 dedicated tractors to safeguard service levels on the corridor, illustrating how asset commitment secures automotive contracts. As battery plants ramp, demand shifts toward outbound finished-module distribution into Western Europe, boosting intermodal rail volumes. The Hungary freight and logistics market thus captures a structural upgrade from commodity bulk to high-value engineered freight.
Restraints Impact Analysis*
| RESTRAINT | (~) % IMPACT ON CAGR FORECAST | GEOGRAPHIC RELEVANCE | IMPACT TIMELINE |
|---|---|---|---|
| Driver shortage & rising labor cost | -0.5% | National, acute in cross-border long-haul segments | Short term (≤ 2 years) |
| Fuel-price & toll volatility | -0.3% | National, disproportionate impact on small owner-operators | Short term (≤ 2 years) |
| Urban emission zones restricting access | -0.1% | Budapest, potential expansion to Debrecen, Szeged | Medium term (2-4 years) |
| Rail bottlenecks during corridor works | -0.2% | National, concentrated on TEN-T core network | Short term (≤ 2 years) |
| Source: Mordor Intelligence | |||
Driver Shortage & Rising Labor Cost
Europe faces a projected shortfall of 745,000 truck drivers by 2028, and Hungarian vacancy rates are already near 1.6%, impeding fleet expansion[3]International Road Transport Union, “Driver Shortage Crisis Worsens,” IRU.ORG. Average gross earnings in the sector grew 9.2% year on year to USD 2,100 in 2025, compressing margins for small fleets that cannot amortize wage hikes across large networks. Operators decline profitable contracts or subcontract at thinner spreads when seats go unfilled, shifting bargaining power toward drivers and agencies. Larger integrators deploy driver-assist systems and work-life scheduling tools to retain staff, but capital outlays raise entry barriers for newcomers. The Hungary freight and logistics market, therefore, experiences gradual consolidation as under-capitalized carriers exit or merge.
Fuel-Price & Toll Volatility
Diesel excise duty hovers near USD 37.50 per hectoliter net, and the CO₂-linked HU-GO toll added up to USD 0.17 per kilometer for older trucks in 2025. Combined with Europe’s highest VAT rate of 27%, pump prices exceed regional averages, straining owner-operators that lack hedging tools. Variable toll surcharges reduce pricing transparency, prompting shippers to request fuel-adjustment clauses that erode carrier negotiating power. Some micro-fleets mothball Euro V assets early, further tightening capacity. The Hungary freight and logistics market thus confronts cost pass-through challenges that favor operators with scale and procurement leverage.
*Our forecasts treat driver/restraint impacts as directional, not additive. The impact forecasts reflect baseline growth, mix effects, and variable interactions.
Segment Analysis
By End User Industry: Manufacturing Anchors Demand, Retail Trade Accelerates
Manufacturing captured 28.72% of the Hungary freight and logistics market share in 2025, driven by automotive, electronics, and pharmaceuticals. Just-in-time assembly at BMW Debrecen and Audi Gyor relies on synchronized inbound steel, semiconductors, and battery cells that transit via both rail and road. Pharmaceutical flows add stringent GDP compliance, pushing carriers to certify warehouses and train staff to secure multi-year contracts. Meanwhile, Wholesale and Retail Trade, the fastest-growing sub-segment, expands at 3.74% CAGR as omni-channel merchants extend fulfillment centers outside Budapest to shorten same-day delivery radii. The Hungary freight and logistics market therefore shifts toward higher service differentiation, with asset-light brokers retreating to commodity cargo as shippers audit carrier certifications.
Retail’s rise stems from cross-border e-commerce habits and disposable-income growth that lifts parcel density. CEP operators overlay parcel lockers on grocery stores, enabling click-and-collect models that reduce failed deliveries. Manufacturing retains absolute tonnage dominance, yet its share declines modestly as consumer-driven flows multiply. Agriculture and construction remain cyclical, linked to harvest yields and public-works budgets, contributing surge demand periods rather than year-round stability. As capital projects conclude, freed capacity redeploys into automotive exports, keeping the Hungary freight and logistics market balanced across industrial and consumer sectors.


By Logistics Function: Freight Transport Dominates, CEP Surges
Freight transport represented 44% of the Hungary freight and logistics market size at USD 4.51 billion in 2025, covering road, rail, air, and inland waterways. Road haulage absorbs just-in-time automotive and supermarket replenishment, while rail shares remain under pressure until corridor upgrades finish. CEP services expand at a 4% CAGR, leveraging dense urban locker networks and automated sortation to achieve sub-24-hour delivery norms. Digitized labels and real-time tracking reduce manual touches, supporting profit margins despite wage inflation.
Warehousing captures 11% of market revenue, with vacancy below 4% in Greater Budapest as e-commerce tenants sign five-year leases for 15,000 m² blocks. Freight forwarding handles 48 billion TKM, benefiting from the Hungary freight and logistics market bridge role for East-West flows. Other services such as customs brokerage and packaging face commoditization, leading to vendor consolidation onto digital platforms that auction shipments to pre-vetted carriers.
By Courier, Express, and Parcel Destination: Domestic Volume, International Growth
Domestic parcels held a 67.53% share in 2025 as Hungary’s 9.7 million residents generated sufficient density for next-day economics. Parcel lockers multiply in suburban malls, allowing two-hour collection windows that improve customer experience and lower last-mile costs. International parcels grow faster at 3.83% CAGR because Hungarian shoppers purchase fashion and electronics from Germany, Italy, and China. Integrators price cross-border consignments at a 30-40% premium, reflecting customs clearance and extended tracking requirements.
Return logistics challenge profitability, as EU rules require transparent duties and recycling of packaging waste. Providers invest in automated customs portals that pre-clear shipments before departure, speeding linehaul transit. The Hungary freight and logistics market thus prizes network flexibility that satisfies both domestic density and international reach without duplicating infrastructure.
By Warehousing and Storage: Ambient Dominates, Cold Chain Expands
Non-temperature-controlled space captured 90.31% market share in 2025, serving automotive parts, fast-moving consumer goods, and general merchandise[4]Cushman & Wakefield Research, “Hungary Market Insights,” CUSHMANWAKEFIELD.COM. Demand clusters within 30 kilometers of the M0 ring road, where occupiers secure highway access and labor pools. Vacancy tightened to 3.5% in Q3 2024, pushing headline rents upward by high-single-digit percentages. Temperature-controlled capacity advances at 3.52% CAGR, propelled by pharmaceutical near-shoring and fresh-food e-commerce. Raben’s Dunaharaszti site combines chilled, 14-18 °C, and ambient chambers, enabling multi-temperature consolidation that reduces secondary handling.
Cold-chain expansion concentrates in Debrecen’s pharma cluster and Budapest Airport’s Cargo City, where GDP compliance and airport proximity justify the 40-50% construction premium. Institutional investors seek inflation-protected leases, driving speculative builds with flexible mezzanine layouts. The Hungary freight and logistics market thus experiences bifurcation between commoditized big-box sheds and premium regulated facilities.
By Freight Transport Mode: Road Reigns, Air Freight Accelerates
Road haulage commanded 72% modal share in 2025, favored for flexibility and reliable transit on the 1,300-kilometer motorway network. Diesel excise and toll surcharges pressure margins, yet operators offset costs through high asset utilization and drop-and-hook systems at automotive plants. Air cargo tonnage at Budapest Airport rose 49% year on year to 200,000 tonnes in H1 2025, on track for 450,000-tonne capacity by 2027. Electronics prototypes, pharmaceuticals, and e-commerce returns favor air because linehaul reliability outweighs rate premiums.
Rail volume dipped during TEN-T works but regains competitiveness once double-track electrified segments open post-2027, enabling 1,200-meter trains that carry 76 TEUs each. Inland waterways remain a niche on the Danube, handling mainly bulk commodities and repositioned empty containers. The Hungary freight and logistics market, therefore, relies on road for capacity and on air for high-value urgency until rail modernization concludes.
By Freight Forwarding Mode: Inland Waterways Lead, Air Gains Share
Sea and inland waterways contributed 69.87% of forwarding revenue in 2025 because Adriatic ports and Danube barge traffic dominate containerized imports. Most flows transit Hungary without domestic origin or destination, limiting local value-added but supporting haulage into Austria and Slovakia. Air forwarding expands at a 3.46% CAGR, anchored by pharmaceuticals and electronics that require sub-24-hour door-to-door delivery. Kuehne + Nagel’s Budapest branch integrates cargo capacity, customs brokerage, and scheduled van routes, capturing end-to-end control for OEMs.
Road and rail forwarding split the remainder, with digital freight platforms matching spot loads and leveraging Hungary’s September 2024 e-CMR adoption for paperless documentation. Waterway competitiveness stagnates due to an empty-container imbalance and aging lock infrastructure south of Budapest. The Hungary freight and logistics market thus prizes forwarding models that bundle mode-neutral capacity with compliance expertise.
Geography Analysis
Budapest, Gyor, and Debrecen together generated about 65% of Hungary's freight and logistics market revenue in 2025, reflecting their combined industrial base, population, and hub infrastructure. Budapest offers airport cargo capacity and Danube barges, attracting integrators and 3PL headquarters. Gyor’s Audi engine plant has surpassed five million units of cumulative production, sustaining feeder part movements and a near-zero vacancy rate below 2% for industrial space. Debrecen emerges as the fastest-growing node as BMW and CATL investments trigger 200 daily truck calls and stimulate cold-chain and bonded-zone demand.
Eastern corridors strengthen following M4 motorway extensions to the Romanian border, shifting share toward Szolnok and Nyíregyháza. Completion of the Budapest-Belgrade rail line in 2027 will shorten Adriatic transit for Kecskemét and Szeged suppliers by 40%, lifting rail’s regional share. Warehouse dynamics diverge: Greater Budapest vacancy remains tight in Q3 2025, while secondary cities hold above 8%, offering expansion options for cost-sensitive retailers. Cross-border lanes to Austria and Slovakia account for roughly 40% of tonnage but face 10-15% compliance-cost increases from the EU Mobility Package social provisions.
EU funds prioritize TEN-T core nodes, skewing grant allocation toward Budapest and Debrecen. Peripheral counties lobby for last-mile projects, but fiscal space narrows as inflation lifts construction costs. The Hungary freight and logistics market thus consolidates along an east-west spine, with secondary hubs gaining only when supported by specific industrial anchors or subsidy schemes.
Regulatory Landscape
Hungary’s freight and logistics regulation is shaped by EU market-access and safety rules, alongside domestic measures aimed at managing heavy-vehicle flows and accelerating digitization. Government Decree 197/2024 (VII. 29.) enacted the Additional Protocol to the CMR Convention in Hungary, enabling electronic consignment notes (e-CMR) for international road freight, and carriers moving cross-border increasingly align processes with paperless documentation requirements.
On road transport compliance and enforcement, the BIREG system remains a mandatory electronic platform for monitoring bilateral and multilateral transport authorizations and cabotage-related activity. Government Decree 375/2025 (XI. 30.) updated legal consequences and technical rules tied to heavy road traffic, reflecting policy intent to keep transit traffic on suitable routes. In June 2026, the Ministry of Construction and Transport issued updated guidance clarifying how January 1, 2026 heavy-vehicle freight traffic rules should be interpreted for routing compliance. Transport-sector reforms in 2025 (Act LV) also adjusted licensing and authority procedures to better align with EU law.
Value Chain Analysis
Hungary’s freight and logistics value chain connects shippers in manufacturing, retail, and pharmaceuticals with forwarders and 3PLs that plan and procure capacity, then with asset operators across road, rail, air, and inland waterways. First-mile collection and linehaul remain road-heavy, while rail-intermodal nodes are taking on more importance for long-distance trunking, especially on East-West lanes. Digital compliance and documentation run across the chain, with electronic tools such as BIREG for permit monitoring and e-CMR supporting cross-border execution and visibility.
Node development is becoming a clearer differentiator in the midstream and downstream of the value chain. In eastern Hungary, Maersk launched dry port and container depot services at the Fenyyeslitke terminal in February 2026, reinforcing the role of inland terminals for container storage, repositioning, and rail-road transfer. In southern and eastern industrial corridors, Metrans confirmed Szeged as the location for its next rail-connected intermodal hub in February 2026, and Debrecen moved toward execution of a new Logistics and Truck Terminal after contractor selection, strengthening first/last-mile interfaces for automotive and battery supply chains. Warehousing developers and investors further support these nodes with big-box and specialized facilities, including projects integrating electric-truck charging, which links real estate, fleet electrification, and last-mile operations into a tighter chain.
Competitive Landscape
The top ten operators command roughly 35-40% of Hungary's freight and logistics market revenue, leaving ample space for regional specialists and digital entrants. DSV’s USD 14.3 billion acquisition of DB Schenker, cleared in April 2025, creates a European giant with deeper contract-logistics capacity, yet faces a 12-month IT integration that risks customer churn. Waberer’s International secured a 62.5% stake in GySEV Cargo, closing in late 2025, giving the domestic champion rail traction that aligns with EU Green Deal modal-shift incentives.
Digital freight platforms partner with traditional forwarders to pool capacity and provide eFTI-ready data, accelerating after Hungary acceded to the e-CMR convention in 2024. DHL Supply Chain renewed a long-term lease at CTPark Budapest East, adding automation that reduces pick times and raises labor productivity. Hellmann Worldwide teamed with Trans.eu in October 2025 to digitize tendering and onboard 100 Hungarian carriers, illustrating how mid-tier players leverage technology to offset scale gaps. Temperature-controlled niches attract capital, as Raben and Logicor build GDP-compliant facilities that command 30-40% rent premiums. Consequently, the Hungary freight and logistics market rewards scale, compliance expertise, and digital transparency, while price-focused micro-fleets either specialize in rural lanes or exit through consolidation.
Hungary Freight And Logistics Industry Leaders
Waberer’s International Nyrt.
Magyar Posta Zrt.
Rail Cargo Hungaria Zrt
DHL Logistics Hungary
DSV Solutions Kft.
- *Disclaimer: Major Players sorted in no particular order

Market Opportunities and Future Outlook
Intermodal and inland-node buildout is expanding addressable service needs beyond pure road haulage, creating whitespace in rail-connected contract logistics, container depot operations, and multimodal forwarding linked to Hungary’s corridor role. Several 2026 moves underline this shift, including Maersk and East-West Intermodal Logistics launching dry port and container depot services at the Fenyyeslitke terminal, and Metrans selecting Szeged for a new rail-connected intermodal hub. Together, these initiatives support higher-frequency rail-road transfers, empty-container management, and time-definite distribution for manufacturers and cross-border retail.
Automotive and battery supply chains are also pulling more specialized logistics capabilities into regional hubs, especially around Debrecen, where just-in-time flows require synchronized transport planning, bonded and compliant warehousing, and end-to-end visibility. In March 2026, Waberer’s launched a long-term logistics partnership with BMW Group for the Debrecen plant, including rail-based finished-vehicle transport using newly developed wagons. On the warehousing side, HelloParks selling its fully let FT1 warehouse at the Fot megapark in May 2026 points to renewed liquidity and institutional participation, supporting further modernization and automation in distribution facilities tied to CEP growth and industrial tenants. At the policy level, the National Logistics Concept 2030-2035 provides an organizing framework that prioritizes combined transport and new terminal programs (including regions such as Gyor and Szeged), which helps sustain a pipeline of bankable projects for operators that can deliver multimodal, compliant, and digitally enabled services.
Recent Industry Developments
- May 2026: Waberer’s International completed the acquisition of a 51% majority stake in Pannon-Busz-Rent Kft., with a call option for the remaining 49% exercisable in 2027. While the deal is centered on passenger transport, it broadens Waberer’s asset base and operating footprint. The expanded footprint supports cross-utilization of depots, maintenance capabilities, and procurement scale that also benefits its logistics operations in Hungary.
- March 2026: Waberer’s launched a long-term logistics partnership with BMW Group for the Debrecen plant, including rail-based finished-vehicle transport using newly developed wagons. This expands Waberer’s involvement in automotive supply chains. It also strengthens cross-border integration with OEM production in Hungary.
- December 2025: Waberer’s delivered a build-to-own logistics center for Magyar Posta in the Budapest agglomeration, adding modern capacity tailored to parcel and postal processing needs. The handover strengthens last-mile and CEP throughput. It raises service levels for domestic deliveries and provides scalable infrastructure for peak-season volumes.


Research Methodology Framework and Report Scope
Market Definition and Coverage
For this methodology, the Hungary freight and logistics market is counted as revenues earned from moving goods and providing logistics services inside Hungary, including domestic and cross-border flows handled by providers active in the country.
Scope exclusions: We exclude passenger transport, pure infrastructure construction, and the value of traded goods themselves (only logistics service revenue is counted).
Segmentation Overview
- By End User Industry
- Agriculture, Fishing, and Forestry
- Construction
- Manufacturing
- Oil and Gas, Mining and Quarrying
- Wholesale and Retail Trade
- Others
- By Logistics Function
- Courier, Express, and Parcel (CEP)
- By Destination Type
- Domestic
- International
- By Destination Type
- Freight Forwarding
- By Mode of Transport
- Air
- Sea and Inland Waterways
- Others
- By Mode of Transport
- Freight Transport
- By Mode of Transport
- Air
- Pipelines
- Rail
- Road
- Sea and Inland Waterways
- By Mode of Transport
- Warehousing and Storage
- By Temperature Control
- Non-Temperature Controlled
- Temperature Controlled
- By Temperature Control
- Other Services
- Courier, Express, and Parcel (CEP)
Data Sources, Market Sizing, and Validation
Desk Research
Desk work starts by aligning on what gets counted as logistics service revenue, and then collecting public indicators that can explain demand and pricing direction. We refer to sources such as Eurostat freight transport statistics, the Hungarian Central Statistical Office (KSH) series, the World Bank macro indicators, UN Comtrade trade values, and customs and transport publications from EU institutions. These inputs help us frame volumes, trade exposure, and inflation effects that feed into logistics pricing in Hungary.
We also review operator disclosures like annual reports and investor presentations, plus association pages and reputable business press, to understand service mix shifts and major network changes. Where needed for cross-checks, we use paid subscriptions for company financials and intelligence, news and financials, patent databases, and a logistics supply chain and freight rate database to sanity check the direction of yields and capacity tightness. These sources are not exhaustive, and many other public and paid references were used to collect data, validate assumptions, and clarify open questions.
Primary Interviews and Surveys
Interviews and surveys cover freight carriers, freight forwarders, warehouse operators, CEP specialists, and logistics managers operating in Hungary. Respondents help clarify the split between domestic and transit activity, test price and utilization assumptions, and explain where reported freight volumes do not translate directly into paid services. Their input is compared with KSH and Eurostat indicators and incorporated into the model where the operating evidence supports a change.
Distribution of primary research fieldwork respondents
| Company type | Respondent position |
|---|---|
| Top tier: 28% | CXOs: 18% |
| Mid tier: 47% | Functional/Unit leaders: 32% |
| Smaller Players: 25% | Managers: 50% |
Market-Sizing & Forecasting
The core sizing starts with a top-down build where freight activity and logistics demand are reconstructed from Hungary trade and production patterns, and then translated into service revenue using mode and service level shares. We then corroborate totals with selective bottom-up approximations, such as a sampled revenue roll-up of visible operators, and simple volume times average price checks for key services to adjust for under-coverage.
A few practical inputs are tracked closely because they move this market year to year. These include industrial output and export import trends, road and rail freight intensity, warehouse space absorption and vacancy direction, fuel and labor cost movements that influence rate resets, and the share of cross-border flows driven by regional manufacturing supply chains. For forecasting, scenario analysis is used so the model can reflect different paths for trade growth, cost inflation, and logistics outsourcing, and then be aligned to expert views from interviews. Where bottom-up data is missing for smaller providers, gaps are handled through informed scaling using employment and fleet intensity indicators rather than assuming a flat share.
Data Validation & Update Cycle
Outputs are checked against independent signals like transport volume direction, trade growth, and logistics price pressure discussed by operators, before totals are finalized. Large year-on-year jumps are reviewed, and if the cause is not clear, we re-check the underlying assumptions and re-contact sources to confirm what changed.
An internal review is completed in steps so the calculation logic, inputs, and final totals are consistent across the time series. The report is refreshed annually, and interim updates are done when material events occur that can shift rates or volumes. Before delivery, we run a fresh pass to ensure the latest public data and key market developments are reflected.
Mordor Intelligence's Hungary Freight and Logistics Market Size Compared With Other Published Estimates
Published market values for Hungary freight and logistics can look different because the scope is not always identical, and the conversion from activity to revenue can be handled in many ways. The biggest differences usually come from what services are counted, whether cross-border handling is included, and how pricing is updated for fuel, labor, and contract timing.
The benchmark table shows a tighter range around the 2026 value, and then a wider split in longer horizon projections. In Mordor Intelligence's model, the market is counted as logistics service revenue earned for freight movement and related services tied to Hungary activity, and adjacent items like passenger transport and pure infrastructure work are kept outside the total, which can pull estimates down versus broader definitions.
Benchmark comparison
| Source | Market Size | Gaps in Research Methodology |
|---|---|---|
| Mordor Intelligence | USD 11.15 B (2026) | |
| Regional Consultancy A | USD 11.22 B (2026) | Often differs on what is treated as in-scope logistics revenue, especially when courier and value-added services are blended into a single total without clear separation from non-logistics support services. |
| Industry Publisher B | USD 12.10 B (2026) | Typically applies a more aggressive price escalation across the forecast window, and can overstate near-term revenue if fuel pass-through and contract reset timing are assumed to be immediate for most volumes. |
Overall, the spread is explained less by demand direction and more by definitional choices and pricing translation from activity to revenue. By keeping the steps traceable to trade and production signals, and then pressure-testing them with operator feedback on rate resets and mix, we get a practical estimate that can be repeated and updated with each new data release.


Key Questions Answered in the Report
What is the current value of the Hungary freight and logistics market?
The market is valued at USD 11.15 billion in 2026 and is forecast to reach USD 13.12 billion by 2031.
How fast is the Hungary freight and logistics market growing?
Aggregate revenue is projected to advance at a 3.31% CAGR between 2026 and 2031.
Which end-user segment contributes the largest share?
Manufacturing leads with 28.72% share due to automotive, electronics, and pharmaceutical production.
Which logistics function is expanding the quickest?
Courier, express, and parcel services are growing at about 4% CAGR, outpacing other functions.
What infrastructure projects most influence future growth?
The Budapest–Belgrade double-track rail line and ongoing motorway expansions under the EU Cohesion Fund substantially raise capacity and speed post-2027.
Page last updated on:


 Your data is secure and never sold or shared.


