
Humidity Sensors Market Size and Share
Market Overview
| Study Period | 2020 - 2031 |
|---|---|
| Market Size (2026) | USD 739.5 Million |
| Market Size (2031) | USD 985.45 Million |
| Growth Rate (2026 - 2031) | 5.91 % |
| Fastest Growing Market | Asia Pacific |
| Largest Market | Asia Pacific |
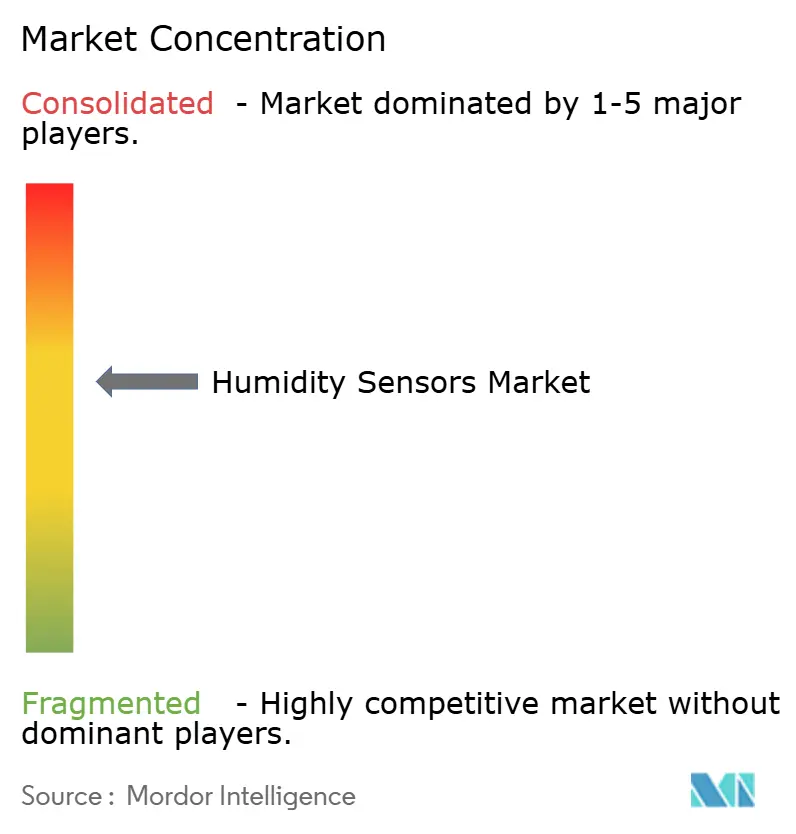
| Market Concentration | Medium |
Major Players *Disclaimer: Major Players sorted in no particular order Image © Mordor Intelligence. Reuse requires attribution under CC BY 4.0. | |
Humidity Sensors Market Analysis by Mordor Intelligence
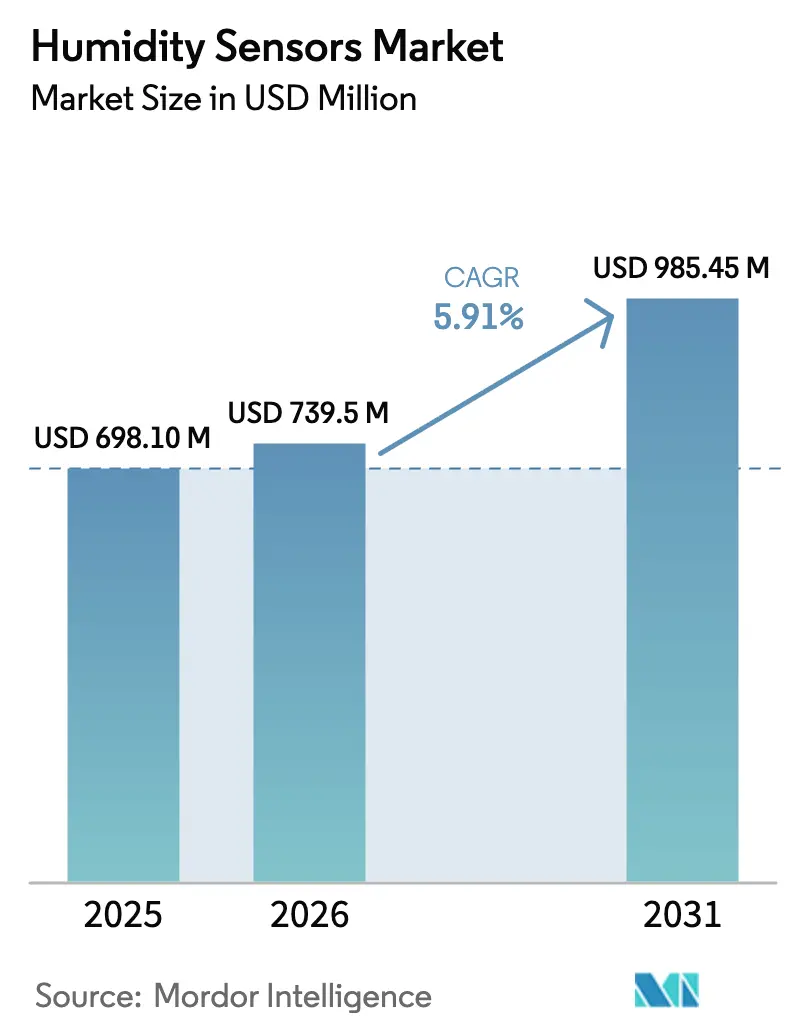
The Humidity Sensors Market size was valued at USD 698.10 million in 2025 and is estimated to grow from USD 739.5 million in 2026 to reach USD 985.45 million by 2031, at a CAGR of 5.91% during the forecast period (2026-2031).
Momentum stems from a global pivot to MEMS-based digital platforms that consolidate edge processing, a migration hastened by electric-vehicle battery safety mandates and stricter pharmaceutical cold-chain regulations. Semiconductor fabs in Taiwan and South Korea, as well as wide-scale HVAC retrofits across India, Indonesia, and Vietnam, collectively amplify unit demand, alongside rising greenhouse installations in North America. Vendors are also responding to a surge in aftermarket orders placed through e-commerce portals as operators retrofit legacy HVAC and industrial lines rather than replace full systems. Competitive dynamics are shifting as semiconductor majors harness wafer-scale integration to pressure discrete-module incumbents on cost, while still meeting the sub-1 % accuracy and sub-1 milliwatt standby-power thresholds required by wearables and IIoT nodes.[1]
Key Report Takeaways
- By sensor technology, polymer resistive devices held 32.40% of the 2025 revenue pie, while MEMS-based digital sensors are advancing at a 6.40% CAGR through 2031.
- By measurement parameter, relative humidity commanded 46.00% share in 2025 and is on track to expand at a 7.70% CAGR to 2031.
- By end-user industry, building automation and HVAC accounted for 24.70% of 2025 sales, whereas automotive applications post the fastest growth at a 6.00% CAGR.
- By distribution channel, OEM integration captured 52.20% of 2025 shipments, while the e-commerce route is scaling at a 7.20% CAGR.
- By geography, Asia-Pacific contributed 36.90% of global 2025 revenue and is projected to log a 6.90% CAGR through 2031.
Note: Market size and forecast figures in this report are generated using Mordor Intelligence’s proprietary estimation framework, updated with the latest available data and insights as of January 2026.
Market Trends and Insights
Drivers Impact Analysis of Humidity Sensors Market*
| Driver | (~) % Impact on CAGR Forecast | Geographic Relevance | Impact Timeline |
|---|---|---|---|
| Accelerating Miniaturization for Wearables | +1.2% | Asia-Pacific, North America | Medium term (2-4 years) |
| Rising HVAC Retrofit Projects in Emerging Economies | +1.0% | Asia-Pacific, Middle East, South America | Long term (≥ 4 years) |
| Stringent Pharmaceutical GMP Humidity Controls | +0.9% | North America, Europe | Short term (≤ 2 years) |
| Electric-Vehicle Battery Thermal Safety Needs | +0.8% | China, Europe, North America | Medium term (2-4 years) |
| Demand for Edge-Ready IIoT Environmental Nodes | +0.7% | North America, Europe | Medium term (2-4 years) |
| Carbon-Credit-Linked Greenhouse Monitoring | +0.5% | North America, Europe, Asia-Pacific, South America | Long term (≥ 4 years) |
| Source: Mordor Intelligence | |||
Accelerating Miniaturization for Wearables
Wearable brands are now integrating humidity sensing to differentiate themselves through sweat rate, skin hydration, and ambient condition data, rather than relying solely on step counts. Bosch Sensortec’s BME690, released in 2024, merges a MEMS humidity element and AI algorithm inside a 3 mm × 3 mm land-grid package that draws just 0.1 mA in low-power mode.[2] Analog Devices followed with the MAX32672 microcontroller, which embeds sensor interfaces on-die to eliminate the need for discrete boards. Wafer-level chip-scale and fan-out packaging now reduces board real estate by up to 70%, enabling sub-2 mm² footprints. As component counts fall, device makers compress design cycles to match six-month model refreshes. Vertically integrated semiconductor houses gain a cost edge because they can co-optimize MEMS and logic on the same line, a hurdle for discrete-sensor specialists.
Rising HVAC Retrofit Projects in Emerging Economies
Cooling demand in Southeast Asia, the Middle East, and South America is increasing as urban populations expand and average temperatures rise. The International Energy Agency projects that ASEAN's space-cooling energy use will triple by 2040 compared to 2020. Variable-refrigerant-flow systems, coupled with humidity-responsive controls, cut energy consumption by 20-30%, encouraging building owners to replace stand-alone humidistats with networked arrays. Saudi Arabia’s 2024 green-building code mandates humidity sensing in new commercial HVAC and subsidizes retrofits. Electricity tariffs are rising faster than equipment costs, particularly in India, where commercial rates climbed 8% annually between 2020 and 2025, further strengthening retrofit economics. Suppliers benefit from steady demand for plug-and-play sensors that avoid lengthy plant shutdowns.
Stringent Pharmaceutical GMP Humidity Controls
The revised 2024 WHO guidance requires continuous monitoring with calibrated probes traceable to national metrology institutes and automated alerts outside 30%-70% relative humidity windows. The U.S. FDA’s concurrent update reinforces ICH Q1A protocols and requires ±2% RH accuracy during storage-zone mapping. Contract manufacturers and third-party logistics providers must now provide regulators with electronic audit trails, which is driving the adoption of cloud-linked sensor networks. Demand intensifies for NIST-traceable devices offering sub-1% drift over five years, as biologics and cell- and gene therapies are more moisture-sensitive than small-molecule drugs. Failure to meet the new thresholds risks warning letters and lost contracts, creating a compliance-driven replacement cycle.
Electric-Vehicle Battery Thermal Safety Needs
Humidity excursions within lithium-ion battery packs promote dendrite growth and electrolyte degradation, thereby increasing thermal runaway risks. Tesla’s 2024 patents outline dew-point sensors at module interfaces that flag moisture ingress before condensation forms. An IEEE 2025 white paper cites humidity intrusion as a leading driver of capacity fade, recommending MEMS sensors qualified for continuous operation at 85 °C. The migration to lithium-iron-phosphate chemistries, while safer thermally, heightens moisture sensitivity, and 800-volt powertrains further narrow allowable humidity bands. Automakers therefore place redundant sensors inside packs and cabins, leveraging shared supply chains to reduce bill-of-materials costs.
Restraints Impact Analysis of Humidity Sensors Market*
| Restraint | (~) % Impact on CAGR Forecast | Geographic Relevance | Impact Timeline |
|---|---|---|---|
| Calibration Drift in Polymer-Based Sensors | -0.8% | Tropical Asia and South America | Short term (≤ 2 years) |
| Limited Adoption in Extreme-Temperature Oilfields | -0.5% | Middle East, North America, Russia, offshore zones | Medium term (2-4 years) |
| High IP Barriers for MEMS-Level Packaging | -0.4% | Asia-Pacific, North America manufacturing hubs | Long term (≥ 4 years) |
| Supply-Chain Concentration of Specialty Dielectrics | -0.3% | Global dependence on East Asian suppliers | Medium term (2-4 years) |
| Source: Mordor Intelligence | |||
Calibration Drift in Polymer-Based Sensors
Low-cost polymer resistive and capacitive devices experience an annual accuracy loss of 2-5% RH due to aging, contamination, and hysteresis. An IEEE Sensors Journal article from 2025 reported irreversible sensitivity shifts of over 10% RH within 12 months when exposed to volatile organic compounds. NIST’s 2024 calibration guide recommends yearly verification against saturated-salt standards, which can reduce five-year ownership costs by up to 40%. High-humidity tropical zones accelerate polymer swelling, shortening recalibration intervals. Because most polymer units require factory, not field, recalibration, HVAC and warehouse operators often delay replacements, which slows market penetration for higher-spec devices.
Limited Adoption in Extreme-Temperature Oilfields
Downhole and wellhead environments exceed 150 °C and 20,000 psi, conditions that overwhelm typical polymer or MEMS humidity sensors. Fiber-Bragg-grating optical alternatives withstand the heat but remain expensive, limiting deployment to offshore deepwater or unconventional wells. Operators in shale basins rely on periodic testing, rather than continuous monitoring, which suppresses sensor volumes. Corrosive hydrogen sulfide and hydrocarbon vapors can foul membranes within months, thereby increasing maintenance costs and expenses. Until vendors commercialize robust, economical high-temperature technology, uptake in oil and geothermal projects will lag.
*Our forecasts treat driver/restraint impacts as directional, not additive. The impact forecasts reflect baseline growth, mix effects, and variable interactions.
Humidity Sensors Market Segment Analysis
By Sensor Technology:
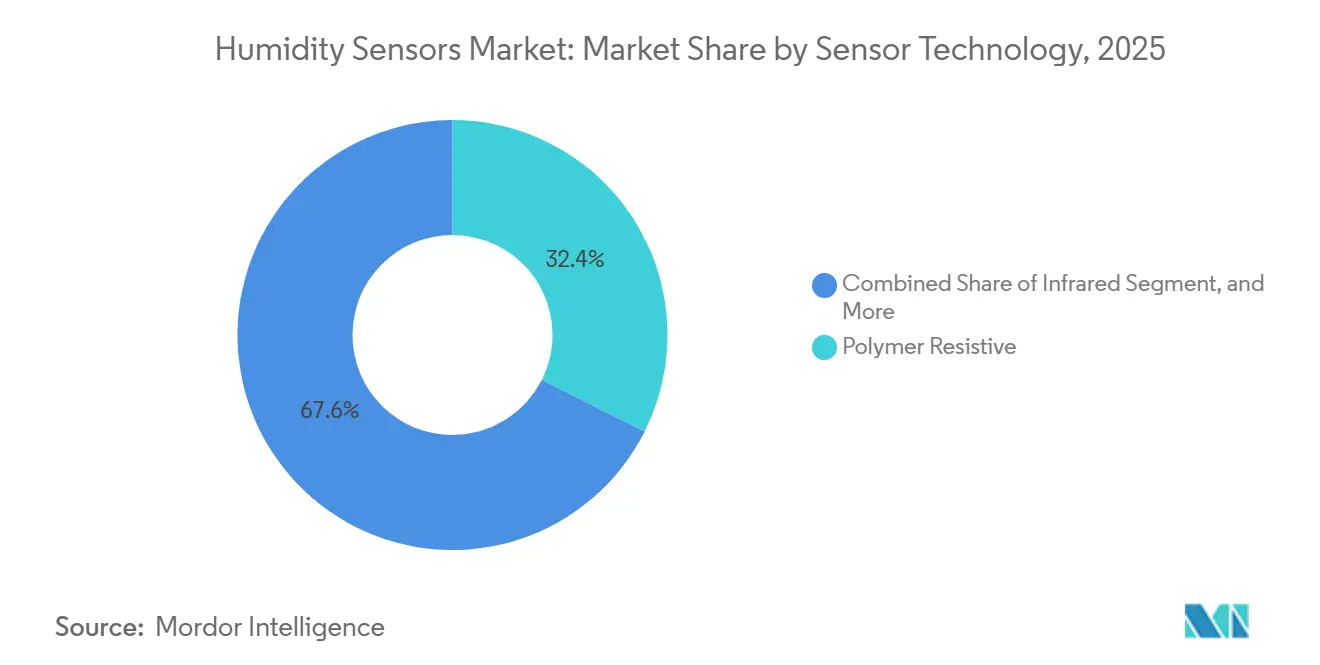
MEMS Digital Variants Outpace Legacy PlatformsThe humidity sensors market size attributed to polymer resistive devices was significant in 2025, when the segment secured a 32.40% share of the overall humidity sensors market value. MEMS-based digital sensors, however, are pacing the gains with a 6.40% CAGR to 2031, reflecting their ability to integrate analog-to-digital conversion, temperature compensation, and serial communication onto a single die.
Infrared and cooled-mirror hygrometers retain their niche in the laboratory because they deliver reference-grade accuracy but command prices above USD 5,000 per unit. Aluminum-oxide capacitive elements remain relevant for compressed-air and oven applications where sub-zero dew points are a concern, although the risk of contamination limits their broader adoption. Optical-fiber sensors, immune to electromagnetic interference, win orders in MRI suites and high-voltage substations. Vendors such as Vaisala transitioned to modular designs with the Indigo 200 series, enabling probe head swaps to reduce inventory complexity.

By Measurement Parameter:
Relative Humidity Dominates, Dew Point Gains in Process IndustriesRelative humidity secured 46.00% of 2025 revenues and anchors the measurement landscape due to its inclusion in nearly every HVAC and consumer electronics control loop. With a 7.70% CAGR, the metric remains the fastest climber, underscoring its lock-in due to building codes and industrial standards.
Dew-point sensing, while smaller, is gaining traction in compressed-air, natural-gas, and pharmaceutical spray-drying lines where moisture must be quantified independently of temperature swings. Michell Instruments’ DMT152, which measures to −60 °C dew point, supports petrochemical dryers and industrial gas processors. Absolute humidity is favored in controlled-environment agriculture because vapor-pressure deficit calculations improve crop yields.
By End-User Industry:
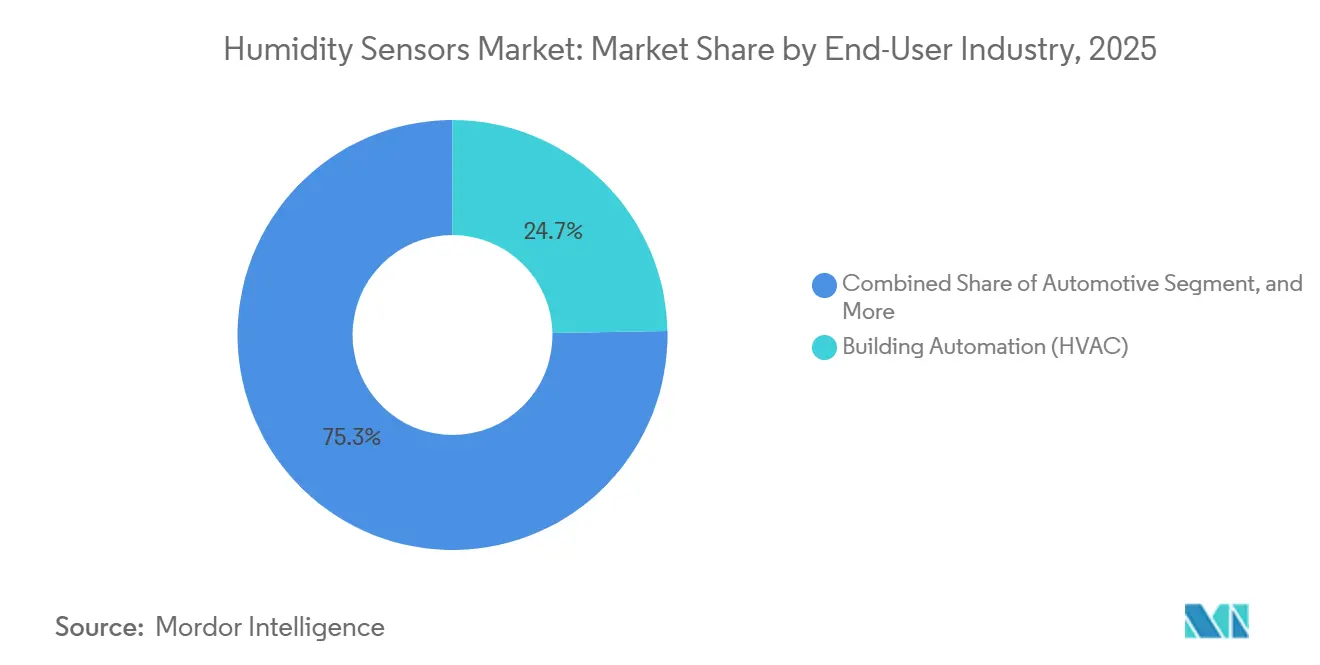
Automotive Electrification Outpaces Building AutomationBuilding automation and HVAC generated 24.70% of the 2025 turnover, benefiting from heat pump rollouts and smart thermostat retrofits. Yet, the automotive segment leads growth with a projected 6.00% CAGR, as battery packs and cabin systems embed redundant sensors to manage condensation and extend range.
Semiconductor fabs follow close behind; operators in Taiwan, South Korea, and the United States must hold cleanrooms to ±1% RH to avoid electrostatic discharge on sub-3 nm lines. Pharmaceutical producers expand demand through biologics, and food-and-beverage plants utilize sensors in fermentation, grain storage, and cold chains. Oil and gas, power generation, and pulp and paper each constitute smaller but stable end-markets.
By Distribution Channel:
E-Commerce Disrupts OEM-Dominated LandscapeOEM integration represented 52.20% of 2025 shipments because appliance, automotive, and industrial manufacturers lock in multi-year contracts to secure their supply. Still, e-commerce posts the fastest momentum at a 7.20% CAGR as small and mid-sized enterprises order replacement sensors online. Component marketplaces, such as Digi-Key, Mouser, and regional peers, offer parametric search engines that reduce procurement lead times from weeks to days, eroding the OEM channel’s convenience advantage.
Aftermarket installers appreciate drop-in digital sensors that extend asset life without plant downtime, particularly in facilities where capital budgets are frozen. OEM channels will remain dominant for safety-critical sectors such as medical and automotive, where qualification and warranty coverage justify higher prices.
Geography Analysis
APAC Humidity Sensors Market
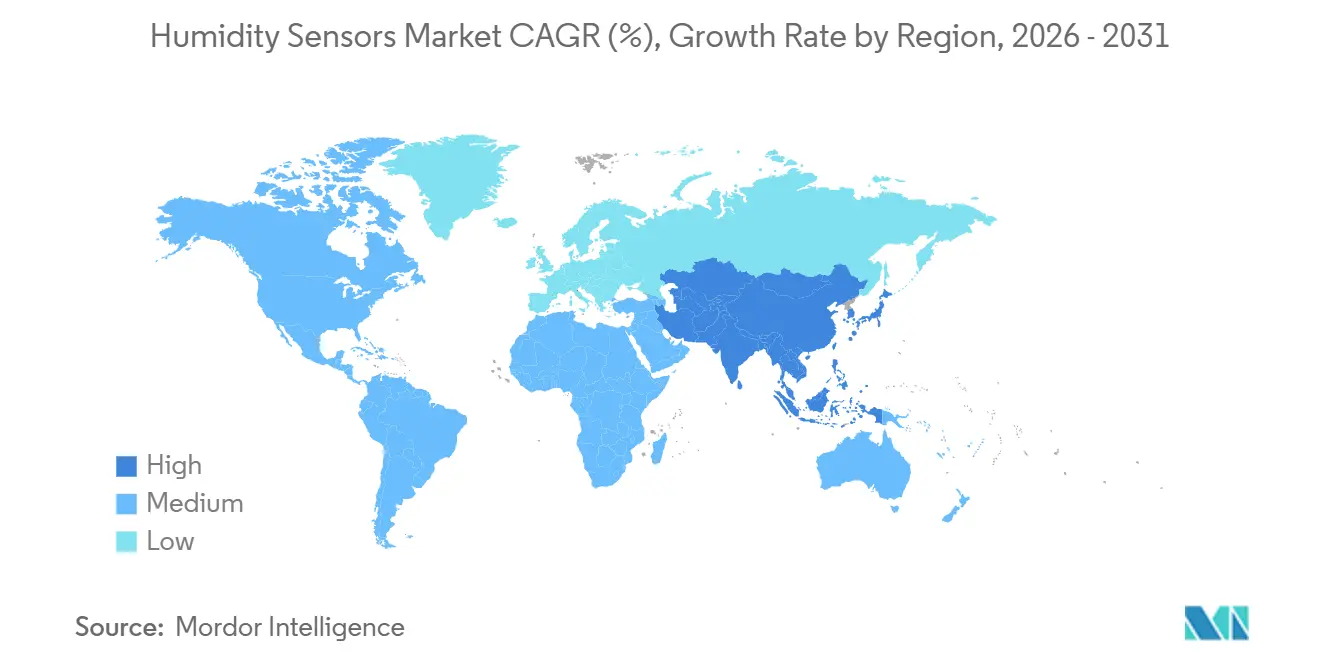
The Asia-Pacific region generated 36.90% of the global humidity sensors market revenue in 2025 and is projected to record a 6.90% CAGR from 2026 to 2031. Demand concentrates in semiconductor fabs across Taiwan and South Korea, electric-vehicle production in China, and government-incentivized HVAC retrofits in India and Southeast Asia. Japan is following the trend, exemplified by Hitachi High-Tech’s 2025 factory in Yamanashi, which manufactures cleanroom monitor systems featuring Vaisala probes.[3] India’s Bureau of Energy Efficiency now requires humidity-sensing controls in higher-capacity air conditioners, lifting sensor content per unit.
North America Humidity Sensors Market
North America ranks second, driven by pharmaceutical storage upgrades, data center construction, and electric vehicle assembly lines. The U.S. EPA’s 2024 semiconductor air-pollutant standards tightened humidity windows inside fabs, prompting sensor network retrofits. Canada’s federal heat-pump subsidies likewise seed residential demand.
EMEA and South America Humidity Sensors Market
Europe is experiencing solid expansion, driven by the installation of heat pumps, which surpassed 500,000 units in Germany by 2024. The Middle East pursues megaprojects such as NEOM and Masdar City, which incorporate integrated environmental monitoring. South America’s growth clusters in Brazil’s food processing and pulp-and-paper mills, while Africa remains nascent, with uptake limited to pharmaceutical cold-chain and Tier-III data centers.
Regulatory Landscape
Global demand for humidity sensors is closely linked to appliance and building-control compliance regimes, where safety and performance requirements constrain allowable sensor architectures. IEC published IEC 60730-2-13:2025 (August 2025) for humidity-sensing controls in household and building-automation equipment, which supports conformity testing and documentation that sensor and control suppliers need to provide in OEM programs.
Energy-efficiency and metrology requirements also tighten selection criteria around traceability. In the United States, the DOE dehumidifier test method under 10 CFR Part 430 Appendix X1 (2024 edition) embeds humidity-sensor accuracy requirements within the uniform measurement framework used for energy labeling and certification. China issued GB/T 19405.4-2025 (December 31, 2025) covering packaging, labeling, and handling of moisture-sensitive devices, and GB/T 11605-2026 (May 25, 2026) on methods of humidity measurement, increasing compliance workload for suppliers shipping into China. For meteorological sensing, ISO 8932-2:2026 (May 2026) adds laboratory calibration test methods for radiosonde humidity sensors, reinforcing standardized calibration workflows and traceability expectations in regulated end uses.
Value Chain Analysis
The humidity sensor value chain begins with MEMS and thin-film material inputs, wafer fabrication, and packaging steps that shape long-term stability and contamination resistance. It then extends into module assembly and application-layer firmware and algorithms for compensation and diagnostics. As buyers move toward multi-parameter indoor-air-quality and IIoT nodes, suppliers increasingly bundle humidity sensing with temperature, particulate, and gas measurements inside integrated modules, shifting value capture from discrete elements to calibrated, digitally interfaced platforms.
Downstream, OEM integration remains the main anchor for high-volume programs, while catalog and e-commerce distribution supports retrofit and maintenance demand. Channel and partnership strategy is also a lever in this chain. In October 2025, Sensirion expanded its global distribution network by appointing Avnet, improving availability and logistics reach for OEMs and smaller integrators. Platform collaborations connect sensing with connectivity and reference designs as well, such as the September 2025 Bosch Sensortec and Espressif collaboration around the ESP-SensairShuttle platform that pairs Bosch MEMS environmental sensors with Espressif wireless SoCs to shorten validation cycles for connected building and industrial deployments.
Competitive Landscape
The top five suppliers, Sensirion, Honeywell, Bosch Sensortec, TE Connectivity, and Texas Instruments, control roughly 45-50% of the global revenue, resulting in a moderately fragmented humidity sensors market. Sensirion reported CHF 103.7 million (USD 117.3 million) in first-half 2025 sensor income, down 14.8% year over year because consumer-electronics inventories were flushed. TE Connectivity, by contrast, delivered 17% organic growth in its sensor segment during Q4 2025, aided by the April 2025 acquisition of Richards Manufacturing, which adds hermetic packaging for harsh environments.
Semiconductor giants STMicroelectronics, Infineon, and Renesas leverage wafer fabs to drive unit costs below USD 1 in high volume, capturing design wins in wearables and automotive modules. Patent filings for hermetic MEMS encapsulation, through-silicon vias, and wafer-level sealing rose 15% in 2024, surpassing 200 grants at the USPTO. Cross-licensing pacts guard freedom to operate, while litigation risk elevates the barriers for start-ups.
Partnerships and vertical integration accelerate: STMicroelectronics and Qualcomm teamed in October 2024 to co-develop Bluetooth-enabled IoT sensor modules that pair MEMS humidity elements with wireless radios. Smaller players differentiate themselves through application focus; ProGlove, for instance, embeds sensors in wearable barcode scanners to track warehouse comfort levels, although its aggregate revenue trails that of the majors.
Humidity Sensors Industry Leaders
-
Honeywell International Inc.
-
Sensirion AG
-
Bosch Sensortec GmbH
-
Texas Instruments Incorporated
-
TE Connectivity Ltd
- *Disclaimer: Major Players sorted in no particular order
Humidity Sensors Market Companies Covered in this Report
- General Electric Company
- Honeywell International Inc.
- Bosch Sensortec GmbH
- Sensirion AG
- Texas Instruments Incorporated
- TE Connectivity Ltd
- Amphenol Advanced Sensors
- STMicroelectronics International NV
- Laird Connectivity
- E+E Elektronik GmbH
- Michell Instruments Ltd
- Renesas Electronics Corporation
- Infineon Technologies AG
- Omron Corporation
- ProGlove GmbH
- NXP Semiconductors NV
- Analog Devices Inc.
- Murata Manufacturing Co. Ltd
- Seiko Epson Corporation
- Vaisala Oyj
Market Opportunities and Future Outlook
Opportunities cluster where compliance, uptime expectations, and digital integration requirements push buyers away from low-cost polymer elements toward calibrated, digitally interfaced modules and traceable workflows. Pharmaceutical storage and logistics, semiconductor cleanrooms, and regulated HVAC applications create room for NIST- or national-metrology-traceable calibration services, automated audit trails, and low-drift designs, consistent with the report focus on stricter GMP humidity controls and demand for sub-1% drift over longer service intervals.
On the supply side, expanding capacity and broader module availability support wider deployment of integrated environmental platforms across buildings, industrial sites, and smart agriculture. Sensirion pointed to manufacturing scale-up in Hungary, including a Debrecen site expansion program and a June 2026 milestone of producing its 25 millionth product at that facility, which indicates added supply depth for module and sensor shipments. Productized platforms also widen adoption beyond discrete components, including Sensirion's announcement of global availability of its SEN62 environmental sensing platform (PM, humidity, and temperature), designed for use cases where integrators want a ready-to-deploy sensing stack rather than a single-sensor qualification.
Recent Industry Developments in Humidity Sensors Market
- April 2026: Sensirion announced global availability of the SEN62 environmental sensing platform, integrating particulate monitoring with humidity and temperature sensing. The move strengthens the shift from discrete sensors toward pre-validated modules that simplify design-in for indoor air quality and building automation deployments. It also expands the addressable base of integrators that prioritize time-to-market and standardized interfaces over custom calibration work.
- November 2025: Sony and Internet Initiative Japan formed a joint venture to market smart-agriculture nodes combining soil moisture and humidity monitoring over cellular links, targeting deployment of 10,000 devices by end-2026. The initiative pulls humidity sensing into packaged, connected field nodes, expanding volume potential beyond traditional HVAC and industrial installations. It also reinforces the role of connectivity partners and service platforms in scaling distributed environmental sensing.
- October 2024: STMicroelectronics and Qualcomm teamed to co-develop Bluetooth-enabled IoT sensor modules pairing MEMS humidity elements with wireless radios. This type of co-development supports tighter hardware-software integration and can reduce qualification friction for edge-ready environmental nodes. It also increases competitive pressure on standalone discrete-module suppliers by bundling sensing with connectivity roadmaps.
Humidity Sensors Market Report Scope and Research Methodology
Market Definition and Coverage
For this methodology, the humidity sensors market covers revenues generated from sensors used to measure humidity, typically relative humidity, across end-user applications like industrial, automotive, medical, HVAC, and consumer electronics.
Scope exclusions: We exclude standalone HVAC systems, controllers, and building management software when humidity sensing is not the primary product being sold.
Segments Covered in This Report
- By Sensor Technology
- Infrared
- Bimetallic
- Cooled Mirror
- Aluminum Oxide Capacitive
- Polymer Resistive
- MEMS-Based Digital
- Optical Fiber
- By Measurement Parameter
- Relative Humidity
- Absolute Humidity
- Dew Point
- By End-User Industry
- Chemical and Petrochemical
- Building Automation (HVAC)
- Automotive
- Oil and Gas and Natural Gas
- Pharmaceutical
- Semiconductor
- Power Generation
- Food and Beverage
- Paper and Pulp
- Water, Wastewater, and Incineration
- Consumer Electronics
- Rest of End-User Industries
- By Distribution Channel
- OEM Integration
- Aftermarket / Retrofit
- E-Commerce
- By Geography
- North America
- United States
- Canada
- South America
- Brazil
- Rest of South America
- Europe
- Germany
- United Kingdom
- France
- Italy
- Spain
- Russia
- Rest of Europe
- Asia-Pacific
- China
- Japan
- India
- South Korea
- Australia and New Zealand
- Rest of Asia-Pacific
- Middle East
- Saudi Arabia
- United Arab Emirates
- Turkey
- Rest of Middle East
- Africa
- South Africa
- Nigeria
- Egypt
- Rest of Africa
- North America
Data Sources, Market Sizing, and Validation
Desk Research
Desk research helped us set the base structure of the market and align the definition before we started modeling. We relied on public and official information such as US Census Bureau trade data, UN Comtrade summaries, ISO and IEC standards references for humidity measurement, and technical publications from bodies such as NIST that describe calibration and sensing principles.
We also reviewed company filings, investor presentations, product catalogs, and reputable press to understand where sensors are used, how pricing is moving, and what new designs are being launched. Patent databases were used selectively to track innovation direction (for example, shifts toward digital interfaces and smaller form factors), and a paid subscription source for company financials and intelligence was used to validate reported revenue mixes where available. The sources listed here are illustrative, and many other public documents and reference sources were also used for data collection, validation, and clarification.
Primary Interviews and Surveys
Primary work focused on validating demand drivers and pricing logic with people who sell, specify, or integrate humidity sensing in real deployments. We spoke with respondents across APAC, EMEA, and the Americas, covering device makers, component distributors, and end users in HVAC, industrial automation, automotive, and healthcare so gaps from desk inputs could be closed with practical checks.
Distribution of primary research fieldwork respondents
| Company type | Respondent position | Region |
|---|---|---|
| Top tier: 31% | CXOs: 15% | APAC: 43% |
| Mid tier: 52% | Functional/Unit leaders: 38% | EMEA: 34% |
| Smaller Players: 17% | Managers: 47% | Americas: 23% |
Market-Sizing & Forecasting
Sizing starts with a top-down build where production and trade indicators are used to reconstruct the addressable pool of humidity sensing components, and then it is filtered through application adoption and replacement cycles. Once that structure is in place, the totals are corroborated with selective bottom-up approximations, such as sampled average selling price (ASP) by sensor type multiplied by estimated unit volumes from channel checks and distributor feedback, which are then used to adjust outliers.
Key inputs used in the model include penetration of humidity sensing in HVAC equipment and building controls, industrial automation project activity, automotive cabin sensing fitment trends, healthcare device usage where humidity monitoring matters, and observed ASP movement between analog and digital sensors. Because coverage spans multiple end uses, gaps in unit visibility were handled by using proxy indicators (shipment direction, integration count, and replacement rates) and then re-tested with interview feedback.
For forecasting, we mainly used scenario analysis supported by a simple multivariate regression layer so that growth stays linked to measurable drivers such as HVAC demand, industrial production, and electronics output trends. Assumptions are kept consistent by year, and currency conversion timing is held stable so the run-rate can be replicated and explained on a client call.
Data Validation & Update Cycle
Validation is done through repeated variance checks across independent signals, and then reviewed in steps before final sign-off. We compare the model output against cross-market indicators such as sensor attachment rates, trade direction, and observed pricing ranges, and anomalies are reworked until they fit the stated scope and logic.
When a large mismatch shows up, we re-contact relevant respondents to confirm whether it is coming from a real market shift or from an assumption drift. Reports are refreshed annually, with interim updates when material events occur, and a final pre-delivery review is performed so clients receive an up-to-date view of the market.
Mordor Intelligence's Humidity Sensors Market Estimate Compared With Other Published Estimates
Published market numbers for humidity sensors can vary quite a bit, even when the same years are being discussed, because the included product scope and the pricing logic are not always consistent. Differences also come from how quickly assumptions are refreshed, especially when digital sensor adoption changes the mix and price points.
The main gap comes from whether adjacent devices like HVAC controllers, full IAQ modules, or environmental sensor bundles are counted as humidity sensors, where Mordor Intelligence counts only the humidity sensing component revenue and applies separate ASP and unit assumptions by sensor technology and end use. Another driver is the method used to project ASP over time, since some estimates assume a flat price curve while others build in mix shifts and currency timing.
Benchmark comparison
| Source | Market Size | Gaps in Research Methodology |
|---|---|---|
| Mordor Intelligence | USD 739.50 M (2026) | |
| Industry Newswire A | USD 3.44 B (2025) | This figure typically reflects a broader definition that can roll up finished modules and packaged solutions, and it may use higher blended ASPs without separating analog versus digital sensor mixes. |
| Industry Tracker B | USD 1.40 B (2024) | This estimate often blends revenue with shipment-driven assumptions across many applications, and the conversion from units to value may not be consistently re-checked against channel pricing and replacement-cycle timing. |
What the comparison shows is that scope discipline and the way ASP and volumes are tied to deployment signals can move the total by a large margin. When the counted product is kept to true humidity sensing revenue, and the demand pool is cross-checked through application attachment and pricing ranges, the result is easier to trace and repeat year after year.
Key Questions Answered in the Report
How large is the global humidity sensors market in 2026?
The humidity sensors market size stands at USD 739.50 million in 2026 and is on course to reach USD 985.45 million by 2031.
Which sensor technology is growing fastest?
MEMS-based digital humidity sensors are expanding at a 6.40% CAGR through 2031 thanks to integrated signal conditioning and shrinking package footprints.
Why are humidity sensors critical in electric-vehicle batteries?
Continuous humidity monitoring inside battery packs helps automakers detect moisture ingress early, preventing short circuits and thermal runaway events.
What drives demand for sensors in emerging-market HVAC retrofits?
Rising electricity costs and policies that mandate humidity-responsive controls encourage building owners to add networked sensors to existing air-conditioning systems.
Which region contributes the highest revenue?
Asia-Pacific leads with 36.90% of global 2025 revenue and delivers the fastest regional CAGR at 6.90% through 2031.
How does e-commerce affect sensor distribution?
Online component marketplaces are posting a 7.20% CAGR as small and midsize enterprises purchase retrofit sensors directly, eroding OEM channel dominance.