
HR Analytics Market Size and Share
Market Overview
| Study Period | 2020 - 2031 |
|---|---|
| Market Size (2026) | USD 5.71 Billion |
| Market Size (2031) | USD 10.82 Billion |
| Growth Rate (2026 - 2031) | 13.64 % |
| Fastest Growing Market | Asia Pacific |
| Largest Market | North America |
| Market Concentration | Medium |
Major Players *Disclaimer: Major Players sorted in no particular order Image © Mordor Intelligence. Reuse requires attribution under CC BY 4.0. | |
HR Analytics Market Analysis by Mordor Intelligence
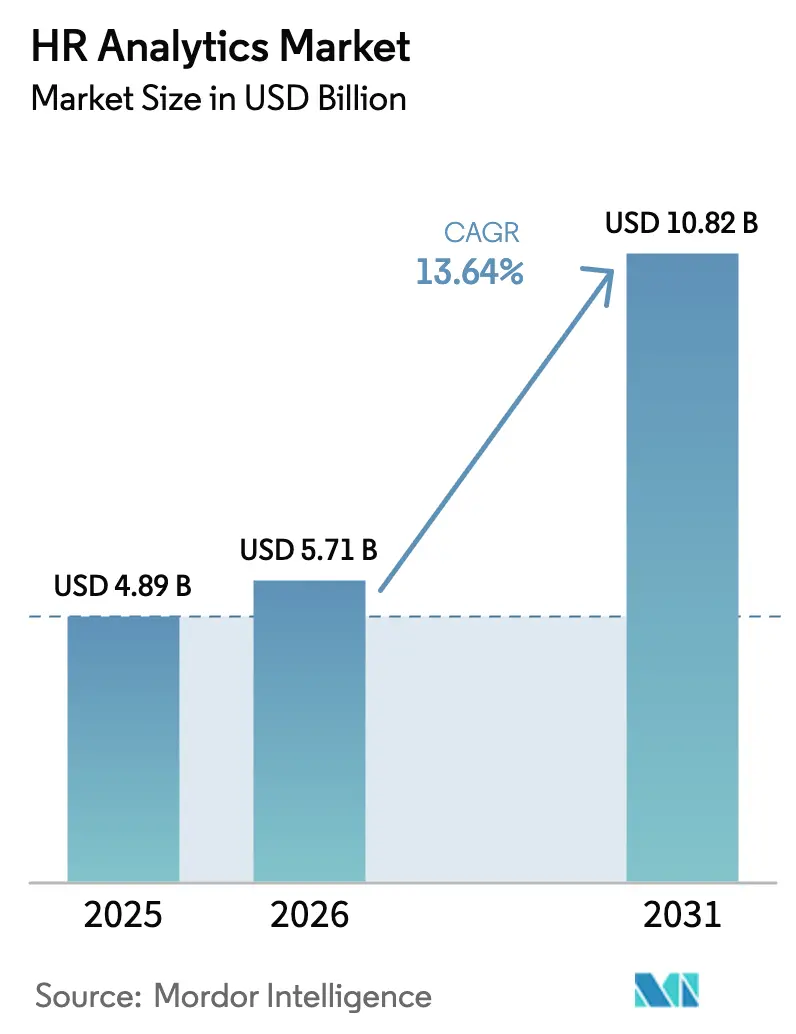
The HR analytics market size is projected to be USD 4.89 billion in 2025, USD 5.71 billion in 2026, and reach USD 10.82 billion by 2031, growing at a CAGR of 13.64% from 2026 to 2031. Cloud subscription economics, the pivot from descriptive to predictive workforce intelligence, and new ESG-driven disclosure duties together explain the sustained double-digit trajectory. Demand is rising fastest where generative-AI copilots compress labor-intensive recruiting and reporting cycles, while widening pay-equity mandates push diversity analytics from optional to required software. Competitive intensity is growing as pure-play analytics layers integrate with multiple HR and payroll systems, challenging incumbent HCM suites that bundle analytics as an add-on. Enterprises of every size now evaluate people-analytics platforms not only for dashboards but also for built-in bias controls, data-privacy tooling, and regulatory-ready audit trails.
Key Report Takeaways
- By component, solutions led with 69.73% of the HR analytics market share in 2025, while services are projected to expand at a 13.89% CAGR through 2031.
- By deployment mode, cloud installations captured 75.67% of 2025 revenue and are forecast to grow at a 13.96% CAGR through 2031.
- By organization size, large enterprises held 62.33% of the HR analytics market share in 2025, whereas small and medium enterprises are advancing at a 13.92% CAGR through 2031.
- By application, talent acquisition and onboarding accounted for 28.74% of 2025 revenue, and diversity, equity, and inclusion analytics are expected to rise at a 14.83% CAGR through 2031.
- By end-user industry, IT and telecom generated 23.62% of the HR analytics market share in 2025, while healthcare and life sciences are poised to grow at a 14.11% CAGR through 2031.
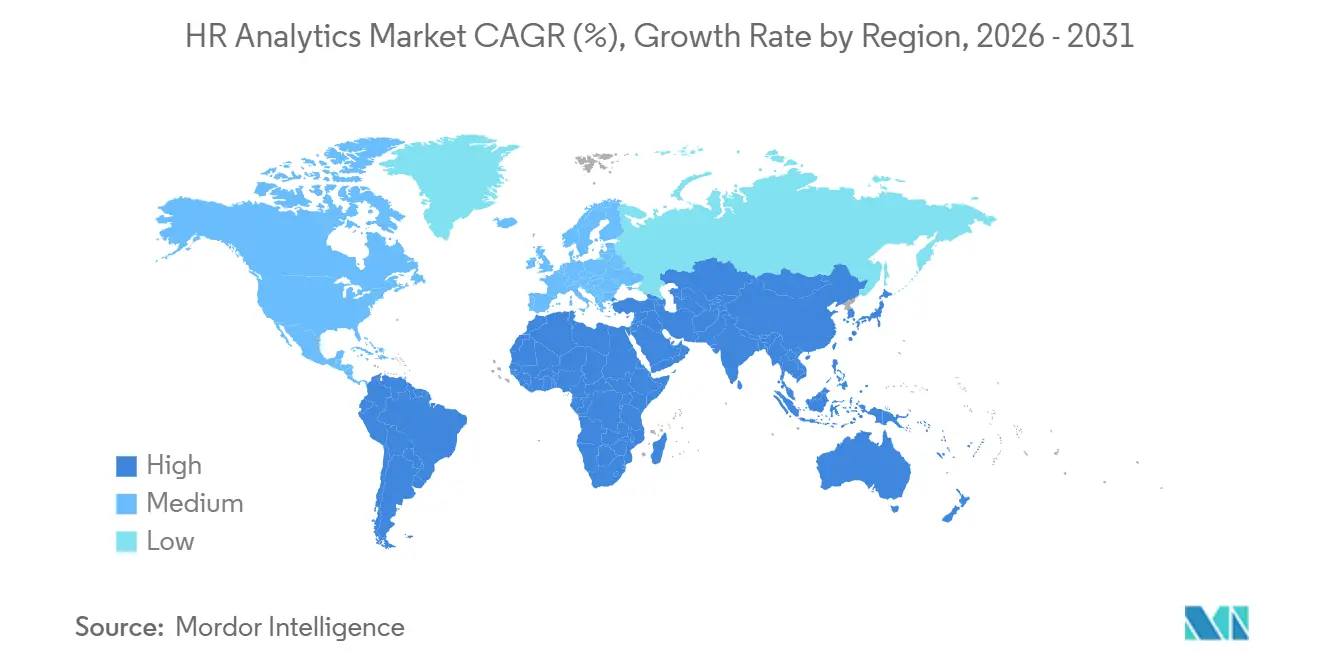
- By geography, North America retained 39.48% revenue share in 2025, and the Asia-Pacific is projected to register the fastest growth at a 14.69% CAGR through 2031.
Note: Market size and forecast figures in this report are generated using Mordor Intelligence’s proprietary estimation framework, updated with the latest available data and insights as of January 2026.
Global HR Analytics Market Trends and Insights
Drivers Impact Analysis*
| Driver | (~) % Impact on CAGR Forecast | Geographic Relevance | Impact Timeline |
|---|---|---|---|
| Cloud-Based HR Analytics Adoption Surge | +2.8% | Global, led by North America and Europe | Medium term (2-4 years) |
| Need to Cut Attrition and Optimize Workforce Cost | +2.5% | Global, acute in healthcare and IT services | Short term (≤ 2 years) |
| Hybrid and Remote Work Accelerating Data-Driven HR | +2.1% | North America, Europe, Asia-Pacific urban centers | Medium term (2-4 years) |
| Generative-AI Copilots Embedded in HR Suites | +2.3% | North America and Europe early adopters | Long term (≥ 4 years) |
| ESG-Linked Human-Capital Disclosure Mandates | +1.7% | North America and Europe, spillover to Asia-Pacific multinationals | Medium term (2-4 years) |
| Wearable and Biometric Data for Wellbeing Analytics | +1.2% | North America and Europe | Long term (≥ 4 years) |
| Source: Mordor Intelligence | |||
Cloud-Based HR Analytics Adoption Surge
Moving HR analytics to the cloud has eliminated the upfront hardware and licensing costs that once limited adoption to very large companies. An ISG poll of 1,200 organizations showed that 69% were already running at least one HR module in software-as-a-service form by the close of 2025, a steep jump from 52% in 2023.[1] Oracle added 1,400 Fusion Cloud HCM clients during fiscal 2025 as modular, per-employee pricing appealed to budget-sensitive buyers. Workday shipped three major releases in 2025, versus the single annual update common in legacy on-premises deployments, underscoring the feature-velocity advantage of a multi-tenant design. The same architecture, however, channels data through hyperscale centers that can clash with EU cross-border rules, a tension highlighted by Amazon's EUR 746 million (USD 843 million) GDPR fine for employee data processing.
Need to Cut Attrition and Optimize Workforce Cost
Voluntary turnover costs U.S. employers USD 1 trillion in 2025, prompting firms to lean on predictive models that flag flight risk months before a resignation. IBM’s Watson Analytics reached 95% accuracy in predicting which workers would exit within a year by blending tenure, promotion history, and external labor-market signals. Hospitals that paired these insights with targeted retention bonuses and shift-pattern tweaks trimmed registered-nurse attrition by 22%, saving an average of USD 52,100 per avoided departure. Pay-compression dashboards also reveal cases where new hires out-earn long-serving colleagues, a trigger for “quiet quitting” that companies address through mid-cycle salary corrections. As CHROs quantify such savings, finance teams increasingly treat people analytics as a cost-containment lever rather than a discretionary tool.
Hybrid and Remote Work Accelerating Data-Driven HR
The shift to hybrid schedules removed hallway conversations that once signaled disengagement, so managers now study digital traces instead. Microsoft Viva Insights aggregates meeting loads, after-hours email counts, and collaboration networks to flag burnout or isolation risk before it shows up in exit interviews.[2] Qualtrics found that 63% of hybrid firms issued pulse surveys in 2025, up from 41% two years earlier, because annual engagement polls miss short-cycle sentiment swings. Regulators warn that excessive monitoring can violate privacy laws; the European Data Protection Board requires explicit consent for employers to capture keystrokes or webcam feeds under GDPR Article 88. Analytics also expose labor-cost arbitrage, as Deloitte noted 40% savings when U.S. software teams hired engineers in tier-2 Indian cities without productivity loss.
Generative-AI Copilots Embedded in HR Suites
Large language models now automate tasks that once consumed a third of HR-business-partner bandwidth. SAP’s Joule assistant drafts interview questions and proposes learning paths by mapping competency gaps to course catalogs.[3] Workday’s Illuminate parses free-text feedback to uncover attrition themes in days rather than weeks. Oracle’s AI agents, rolled out in January 2025, shortened time-to-hire by 30% in pilot programs by pre-screening résumés against role-specific ontology maps. Yet a 2024 class-action lawsuit alleges that automated screening penalized applicants with résumé gaps, spotlighting litigation risk if training sets mirror historical bias. Vendors, therefore, rush to embed bias-detection layers and explainability dashboards to reassure risk officers.
Restraints Impact Analysis*
| Restraint | (~) % Impact on CAGR Forecast | Geographic Relevance | Impact Timeline |
|---|---|---|---|
| Shortage of HR Data-Science Talent | -1.8% | Global, pronounced in mid-market firms | Medium term (2-4 years) |
| Data-Privacy and Compliance Complexity | -1.5% | Europe, North America, fragmented Asia-Pacific | Short term (≤ 2 years) |
| Algorithmic-Bias Litigation Risk | -0.9% | North America and Europe | Medium term (2-4 years) |
| Legacy Siloed HR Data Architectures | -1.3% | Government, healthcare, manufacturing | Long term (≥ 4 years) |
| Source: Mordor Intelligence | |||
Shortage of HR Data-Science Talent
People analytics roles blend SQL, Python, statistics, and HR policy knowledge, a skill cocktail still rare in labor markets worldwide. LinkedIn’s 2025 Emerging Jobs Report ranked people analytics specialist seventh by growth rate, yet the median position sat unfilled for more than 90 days and carried salary premiums of 25-35% over standard HR analyst positions. Deloitte observes that many mid-market firms stall at descriptive dashboards because they lack the staff to build predictive models. Drag-and-drop tools from vendors such as Visier reduce entry barriers, but interpreting model output and steering interventions still call for seasoned analysts. Until universities and in-house academies expand pipelines, talent scarcity will cap analytics ROI for small to midsize employers.
Data-Privacy and Compliance Complexity
HR files store health data, union affiliation, and disciplinary records, all granted heightened protection under global privacy statutes. The EU fined H&M EUR 35.3 million (USD 39.9 million) in 2020 for monitoring employees’ personal lives too closely. California’s Consumer Privacy Act, fully extended to employee records in 2023, obliges companies to deliver access, deletion, and correction rights on request. China’s Personal Information Protection Law blocks cross-border transfers without regulator-approved security assessments. GDPR Article 22 lets workers contest automated decisions that materially affect them, such as promotion denials, forcing firms to layer explainability and manual-review checkpoints into analytics workflows. Legal reviews and data-protection impact assessments can add six to 12 months to deployment timelines, squeezing smaller IT budgets and slowing innovation.
*Our forecasts treat driver/restraint impacts as directional, not additive. The impact forecasts reflect baseline growth, mix effects, and variable interactions.
Segment Analysis
By Component: Solutions Lead While Services Accelerate
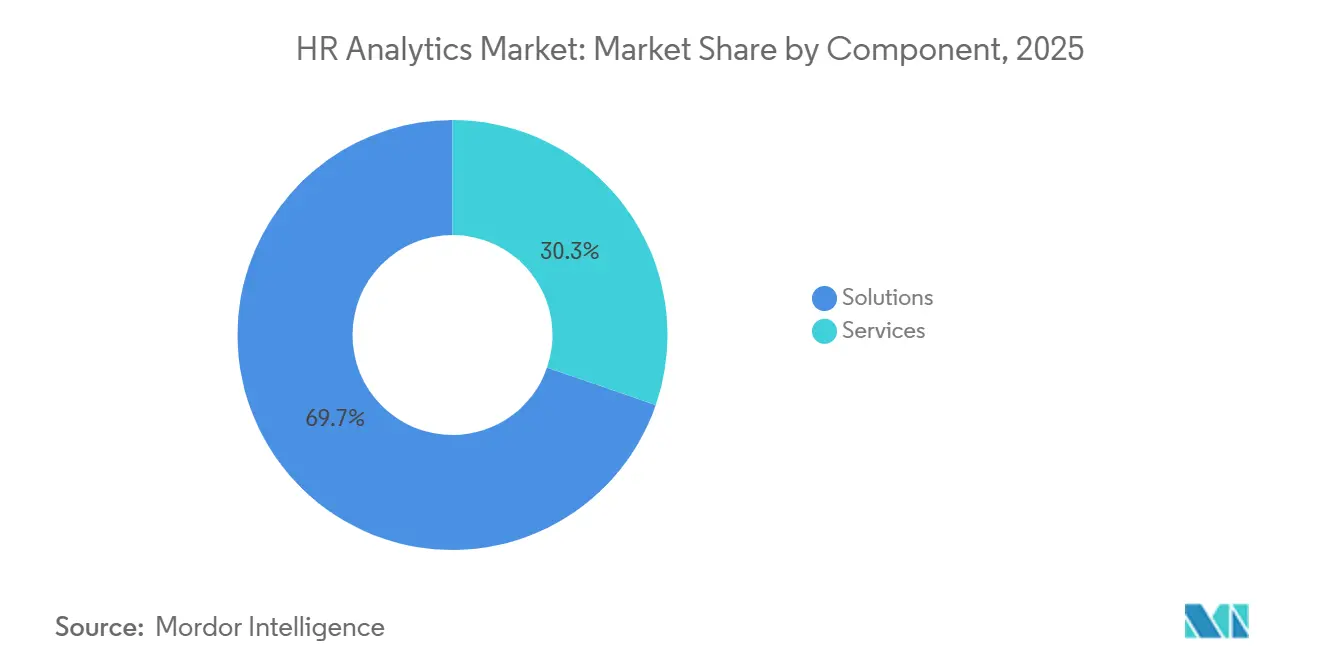
Solutions captured 69.73% of 2025 revenue, underscoring enterprises’ preference for packaged dashboards, prebuilt connectors, and embedded predictive models that can be activated with minimal configuration. Services such as implementation consulting, custom model development, and managed analytics are advancing at a 13.89% CAGR, as firms without in-house data talent rely on partners for data migration, change management, and bias-testing. The HR analytics market share advantage enjoyed by software vendors is likely to narrow as regulatory requirements for explainability and privacy drive demand for specialized advisory projects.
Subscription pricing lets buyers add modules over time, compressing deployment cycles from months to weeks. Oracle recorded a 23% jump in cloud-services fees in fiscal-2025 because clients needed mapping of complex org structures to standardized metric libraries. Accenture and IBM both expanded workforce analytics practices by double digits, pairing data scientists with industrial-organizational psychologists to turn raw insights into retention or reskilling programs. This advisory uptick signals that services will continue to gain ground, even though software remains the spine of the HR analytics market.
By Deployment Mode: Cloud Defines New Default
Cloud installations accounted for 75.67% of 2025 spending and are growing at a 13.96% CAGR, outpacing all other deployment options. Multi-tenant design accelerates feature releases, evidenced by Workday’s three major updates in 2025 versus annual patches on legacy stacks. Consumption-based pricing also aligns vendor revenue with customer headcount, easing CFO concerns about shelf-ware during hiring freezes.
On-premises platforms persist in government and highly regulated banking, where data residency or mainframe entanglements slow migration. SAP reported that SuccessFactors added 2,100 cloud customers in 2025, while on-premises ECC licenses fell 9%. Hybrid architectures, a cloud analytics layer combined with in-country mirrors for sensitive records, are an interim fix in Russia, Indonesia, and Vietnam, but overhead costs may eventually push holdouts toward full SaaS adoption.
By Organization Size: SMEs Close the Capability Gap
Large enterprises accounted for 62.33% of 2025 spending, reflecting dedicated people-analytics centers that run complex succession, scenario, and skills-adjacency models. Small and medium enterprises are experiencing significant growth, advancing at a compound annual growth rate (CAGR) of 13.92%. This represents the fastest pace within this segment, driven by the adoption of no-code dashboards and per-employee licensing models, which effectively lower the barriers to entry for these businesses.
Visier’s Essentials plan, priced at USD 15,000 a year for 500–1,000-employee firms, bundles turnover prediction and diversity dashboards without demanding SQL expertise. BambooHR and HiBob added thousands of sub-500-staff customers in 2025 by embedding out-of-the-box reports on offer acceptance and time-to-fill. Quick, eight-week implementations and ROI calculators that convert attrition reductions into dollar savings help SMEs justify investments against lean budgets, further expanding the HR analytics market among mid-market buyers.
By Application: DEI Analytics Surges Ahead
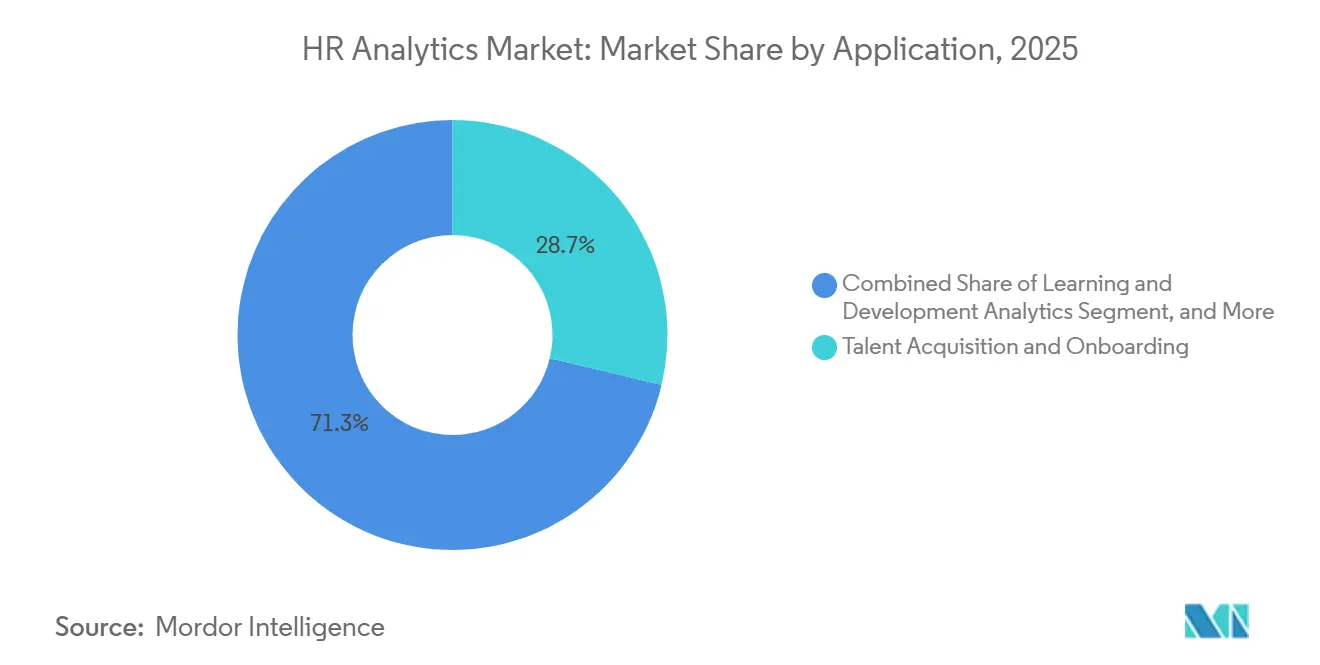
Talent acquisition and onboarding retained a 28.74% slice of 2025 revenue, powered by ATS integrations that score candidate pipelines and cut time-to-hire. Driven by the implementation of California SB 1162, New York City Local Law 144, and the EU Pay Transparency Directive, which transform voluntary reporting into mandatory disclosure, the diversity, equity, and inclusion analytics market is experiencing significant growth. It is projected to expand at a compound annual growth rate (CAGR) of 14.83%, representing the steepest growth trajectory within this domain.
DEI modules now calculate adjusted pay gaps, track promotion velocity by demographic cohort, and issue audit-ready files for regulators. Compensation analytics remain vital to reveal pay compression, while learning analytics link certification completions to future performance ratings. Employee-wellbeing dashboards, which fuse pulse-survey sentiment with benefits use, flag burnout clusters that correlate with turnover risk. Together, these use cases support a rising share of the HR analytics market.

By End-User Industry: Healthcare Tops the Growth Charts
IT and telecom generated 23.62% of 2025 revenue, reflecting tech firms’ early embrace of skills graphs that map competencies to project needs. The healthcare and life sciences sector is projected to grow at a significant compound annual growth rate (CAGR) of 14.11%, making it the fastest-growing vertical. This growth is primarily driven by hospitals adopting comprehensive retention strategies to address the issue of registered-nurse turnover. The average turnover rate for registered nurses is anticipated to reach 18.4% in 2025, underscoring the importance of these retention efforts in stabilizing the workforce and ensuring operational efficiency.
BFSI institutions apply analytics to branch-network staffing and risk-compliance workloads, while retailers model seasonal labor spikes to trim overtime bills. Manufacturers track safety incidents and skills adjacency to support cross-training, shielding production lines against absenteeism. Government agencies, facing budget caps but mounting pension liabilities, lean on cloud platforms for succession planning and cost forecasting. Collectively, diverse vertical needs keep the HR analytics market share widely distributed, reinforcing the importance of sector-specific content libraries within vendor roadmaps.
Geography Analysis
North America accounted for 39.48% of 2025 revenue, supported by SEC rules mandating human-capital disclosures for listed companies and robust venture investment in HR tech startups. U.S. enterprises spent an average of USD 1.6 million each on AI-powered HR tooling during 2025. Canada’s Pay Equity Act further boosts demand for compensation analytics, while Mexico’s manufacturing nearshoring boom drives the need for headcount-planning dashboards that keep pace with plant expansions.
Asia-Pacific is the fastest-growing region, with a 14.69% CAGR. India’s IT majors adopted skills graphs to redeploy staff as generative-AI automation reshapes delivery models. China’s state-owned enterprises digitize HR processes under government modernization mandates, and Japan’s shrinking labor pool forces manufacturers to maximize productivity per worker. Australia’s 2024 Fair Work amendments extend leave entitlements to gig-economy workers, opening new analytics use cases in contingent labor management.
Europe’s Corporate Sustainability Reporting Directive embeds diversity and training metrics into audited statements, pushing HR analytics into CFO territory. Germany’s works council co-determination rules require consent layers for employee monitoring, thereby influencing product roadmaps. In the Middle East, Saudi Arabia’s Saudization quotas create a compliance-driven need for dashboards that track citizen-to-expat ratios. South America lags in spending, yet Brazil’s labor-law modernization is nudging employers toward cloud analytics for hybrid scheduling compliance.
Regulatory Landscape
HR analytics deployments sit at the intersection of privacy, employment, and emerging AI governance rules, which pushes vendors and buyers to operationalize audit trails, consent management, and human-in-the-loop decision controls. In Europe, the EU AI Act classifies AI used for recruitment, performance evaluation, and worker monitoring as high-risk, triggering requirements such as technical documentation, registration, and human oversight. A May 2026 EU Digital Omnibus agreement moved the enforcement timeline for high-risk employment AI compliance to December 2, 2027, affecting procurement roadmaps and phased rollouts.
Data protection and anti-discrimination enforcement also shape product design and implementation. Under GDPR, worker rights around automated decisions and employee-data processing increase the need for explainability and manual review checkpoints, while the European Data Protection Board continues to publish guidance that affects cross-border HR data handling. In the United States, the EEOC position that employers must justify AI hiring tools as job-related when disparate impact is shown raises expectations for bias-testing and documentation. State-level requirements add specificity as well: Connecticut SB 435, effective October 2026, requires independent bias audits and human oversight for automated employment-related decision systems.
Value Chain Analysis
The HR analytics value chain begins with workforce data creation across HRIS/HCM, ATS, payroll, time and attendance, learning, and engagement tools. It then moves through ingestion and integration using connectors, ETL, APIs, and identity and access controls, along with data governance such as catalogs, lineage, and permissions. The chain culminates in analytics and AI layers, including metrics libraries, predictive models, and agentic workflows, delivered through dashboards and in-workflow assistants. Core platform vendors and specialists such as SAP, Oracle, Workday, IBM, Visier, and Phenom anchor the chain, while infrastructure partners and enterprise AI assistants increasingly influence how insights are consumed inside daily productivity tools.
Value capture is shifting toward governed data foundations and agentic interfaces that reduce reliance on specialist analysts and speed up actioning of insights. Vendor moves reflect this, such as Visier expanding integrations, including a Glean MCP connection in April 2026, and consolidation that pulls analytics into broader talent platforms, such as Phenom acquiring Included AI in January 2026 to add agentic people analytics. Bottlenecks remain in fragmented legacy data, cross-border security constraints, and the technical effort required to harmonize disparate sources for real-time modeling, which supports demand for implementation services and ongoing governance operations.
Competitive Landscape
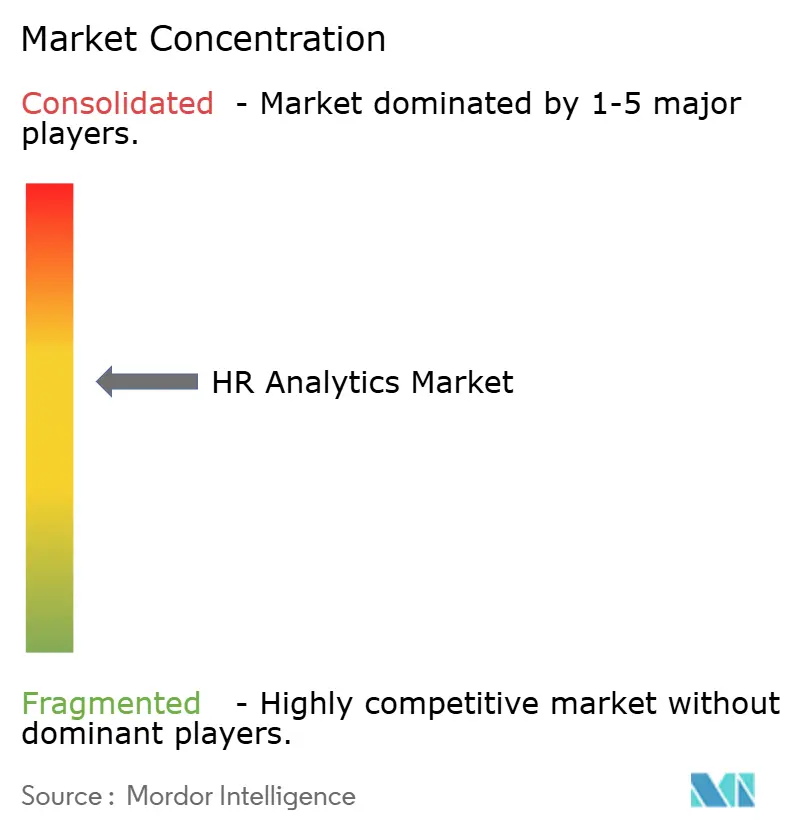
The HR analytics market is moderately fragmented. The top five vendors, SAP, Oracle, Workday, ADP, and IBM, accounted for around 45% of combined revenue in 2025, leaving ample room for niche specialists. Incumbent HCM suites embed analytics into existing payroll and recruiting workflows, monetizing installed bases. SAP SuccessFactors People Analytics links workforce-cost data with SAP ERP financials, letting users model cost-to-revenue ratios that point solutions cannot match. Oracle ships 200+ prebuilt metrics and industry benchmarks to reduce the custom report backlog.
Pure-play vendors differentiate on integration breadth and time-to-value. Visier connects to 200+ HR apps, serving as an agnostic insights layer across heterogeneous tech stacks. ChartHop targets org design visualizations for growth-stage firms, while Culture Amp combines engagement surveys with DEI analytics. Eightfold AI and Gloat specialize in talent marketplaces that match employees to gigs, projects, and mentors, driving internal mobility. Syndio owns the pay-equity niche, releasing templates that meet EU Pay Transparency requirements. Patent filings reveal roadmap priorities; Workday filed 14 patents related to federated learning in 2024, indicating a push toward privacy-preserving model training.
M&A and funding activity underline competitive ferment. ADP bought Workforce Software for USD 1.2 billion in August 2025 to add advanced scheduling analytics. Workday acquired HiredScore for USD 450 million in December 2024, sharpening its AI recruiting stack. Visier’s USD 154 million Series E underscores investor confidence, while Eightfold AI’s USD 220 million Series F bankrolls expansion into Latin America and Southeast Asia.
HR Analytics Industry Leaders
-
SAP SE
-
Oracle Corporation
-
Workday Inc.
-
IBM Corporation
-
ADP Inc.
- *Disclaimer: Major Players sorted in no particular order
Market Opportunities and Future Outlook
One near-term whitespace is standardized governance for AI-enabled HR decisions across recruiting, performance, and workforce monitoring. Buyers increasingly seek repeatable evidence packs, including bias testing, human oversight design, and regulatory-ready audit trails that align privacy and employment requirements. The May 2026 EU Digital Omnibus adjustment that extended the EU AI Act high-risk employment compliance timeline to December 2, 2027 also creates room for vendors and services partners to sell phased compliance programs, covering documentation, monitoring, and controls, rather than one-time configuration. State-level requirements such as Connecticut SB 435 (effective October 2026) further push independent bias-audit workflows and third-party validation into procurement checklists.
Another opportunity is moving from dashboards to total workforce intelligence that blends HR data with finance and operations signals, with decisions delivered inside the tools managers already use. Evidence of this direction shows up in 2026 product plans from major suites that emphasize agentic execution and embedded guidance, including Oracle introducing agentic applications for HR within Fusion Cloud HCM and Workday expanding AI-agent workflows through its partnership with Google Cloud. For buyers with fragmented HR stacks and limited people-analytics staffing, the path still runs through prebuilt connectors, packaged metric libraries, and flow-of-work delivery such as enterprise assistants and collaboration tools, supported by advisory services for data ownership, model governance, and legal sign-off for AI-driven workforce planning.
Recent Industry Developments
- June 2026: Oracle launched Oracle Manager Edge within Oracle Fusion Cloud HCM, positioning it as an AI-powered coaching assistant for managers that draws on workforce insights, feedback, and performance signals. The release pushes HR analytics from reporting into guided actions for frontline leaders and strengthens Oracle's workflow-level differentiation inside its HCM suite.
- May 2026: Workday and Google Cloud expanded their strategic partnership to bring AI agents for HR and finance into employees daily workflows, integrating Workday's self-service agent capabilities with Google Cloud Gemini Enterprise. The partnership tightens ecosystem ties around enterprise AI platforms and reduces context switching by surfacing HR insights and actions inside commonly used Google applications.
- December 2024: Workday acquired HiredScore for USD 450 million to deepen AI capabilities in recruiting and hiring. By bringing candidate screening and hiring intelligence into its platform, Workday increased vertical integration of talent acquisition analytics and raised competitive pressure on point solutions that rely on standalone ATS integrations.
Research Methodology Framework and Report Scope
Market Definition and Coverage
For this study, the HR analytics market is defined as spending on software and related services that collect, connect, and analyze workforce data to support HR decisions across the employee lifecycle, from hiring through retention.
Scope exclusions: Payroll processing platforms and generic business intelligence tools that are not purpose-built for HR use cases are excluded.
Segmentation Overview
- By Component
- Solutions
- Services
- By Deployment Mode
- On-Premise
- Cloud
- By Organization Size
- Large Enterprises
- Small and Medium Enterprises
- By Application
- Talent Acquisition and Onboarding
- Workforce Planning and Optimization
- Compensation and Payroll Analytics
- Learning and Development Analytics
- Employee Engagement and Wellbeing Analytics
- Diversity, Equity and Inclusion Analytics
- By End-User Industry
- IT and Telecom
- Banking, financial services and insurance (BFSI)
- Retail and Consumer Goods
- Healthcare and Life Sciences
- Manufacturing
- Government and Public Sector
- Other End-User Industries
- By Geography
- North America
- United States
- Canada
- Mexico
- Europe
- Germany
- United Kingdom
- France
- Russia
- Rest of Europe
- Asia-Pacific
- China
- Japan
- India
- South Korea
- Australia
- Rest of Asia-Pacific
- Middle East and Africa
- Middle East
- Saudi Arabia
- United Arab Emirates
- Rest of Middle East
- Africa
- South Africa
- Egypt
- Rest of Africa
- Middle East
- South America
- Brazil
- Argentina
- Rest of South America
- North America
Data Sources, Market Sizing, and Validation
Desk Research
Desk work starts by mapping where HR analytics shows up in real organization workflows, for example workforce reporting versus recruiting and retention analytics, and where that spend is reflected in budgets, contracts, and subscriptions. We rely on public sources such as the US Bureau of Labor Statistics for workforce indicators, OECD labor datasets for cross-country context, Eurostat for employer and employment series, and International Labour Organization statistics for participation and employment trends.
For market structure clues, we review company filings and earnings decks, product documentation, and reputable press coverage that describes rollout patterns, pricing signals, and buying triggers. In addition, a paid subscription for company financials and intelligence is used selectively to standardize revenue splits and regional exposure, and a paid patent database is referenced to sanity-check where analytics features are heading over time. The sources listed above are illustrative only, and many other public and internal references are used to collect data, validate inputs, and clarify gaps.
Primary Interviews and Surveys
Primary work is used to pressure-test what counts as HR analytics spend and what vendors bundle into broader HR software deals. We speak with HR leaders, analytics heads, implementation partners, and product owners to confirm adoption patterns, the typical subscription versus services mix, and how renewals and expansions behave across regions and company sizes.
Distribution of primary research fieldwork respondents
| Company type | Respondent position | Region |
|---|---|---|
| Top tier: 27% | CXOs: 16% | APAC: 42% |
| Mid tier: 53% | Functional/Unit leaders: 31% | EMEA: 35% |
| Smaller Players: 20% | Managers: 53% | Americas: 23% |
Market-Sizing & Forecasting
Sizing is first constructed using a top-down approach where the HR software and services demand pool is rebuilt by region, and then filtered using adoption and spend-intensity assumptions specific to analytics add-ons and stand-alone tools. To make the totals realistic, results are cross-checked with selective bottom-up approximations, such as sampled subscription price ranges multiplied by estimated customer counts, plus services attach rates for deployments and ongoing support.
Key inputs in the model include enterprise cloud adoption in HR functions, the share of organizations running centralized HRIS data, hiring and attrition intensity (which pushes demand for recruiting and retention analytics), the typical split between solutions and services, and regional differences in compliance and reporting needs. Forecasts are developed using scenario analysis, where baseline growth is adjusted based on how quickly predictive analytics use cases expand beyond reporting, and then validated through what interviewees expect for renewal uplift and new-module adoption over the next few cycles. When bottom-up signals are thin for a smaller geography or niche use case, gaps are handled by using conservative penetration ranges and then re-checking against employment and enterprise counts so outputs do not drift away from observable demand drivers.
Data Validation & Update Cycle
Validation is done by triangulating the model against multiple independent signals, including regional HR technology spending direction, observed solution-to-services mix, and the pace of cloud deployment shifts. Outliers are flagged when a country or region grows faster than its hiring and HR digitization indicators would support, and those items are reviewed again before sign-off.
A second analyst review is used to re-check calculations, unit consistency, and currency conversions, followed by targeted re-contact of primary sources when assumptions move outside expected ranges. Reports are refreshed annually, and interim updates are made when material events occur that can change adoption or pricing. Before delivery, a final pass is completed so clients receive the latest updated view.
Mordor Intelligence's Hr Analytics Market Estimate Compared With Other Published Estimates
Published market sizes for HR analytics can look different even when the topic name is the same, because the line between analytics, core HR systems, and adjacent business tools is not drawn the same way everywhere. Differences also come from how services are treated, how cloud subscriptions are annualized, and how quickly assumptions are refreshed when pricing models change.
The main gap comes from what gets counted as HR analytics spend, where Mordor Intelligence includes purpose-built HR analytics software and related services, but leaves out payroll processing and generic BI tools that are not designed for HR decision-making. Some estimates also assume a faster or slower shift from descriptive reporting to predictive use cases, which changes expected subscription uplift and services attach rates, and then alters the current-year size they report.
Benchmark comparison
| Source | Market Size | Gaps in Research Methodology |
|---|---|---|
| Mordor Intelligence | USD 4.89 B (2025) | |
| Global Research Publisher A | USD 3.28 B (2023) | Uses an earlier base year and a different starting demand pool, and the mix between on-premise and hosted deployments can shift what is recognized as annual subscription revenue versus services. |
| Industry Research Publisher B | USD 4.90 B (2025) | Shows a similar 2025 value, but applies different growth windows and component splits, which can move totals when services scope, currency timing, and update cadence are not aligned year to year. |
Across the figures, the spread is mainly explained by scope and timing, not by a single math step. By keeping inclusions tied to HR-specific analytics use cases and checking totals against adoption and spend signals, the final number stays traceable to clear assumptions that can be repeated and reviewed.
Key Questions Answered in the Report
What CAGR is forecast for the HR analytics market through 2031?
The market is expected to grow at a 13.64% CAGR between 2026 and 2031.
Which deployment model is expanding the quickest?
Cloud deployments show the fastest growth, projected at a 13.96% CAGR.
Which application segment is forecast to outpace all others?
Diversity, equity and inclusion analytics is projected to advance at a 14.83% CAGR.
Why is Asia Pacific considered the fastest-growing region?
Digital-HR mandates in China, India’s IT-services expansion, and supportive regulation push Asia Pacific growth to a 14.69% CAGR.
How concentrated is vendor competition?
The top five providers account for roughly 45% of revenue, yielding a moderate market concentration score of 6.
Which industry vertical is set to record the highest growth rate?
Healthcare and life sciences is forecast to grow at a 14.11% CAGR as analytics tackle nurse turnover and staffing costs.