
Market Overview
| Study Period | 2021 - 2031 |
|---|---|
| Forecast Data Period | 2026 - 2031 |
| Base Year Market Size (2025) | USD 23.73 Billion |
| Market Size (2026) | USD 25.67 Billion |
| Market Size (2031) | USD 38.01 Billion |
| Growth Rate (2026 - 2031) | 8.17 % |
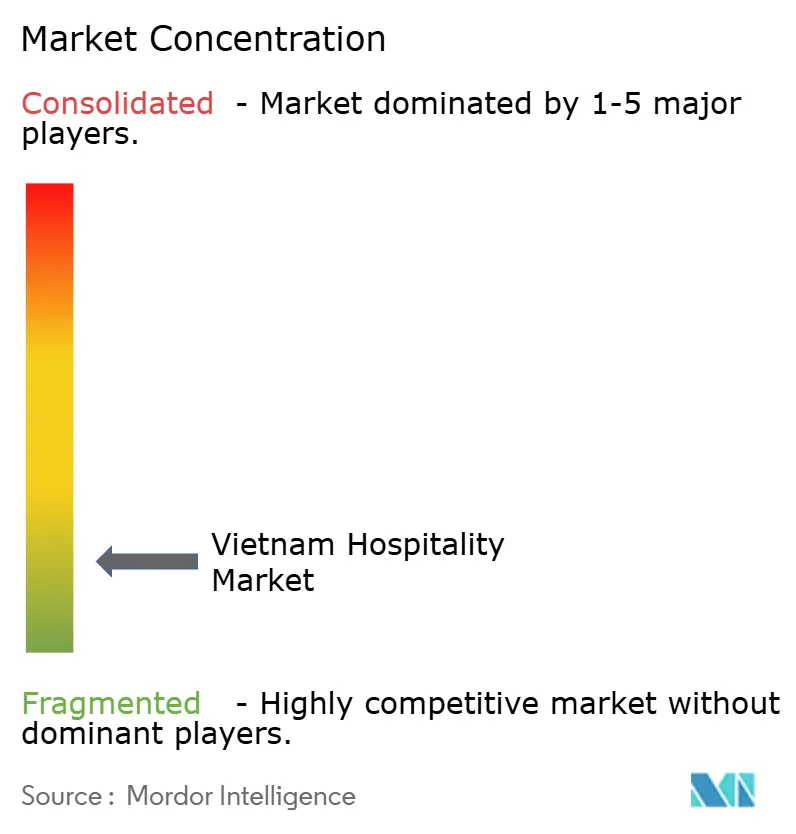
| Market Concentration | Low |
Major Players *Disclaimer: Major Players sorted in no particular order Image © Mordor Intelligence. Reuse requires attribution under CC BY 4.0. | |
Vietnam Hospitality Market Analysis by Mordor Intelligence
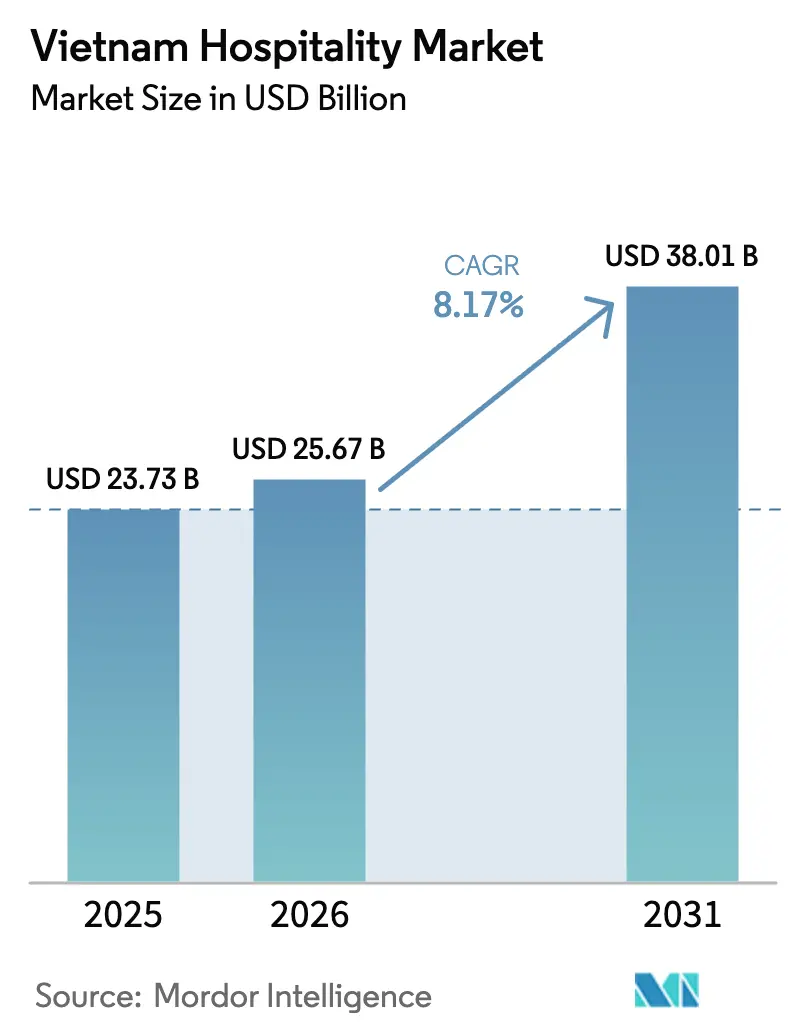
The Vietnam Hospitality Market size was valued at USD 23.73 billion in 2025 and is estimated to grow from USD 25.67 billion in 2026 to reach USD 38.01 billion by 2031, at a CAGR of 8.17% during the forecast period (2026-2031).
The growth rate outpaced the 7% historical average through 2024, indicating that reforms in travel facilitation and the gradual completion of core infrastructure are now shaping the trajectory more than short-cycle demand swings. International arrivals surged in 2025, with the country setting a new high-water mark and earning recognition among the fastest global growers during the first half of the year. Policy changes expanded the pool of travelers who can enter visa-free for extended stays and widened e-visa access for longer-duration visits, which eased friction for long-haul demand from Europe and other distant markets. Pricing discipline and product upgrades continued to underpin revenue performance, as operators focused on quality and occupancy management rather than rate discounting.
Key Report Takeaways
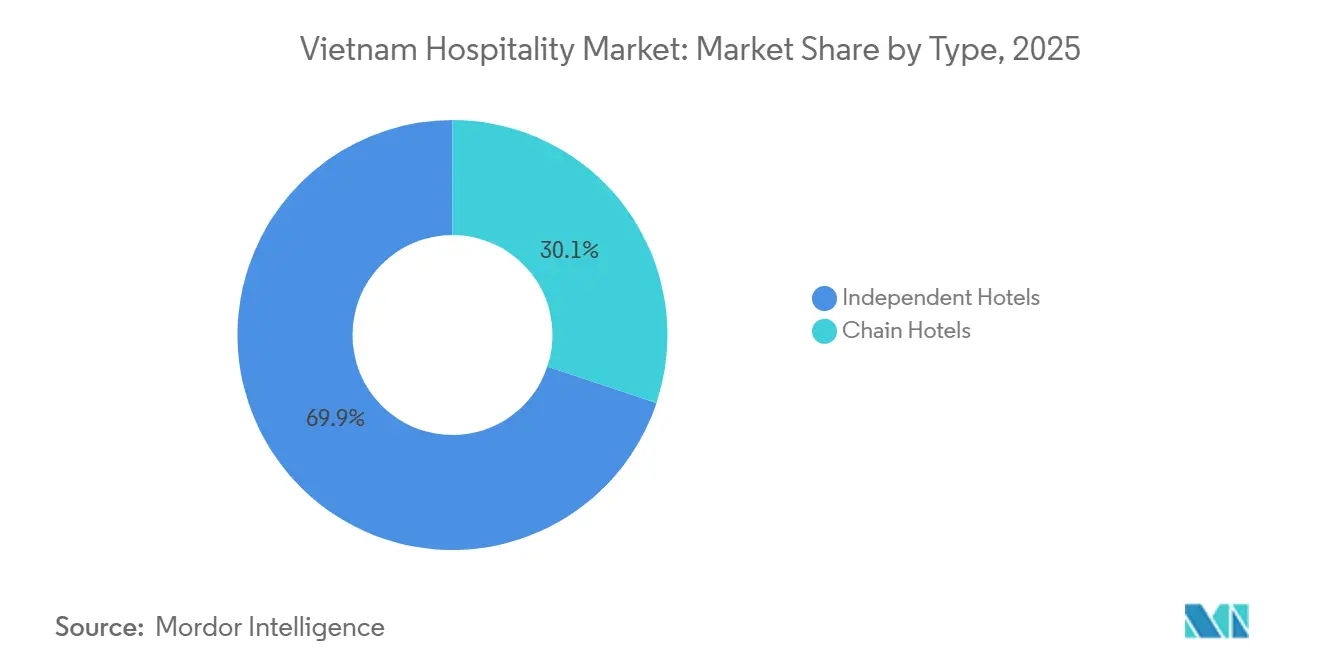
- By type, independent hotels led with 69.88% of the Vietnam hospitality market share in 2025, while chain hotels are forecast to expand at an 11.65% CAGR to 2031.
- By accommodation class, mid and upper mid-scale accounted for 48.79% of the Vietnam hospitality market share in 2025, and luxury recorded the fastest projected growth at a 13.35% CAGR.
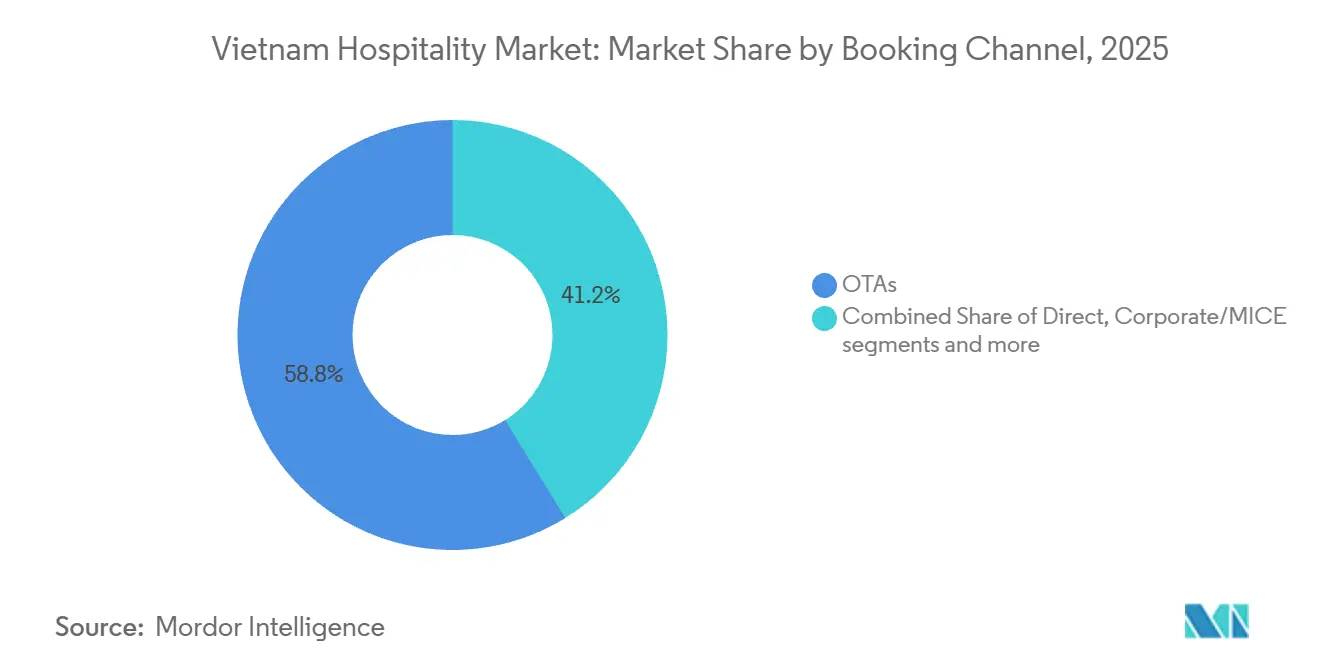
- By booking channel, OTAs controlled 58.85% of the Vietnam hospitality market share in 2025, and direct digital bookings had the highest projected growth at a 14.36% CAGR.
- By geography, southern Vietnam held 51.47% of the Vietnam hospitality market share in 2025, while the central coast and highlands registered the fastest projected growth at a 13.36% CAGR.
Note: Market size and forecast figures in this report are generated using Mordor Intelligence’s proprietary estimation framework, updated with the latest available data and insights as of January 2026.
Market Trends and Insights
Drivers Impact Analysis of Vietnam Hospitality Market*
| Driver | (~) % Impact on CAGR Forecast | Geographic Relevance | Impact Timeline |
|---|---|---|---|
| Visa-on-arrival expansion boosts long-haul demand | +1.8% | Global, strongest in Europe (Belgium, Netherlands, Poland, Switzerland), Russia, India | Medium term (2-4 years) |
| Resilient domestic leisure travel and work-cation culture | +1.2% | National, concentrated in Hanoi, Da Nang, Nha Trang, weekend corridors | Short term (≤ 2 years) |
| FDI-fuelled upscale hotel pipeline in Tier-2 coastal cities | +2.1% | Central Coast (Da Nang, Nha Trang, Phu Quoc), Hai Phong, Cam Ranh | Long term (≥ 4 years) |
| Digital-nomad visas & co-living hybrids | +0.6% | HCMC District 1, Hanoi Old Quarter, Da Nang beach zone | Medium term (2-4 years) |
| OTA loyalty wars are lowering customer-acquisition cost | +0.9% | National, with spillover benefits to rural guesthouses listing on Agoda/Booking.com | Short term (≤ 2 years) |
| Smart-hotel retrofits via Green & Smart City grants | +0.7% | HCMC, Hanoi, Da Nang (priority cities for Prime Minister Dispatch 34/CD-TTg) | Long term (≥ 4 years) |
| Source: Mordor Intelligence | |||
Visa-On-Arrival Expansion Boosts Long-Haul Demand
Resolution updates in August 2025 extended visa-free entry to 24 countries with stays of up to 45 days, which broadened access for European travelers who previously faced more complex entry rules. The December 2025 expansion of e-visa validity and access further cut procedural friction by lengthening stays to 90 days and opening more ports of entry to international visitors, which has supported longer trips and higher room-nights. These changes coincided with strong entry growth from major long-haul and emerging markets through 2025, reinforcing the link between facilitation and realized travel. India also stepped up as a larger source market during 2025, reflecting how reduced administrative barriers and improved air connectivity help unlock pent-up demand. The cumulative effect in 2025 showed a longer average stay of 4.5 days compared to prior norms, which raised hotel demand without requiring the same percentage increase in arrival counts. Official visa-exemption lists and guidance confirm the scope of eligible countries and the policy intent to stimulate tourism and investment-grade travel segments.
Resilient Domestic Leisure Travel and Work-Cation Culture
Vietnamese travelers maintained momentum in 2024, delivering 110 million domestic trips and generating USD 32.96 billion in revenue, which allowed hotels to diversify beyond dependence on inbound demand flows to sustain occupancy during shoulder weeks and seasons.[1] The city of Hanoi posted a strong domestic event-led spike during August 2025 that included millions of visitors and meaningful same-month tourism revenue for the capital. Work-cations and self-drive itineraries gained traction among younger cohorts in 2025, which supported bookings for serviced apartments, homestays, and co-living formats near national parks and coastal corridors. This demand also buffered operators against currency swings and geopolitics that can influence inbound volumes, particularly from concentrated source markets in Northeast Asia. The pattern strengthened the case for dynamic pricing and flexible inventory across weekdays, weekends, and holiday periods to capture spontaneous domestic trips. Official tourism statistics corroborate the overall scale of domestic activity and the role of local events in driving monthly highs in key cities.
FDI-Fuelled Upscale Hotel Pipeline in Tier-2 Coastal Cities
Capital deployment into accommodation and food services remained active in 2025 as developers aligned projects with improved infrastructure and new coastal expressways, which pointed investment to Da Nang, Nha Trang, Phu Quoc, Hai Phong, and Cam Ranh. The coastal pipeline through 2028 concentrated a majority of rooms in mid to luxury tiers, and key anchor projects like the USD 1.72 billion Van Village in Da Nang signaled commitment to mixed-use schemes that include hotels and branded residential inventory alongside retail and leisure assets.[2]Passenger growth at coastal airports reinforced the demand thesis, supporting decisions to operate or open upscale resorts that combine hotel keys with villas to appeal to premium guests and longer stays. As global brands expand in these destinations, management-contract structures help local owners leverage loyalty engines and global distribution without relinquishing asset control. Incentives such as reduced corporate income tax rates for qualifying projects have been designed to improve project returns in areas prioritized for tourism-led development. Broader FDI inflow data underscores investor confidence in the country’s development cycle during 2025, which provides context for the hospitality-focused pipeline that is advancing in these coastal hubs.
Digital-Nomad Visas and Co-Living Hybrids
Vietnam’s 90-day e-visa framework gives remote workers latitude to plan multi-month stays without employer sponsorship, which in practice supports the digital-nomad segment even in the absence of a dedicated visa category. District 1 in Ho Chi Minh City maintained high occupancy during 2025 despite a pipeline of new rooms, helped by extended-stay guests who blend business travel and leisure, and by the return of events-based corporate bookings. New projects slated for 2026 include large, serviced apartment developments in Hanoi that combine hotel keys with long-stay layouts, aiming to capture demand from expatriates, consultants, and location-independent professionals. Branded-residence formats also allow owners to enter rental pools managed by hotel companies, which blends real-estate investment with hospitality operations and aligns incentives for long-stay performance. National directives encouraging digital and green transformation create funding pathways for smart-hotel retrofits that benefit extended-stay formats. The eventual adoption of longer-stay visa options would further strengthen this segment, positioning the Vietnam hospitality market to compete effectively for remote professionals across Southeast Asia.
Restraints Impact Analysis of Vietnam Hospitality Market*
| Restraint | (~) % Impact on CAGR Forecast | Geographic Relevance | Impact Timeline |
|---|---|---|---|
| Construction-material inflation is squeezing project ROIs | -1.3% | National, acute in Da Nang and Phu Quoc, where pipeline volume is highest | Short term (≤ 2 years) |
| Acute shortage of bilingual managerial talent | -0.9% | HCMC, Hanoi, Da Nang F&B and luxury segments | Medium term (2-4 years) |
| Slow licensing for mixed-use strata-title resorts | -0.5% | Coastal provinces (Khanh Hoa, Quang Nam, Kien Giang) | Medium term (2-4 years) |
| High dependency on Chinese/Korean air-lift capacity | -0.8% | National, with concentration risk in Northern and Southern gateway cities | Short term (≤ 2 years) |
| Source: Mordor Intelligence | |||
Construction-Material Inflation Squeezing Project ROIs
Construction input remained elevated in 2025, with sand prices at USD 17.65 per cubic meter, and steel in the USD 0.47-0.52 per kilogram range, together representing the bulk of materials cost for hotel projects. Listed contractors reported sharp profit declines in Q1 2025, and project delays increased, which affected speculative developments and caused owners to reassess schedules while waiting for clearer signals on input-cost normalization. Housing and construction materials inflation moderated month by month into late 2025 but remained above headline consumer inflation, which indicates persistent cost pressure that owners cannot pass through under fixed or semi-fixed management agreements. Rising bitumen costs, nearing USD 0.70 per kilogram, have also weighed on capex for access roads and related infrastructure that are vital for coastal destinations but do not always carry direct cash yields. With hotel yields often in the mid-single digits, the room for cost overruns is limited, so prolonged input inflation can erode project economics even in strong demand corridors. Official price and inflation indicators provide context for how input costs track against broader inflation and the likely timeline for relief to feed into pipeline restart decisions.
Acute Shortage of Bilingual Managerial Talent
The sector needs 40,000 workers per year, but training institutions supply only about half of that, creating persistent vacancies and promotion gaps at a time when upscale supply is growing.[3] Credentials vary widely across the workforce, with many frontline roles not meeting professional training standards required by luxury and MICE properties. Language capability is a major bottleneck, as a large share of reception and guiding roles do not meet foreign-language proficiency thresholds across key inbound languages beyond English. Major cities experience sustained staff shortages in food and beverage operations, and employers report difficulty recruiting experienced culinary and bar professionals, which affects service depth and menu innovation. Turnover is elevated in the first six months, and the uplift in management demand through 2026 has not been matched by returning talent that left the sector, pushing some operators to hire expatriates at higher cost. Government and media reports have repeatedly highlighted the skills gap and language constraints as key constraints on service quality and on the ability to monetize higher ADRs in upscale segments.
*Our forecasts treat driver/restraint impacts as directional, not additive. The impact forecasts reflect baseline growth, mix effects, and variable interactions.
Vietnam Hospitality Market Segment Analysis
By Type:
Independent Properties Retain Share, Chains Command PipelineIndependent hotels accounted for 69.88% of inventory and demand in 2025, supported by ownership structures where families and local groups control most properties and make decisions on capex and operations with long horizons. Chain brands are growing faster, with an 11.65% projected CAGR that reflects owners’ shift toward management contracts to capture loyalty traffic, consistent standards, and stronger revenue management engines. International operators expanded signings and openings through 2024 and 2025, which increased their footprint across mid to high-end classes and brought global distribution capabilities to coastal and urban nodes. Owners have found that management contracts let them retain asset ownership while outsourcing operations to specialists, which keeps real-estate optionality intact and elevates guest experience to match rising ADRs. Branded partnerships between domestic owners and international managers have become more common and demonstrate the value of brand flags in resort and city formats for both occupancy and rate performance. Accor announced new projects and continued to expand its portfolio in northern cities, while IHG and Marriott added brands and properties in destinations spanning Hanoi, Ha Long, Da Nang, and the Mekong Delta, reinforcing the premium positioning of the Vietnam hospitality market in regional pipelines.
Chains are gaining influence in gateway cities where corporate travel and MICE volumes reward brand recognition, and they also sign new-built coastal resorts that require more complex pre-opening support and larger distribution engines. Independent operators hold resilience in rural locations where guesthouses and homestays leverage OTA reach, but their urban position is increasingly contested by multinational brands with loyalty ecosystems. The market has seen new brand entries, including boutique and lifestyle flags that aim to capture domestic millennials and global travelers seeking design-led experiences at attainable rates. Distribution technology and data-driven pricing are now baseline requirements for competitive performance in major cities, which raises the bar for independents. As this rebalancing continues, international chains will likely consolidate their presence in upscale categories, while independent hotels continue to dominate numerically in budget and mid-scale segments. Marriott’s late-2025 opening of Legacy Mekong, Can Tho, Autograph Collection, and IHG’s first InterContinental in Ha Long illustrate how brand expansion aligns with demand corridors that underpin the Vietnam hospitality market outlook into 2031.
By Accommodation Class:
Mid-Market Anchors, Luxury OutpacesMid and upper mid-scale properties held 48.79% share in 2025, reflecting strong demand from regional package tours and the broader middle-income traveler who values location and consistency. This band of hotels caters to charter flows and family travel patterns to Nha Trang and Da Nang, which sustain healthy occupancy and keep ADRs within a narrow and predictable range for volume-oriented operators. The luxury tier is growing fastest at a 13.35% projected CAGR as branded residences and high-service resorts scale in Hanoi’s core districts and along coastal heritage sites. Premium residences with recognized brand management have posted strong price points and sell-through that reflect confidence in the long-run positioning of central districts and UNESCO-adjacent destinations. A raft of 2025 and 2026 openings in upper upscale and luxury confirms the tilt in supply to premium service attributes, which is also shaping labor and training needs in those segments. These moves signal that the hospitality industry in Vietnam will broaden the luxury footprint while preserving a strong mid-scale base that anchors volume.
Budget and economic formats face rising wage costs and exposure to OTA commissions, which increases the appeal of conversion to serviced apartments in urban locations with consistent 30–90-day demand. Serviced apartments supply expanded across HCMC and Hanoi through 2024, and new 2026 openings will add scale in mixed-use projects that combine hotel and residential keys to maximize yield across stay lengths. The mid-scale cluster remains vital to domestic family travel and short business trips, which helps sustain base occupancy across seasons. The luxury tier continues to attract diplomatic, corporate executive, and high-spend leisure segments that drive higher ADRs and premium ancillary revenue in spa, F&B, and experiences. As the pipeline delivers more branded villas and residences, operators will likely refine rental-pool structures that balance owner returns with hotel-level revenue management. Luxury projects in Hanoi and Ha Long, together with new products on the central coast, will continue to define the premium edge of the Vietnam hospitality market into 2026 and beyond.
By Booking Channel:
OTA Dominance Meets Direct-Digital FightbackOTAs held 58.85% of bookings in 2025, led by foreign platforms that benefit from high mobile penetration and deep inventory coverage across city and resort destinations. Hotels report direct-digital as the fastest-growing channel at a projected 14.36% CAGR, supported by upgraded websites, booking engines, wallet integrations, and CRM to capture repeat guests and lower acquisition costs. Dynamic pricing and last-minute release of inventory align with dominant booking windows of 0-7 and 15-30 days, which are widely observed in domestic and inbound bookings. Mobile-first behavior now defines the conversion journey, and operators that match OTA speed and clarity in direct channels can defend rate parity while capturing data advantages. Technology providers report strong momentum in direct distribution across Asia and in Vietnam, indicating that sustained investment should continue to yield incremental share shifts back to hotel-controlled channels. The same dynamics are visible in regional industry benchmarks, supporting the view that the Vietnam hospitality market is entering a more balanced distribution phase for operators with modern direct stacks.
Domestic OTAs and meta players are developing offers tailored to price-sensitive travelers, including instant refunds and zero-fee cancellations backed by local e-wallets. International OTAs still dominate in absolute share, especially for inbound journeys, but they face margin pressure as loyalty and promotions remain necessary to retain mindshare. Hotels are reducing reliance by investing in content and social-led marketing that links directly to booking pages with clear packages, transparent fees, and flexible terms. Corporate and MICE demand has recovered in Hanoi and HCMC, and has been supportive of premium ADRs and block bookings that translate into better forecast visibility. Wholesale and traditional agents remain relevant in markets like Japan and Taiwan that have older traveler segments, but those channels face gradual share erosion as digital booking continues to expand among younger cohorts. As operators rebalance distribution, the Vietnam hospitality market stands to capture more direct value creation through guest ownership and lower commission leakage, particularly among brands with strong loyalty ecosystems.

Geography Analysis
Southern Vietnam led regional performance with a 51.47% share of 2025 demand, anchored by HCMC’s corporate base, expat-driven long stays, and direct links across Southeast Asia that keep business travel steady through the year. Luxury occupancy in HCMC reached 83% in 2025 with ADR near USD 180, a combination that reflects both sustained corporate demand and measured net additions to upscale capacity. Tourism receipts in the city totaled USD 9.94 billion in 2025, which underscores the breadth of visitor segments that support lodging and ancillary spend. The region’s measured pipeline through 2026 helped keep pricing power intact in leading submarkets where demand outpaced new supply during the year. These dynamics confirm that the southern region holds the largest share of the Vietnam hospitality market and will likely continue to set the baseline for nationwide ADRs and occupancy.
The central coast and highlands recorded the fastest growth outlook in the Vietnam hospitality industry at a 13.36% projected CAGR, which aligns with major mixed-use developments and a coastal pipeline that places a majority of new rooms in mid to luxury tiers. Da Nang’s premium ADRs and occupancy reflect a widening distribution of upscale and upper upscale products, as well as improved expressways that shorten routes from Hue and Hoi An. New luxury properties have opened in Ha Long and Nha Trang, often combining hotels with villas, which attracts high-spend travelers who seek proximity to UNESCO sites and beachfront amenities. The region’s evolution also draws more international brands to operate resorts and residences, a shift that supports rate integrity and standardized service levels. As these assets come online, the central region’s share of the Vietnam hospitality market will grow while retaining strong mid-scale volume from charter and family travel.
Northern Vietnam sustained momentum through event-driven demand and brand-led luxury expansion, with properties opening or scheduled near signature districts in central Hanoi. Occupancy and ADR remain lower than HCMC in many segments, yet premium flags have committed to central locations where diplomatic missions and corporate offices cluster. Ha Long and Hai Phong add to the northern premium mix with new upper upscale properties and major developments that leverage lower land costs and improved access to coastal attractions. Expressways continue to increase weekend trip feasibility from the capital to northern coast and mountain destinations, which supports a healthy domestic leisure base. The region’s role in the Vietnam hospitality market will expand alongside brand openings and transport improvements, even as the south remains the largest regional contributor.
Regulatory Landscape
Vietnam hospitality regulation is led by the Ministry of Culture, Sports and Tourism (MOCST) and the Vietnam National Administration of Tourism (VNAT). The Law on Tourism No. 09/2017/QH14 and its implementing Decree 168/2017/ND-CP provide the core framework for tourism business conditions and service management. Hotel classification and star-rating practices draw on national standards, with TCVN 4391:2015 widely referenced as the base standard, while a revision process to update hotel classification criteria was underway as of October 2025.
Recent circulars continue to formalize tourism administration and service rules. Circular 04/2024/TT-BVHTTDL (effective August 20, 2024) amended requirements tied to travel business and tourism service professional certificates. Circular 15/2026/TT-BVHTTDL (issued June 23, 2026, effective August 15, 2026) set economic and technical norms for tourism promotion and branding services, shaping how public or program-linked tourism activities are specified and procured.
Value Chain Analysis
Vietnam hospitality value creation begins with destination enablement (aviation access, roads/expressways, and local attraction ecosystems), then moves through development and financing (land access, approvals, design, and construction), and into operations (management and franchise contracting, staffing and training, procurement, and asset maintenance). Distribution is dominated by digital channels, with OTAs accounting for 58.85% of bookings in 2025, while direct-digital capabilities (web booking engines, CRM, and wallet integrations) are being strengthened to reduce commission leakage and improve guest data ownership.
On the supply side, ownership remains fragmented, with roughly 75% to 80% of hotel supply described as independent or family-owned in 2026-oriented market commentary. This structure increases reliance on brand operators for standards, revenue management, and global distribution. Key bottlenecks sit upstream and midstream, and Resolution 80 (May 2026) highlighted institutional coordination, tourism infrastructure, and high-quality human resources as constraints, aligning with the report's broader shortage of bilingual managerial talent. Brand-led platforming is also tightening linkages across the chain, illustrated by Sun Group and Accor expanding a partnership covering nearly 6,000 keys (announced July 2026), which ties large-scale developers and international operators to destination-level infrastructure planning.
Competitive Landscape
Domestic leaders in the Vietnam hospitality industry continue to leverage vertical integration strategies while partnering with global brands under management contracts to strengthen service and distribution. International operators diversified their portfolios across city and resort destinations in 2024 and 2025, adding brands and properties that raised the bar for guest experience and revenue management practices. These moves align with the owners' focus on asset control paired with outsourced operating expertise, a model that is now common in the Vietnamese hospitality market. As brand presence grows in upscale tiers, independent owners retain scale in the budget and mid-range segments and compete with quality improvements and targeted digital investments.
Strategic expansion continued at a pace among global groups with a series of high-profile signings and openings. Accor signed a luxury project in Hai Phong that includes hotel keys and serviced apartments to capture corporate demand in an industrial hub that is expanding rapidly. IHG opened new luxury inventory in Ha Long and progressed additional upscale projects on the central coast to address rising demand in coastal and UNESCO-adjacent destinations. Marriott expanded along the Mekong with a late-2025 opening that introduced an Autograph Collection resort to Can Tho, which also marked a broader milestone for the group’s Asia-Pacific portfolio outside China. Hyatt opened its first property in Nha Trang in December 2025, adding beachfront inventory with MICE capability that targets regional group business.[4]
Technology and distribution strategy are now central to differentiation. Properties that deploy AI concierge services, IoT energy-management systems, and integrated wallet payments gain direct booking share and lower acquisition costs compared to reliance on intermediaries. Operators have also increased investment in content and social conversion, which enables rate parity and better monetization of short booking windows. Domestic initiatives in aviation and integrated destination development are expanding air access and diversifying leisure offerings in select markets. Bond and capital market actions by major operators have strengthened balance sheets to support pipeline execution and refurbishment programs across key assets. These decisions collectively indicate a focus on pricing power, service depth, and digital reach as the Vietnam hospitality market moves through the forecast horizon.
Vietnam Hospitality Industry Leaders
-
Vinpearl
-
Muong Thanh Hospitality
-
Marriott International
-
Accor
-
InterContinental Hotels Group (IHG)
- *Disclaimer: Major Players sorted in no particular order
Vietnam Hospitality Market Companies Covered in this Report
- Vinpearl
- Muong Thanh Hospitality
- Accor
- InterContinental Hotels Group (IHG)
- Marriott International
- Saigontourist
- Fusion Hotel Group
- Lodgis Hospitality
- Wyndham Hotels & Resorts
- Hilton
- Hyatt Hotels
- Best Western
- Radisson Hotel Group
- Sun Hospitality Group
- Diamond Bay Resort & Spa
- A25 Hotel Group
- H&K Hospitality
- Ascott
- Six Senses
- Novotel (Accor)
Market Opportunities and Future Outlook
Branded and professionally managed supply has a clear whitespace in urban extended-stay and serviced-apartment formats. Policy-enabled longer stays, including 90-day e-visa access, alongside sustained demand in Ho Chi Minh City and Hanoi for 30 to 90-day itineraries across corporate, expatriate, and remote-work adjacent segments, supports this opportunity. The operational focus is on converting or repositioning assets toward longer-stay layouts and strengthening direct-digital acquisition, particularly when OTAs still controlled 58.85% of bookings in 2025 and operators are investing in CRM and mobile-first booking to improve repeat capture.
Destination-linked development is also creating investable corridors where hospitality, transport, and master planning are being coordinated. Decision 509/QD-TTg (approved 2024) established a national tourism system master plan with large investment allocations for 2026-2030, while the National Digital Economy and Digital Society Development Programme (Decision 1033/QD-TTg, June 2026) included a mandate for 70% of tourism establishments to use digital platforms by 2030, pushing adoption of standardized data and digital operations. On-the-ground supply catalysts include Sun Group commencing the operational phase of an accommodation ecosystem in Phu Quoc with 2,000 rooms opening in 2026 as part of a broader 17,400-room plan aligned with APEC 2027 readiness, and the start of construction on the Ho Tram-Long Thanh International Airport expressway (July 2026), positioned to shorten access and expand viable catchments for resorts and weekend leisure demand.
Recent Industry Developments in Vietnam Hospitality Market
- July 2026: Accor and Sun Group signed a strategic agreement to develop over 5,300 hotel, resort, and serviced residence keys across Vietnam, including destinations such as Phu Quoc and Da Nang. The pipeline adds further brand variety (including lifestyle and serviced-residence concepts) and increases execution capacity for a large domestic developer partnering with an international operator. The tie-up raises competitive pressure on independent owners in resort corridors where branded distribution and standards are becoming a procurement and financing advantage.
- April 2026: IHG Hotels and Resorts partnered with Cangio Tourist City Corporation to introduce InterContinental, Crowne Plaza, Holiday Inn Express, and Garner Hotel into the Vinhomes Green Paradise Can Gio development in Ho Chi Minh City, totaling over 1,000 rooms. This brings multiple international brands into a single master-planned coastal urban project, reinforcing how integrated developments create new demand nodes. The multi-brand approach also broadens price-point coverage, supporting year-round utilization beyond peak leisure periods.
- May 2024: IHG Hotels and Resorts announced a two-hotel deal in Quang Binh, extending its footprint into an emerging destination outside the main gateway and beach hubs. The agreement adds branded capacity planning into a province building tourism relevance, supporting a wider geographic spread of chain-led supply. It also reflects how international operators use development partners to enter secondary locations where independent inventory has historically dominated.
Vietnam Hospitality Market Report Scope and Research Methodology
Market Definition and Coverage
For this study, the market covers revenues generated from paid stays across Vietnam's accommodation industry, counted across hotel and serviced accommodation supply and the bookings tied to those stays, measured in USD value.
Scope exclusions: We exclude air travel, tours, attractions, and restaurant-only revenues that are not part of lodging stays.
Segments Covered in This Report
- By Type
- Chain Hotels
- Independent Hotels
- By Accommodation Class
- Luxury
- Mid & Upper-Mid-scale
- Budget & Economy
- Service Apartments
- By Booking Channel
- Direct Digital
- OTAs
- Corporate / MICE
- Wholesale & Traditional Agents
- By Geographic Region
- Northern Vietnam (Hanoi & surrounds)
- Central Coast & Highlands
- Southern Vietnam (HCMC & Mekong)
Data Sources, Market Sizing, and Validation
Desk Research
Desk work started with public tourism and macro demand signals, so the size model is anchored to realistic travel and stay volume in Vietnam. We referenced sources such as Vietnam National Administration of Tourism releases, General Statistics Office of Vietnam datasets, UNWTO tourism indicators, World Bank macro series, and Vietnam Customs trade summaries for travel-related spending proxies, and then cross-checked those signals against reputable press and association updates.
On the supply side, we reviewed company annual reports, investor presentations, and property announcements to track room additions, repositioning, and pricing direction by class. When needed, paid subscriptions focused on company financials and intelligence, news and financials, and patent databases were used to cross-check business footprints and key timeline events. These desk research sources are not exhaustive, and other public documents were also used for data collection, validation, and clarification.
Primary Interviews and Surveys
Primary work was used to confirm what the desk indicators could not show cleanly, especially the split between chain and independent supply, typical occupancy swings by season, and how room rates are being reset after demand shocks. We spoke with accommodation operators, booking channel participants, property consultants, and corporate travel planners across the main travel corridors, and respondent input was used to tighten assumptions and resolve gaps before totals were finalized.
Distribution of primary research fieldwork respondents
| Company type | Respondent position |
|---|---|
| Top tier: 31% | CXOs: 15% |
| Mid tier: 49% | Functional/Unit leaders: 33% |
| Smaller Players: 20% | Managers: 52% |
Market-Sizing & Forecasting
Sizing starts with a top-down build where the demand pool is reconstructed from inbound and domestic trip trends and then translated into room nights, occupancy, and average daily rate (ADR) by accommodation class. Since ADR in Vietnam can change quickly with inflation, exchange rates, and local event cycles, USD values were derived using consistent currency timing and then checked against observed pricing in key cities and resort areas.
To keep totals realistic, we corroborated the outputs with selective bottom-up approximations, including sampled property counts by region, capacity additions, and a simple ADR x occupied room nights check for representative classes. Inputs that matter most in this market include room supply additions and closures, occupancy seasonality (holiday peaks versus shoulder months), ADR progression by class, share shift toward digital bookings, and business travel and MICE intensity in large urban nodes. Forecasts lean on scenario analysis supported by expert views on tourism growth, new room pipelines, and pricing discipline, and then the model is adjusted where a variable breaks the historic relationship.
Data Validation & Update Cycle
Validation is done by comparing model outputs against independent travel signals, such as visitor arrivals, hotel performance commentary, and observed changes in room supply and rate positioning. When a variance is spotted, assumptions are revisited, and a follow-up is triggered with the most relevant respondents so the adjustment is not guesswork.
Before sign-off, the build goes through multiple analyst reviews with focused checks on unit consistency, currency conversion timing, and year-over-year growth sanity. Reports are refreshed annually, and interim updates are made when material events shift demand or supply, followed by a final pre-delivery review so clients receive the latest updated view.
Mordor Intelligence's Vietnam Hospitality Market Sizing Compared With Other Published Estimates
Published numbers for Vietnam hospitality can look far apart because authors often count different parts of the stay economy, choose different base years, and apply different currency timing when converting local pricing into USD. Differences also show up when ADR and occupancy are assumed from broad macro trends rather than being tested against operator feedback.
In our refresh-led approach, the checks that matter most are the timing of exchange-rate conversion, how ADR is stepped up by class, and whether occupancy seasonality is kept intact year to year, and this is why Mordor Intelligence reports a higher value once 2025 is used as the base and price resets are validated with current channel and operator inputs.
Benchmark comparison
| Source | Market Size | Gaps in Research Methodology |
|---|---|---|
| Mordor Intelligence | USD 25.67 B (2026) | |
| Industry Publisher A | USD 6.19 B (2024) | Uses an earlier base year and a broader definition set that appears to understate USD revenue per stay by applying aggressive multi-year growth without clearly showing ADR and occupancy validation steps for Vietnam. |
| Consultancy Brief B | USD 6.13 B (2024) | Anchors the market to 2024 and blends lodging types with limited transparency on currency timing and class-wise ADR progression, which can compress the value when rates are moving and supply is being upgraded. |
The spread mainly comes from base year choice and the mechanics behind ADR, occupancy, and USD conversion, which can change the value quickly in a price sensitive travel market. By keeping those inputs explicit and rechecked when new signals arrive, we end up with a number that is easier to trace back to real demand, capacity, and pricing behavior.
Key Questions Answered in the Report
What is the Vietnam hospitality market’s size and growth outlook to 2031?
The Vietnam hospitality market size was USD 25.67 billion in 2026 and is projected to reach USD 38.01 billion by 2031 at an 8.17% CAGR, reflecting policy-driven growth and rising long-haul demand.
Which segments lead and grow fastest across type, class, channel, and region?
Independent hotels led with 69.88% share in 2025, while chains posted the fastest growth; mid and upper mid-scale held 48.79% share, while luxury grew fastest; OTAs held 58.85% share, while direct digital grew fastest; the south led with 51.47% share, while the central coast and highlands are the fastest growing.
What policy changes most influence the Vietnam hospitality market in 2026?
Visa exemptions expanded to 24 countries with 45-day stays and broader 90-day e-visa access, which reduced travel friction and lengthened stays, especially from Europe, India, and Russia.
How are booking channels shifting for hotels in Vietnam?
OTAs remain dominant, but direct-digital is growing the fastest due to AI chatbots, wallet integrations, and social-led conversion, which lowers acquisition costs and improves guest data ownership for operators.
Where are new upscale and luxury openings concentrated?
Upscale and luxury openings are concentrated along the central coast and in northern hubs like Ha Long and Hanoi, with notable 2025 and 2026 projects under global brands augmenting supply in key destinations.
What risks could temper the Vietnam hospitality market’s growth?
Elevated construction input costs, managerial talent shortages with language gaps, slow licensing for mixed-use resorts, and concentration of inbound airlift from China and South Korea are the primary headwinds shaping near-term risk.