
Market Overview
| Study Period | 2020 - 2031 |
|---|---|
| Forecast Data Period | 2026 - 2031 |
| Base Year Market Size (2025) | USD 8.44 Billion |
| Market Size (2026) | USD 8.9 Billion |
| Market Size (2031) | USD 11.59 Billion |
| Growth Rate (2026 - 2031) | 5.44 % |
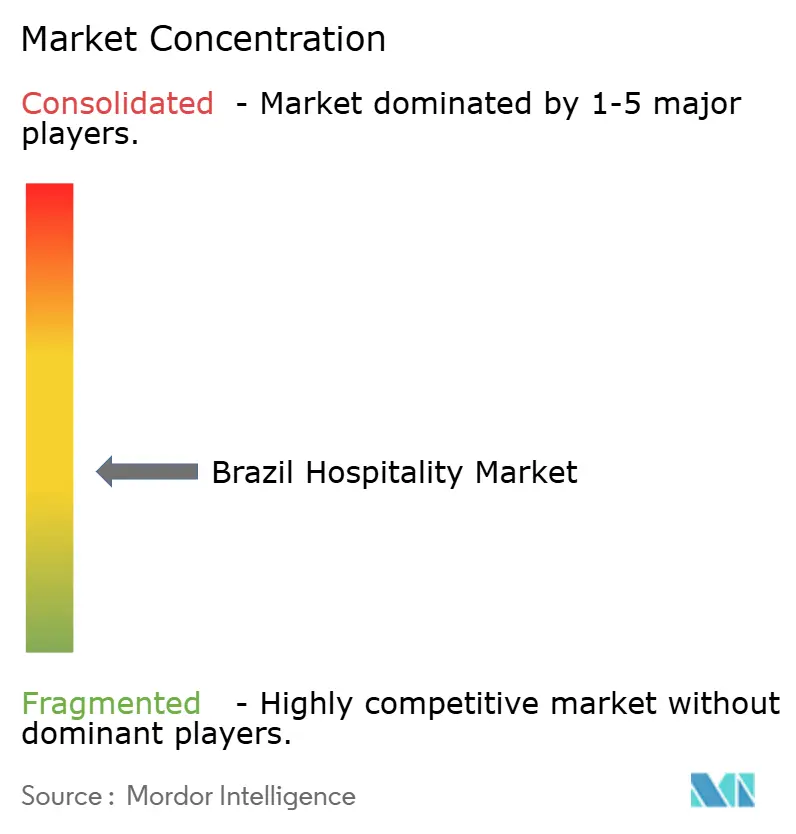
| Market Concentration | Medium |
Major Players *Disclaimer: Major Players sorted in no particular order Image © Mordor Intelligence. Reuse requires attribution under CC BY 4.0. | |
Brazil Hospitality Market Analysis by Mordor Intelligence
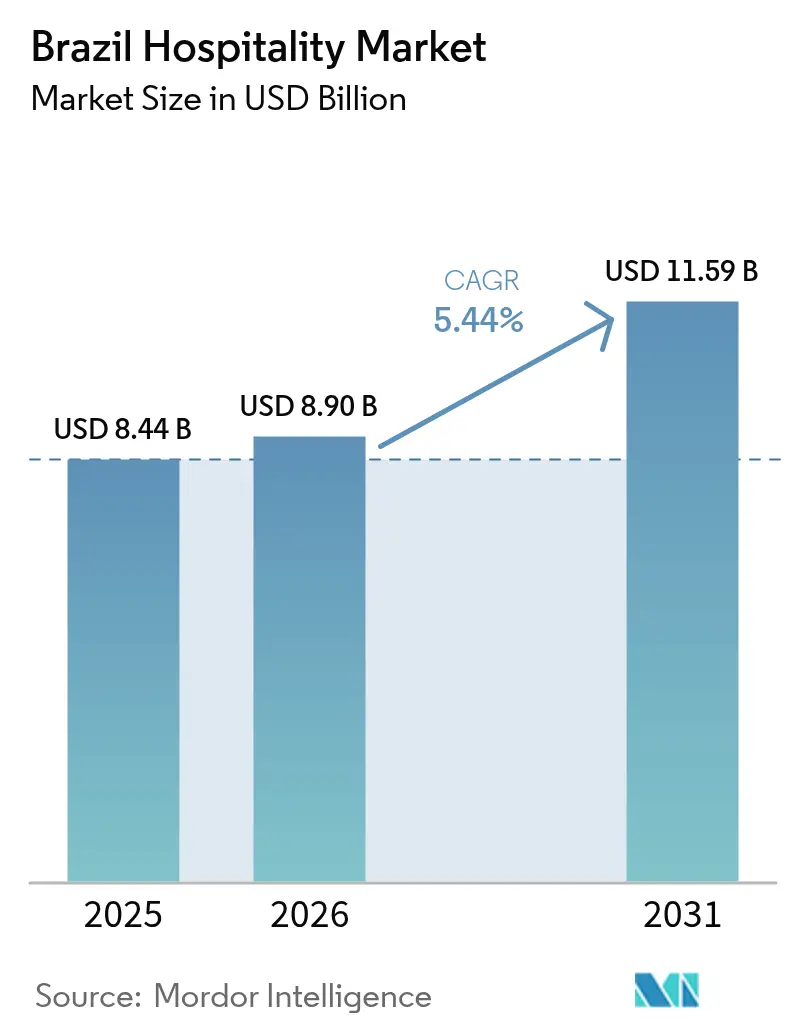
Brazil Hospitality Market size in 2026 is estimated at USD 8.9 billion, growing from 2025 value of USD 8.44 billion with 2031 projections showing USD 11.59 billion, growing at 5.44% CAGR over 2026-2031.
Rising domestic disposable income, accelerated PIX adoption, and pre-COP-30 infrastructure spending are creating a virtuous demand cycle that keeps room revenue on an upward trajectory. Chain operators are capitalizing on franchise conversions and loyalty-program scale, while independent players leverage local character to attract high-spending leisure guests. Direct digital channels continue to erode intermediary dependency, and the pipeline of new rooms remains well-balanced relative to expected arrivals, ensuring disciplined rate growth. Persistent airport slot limits and service-tax complexity weigh on profitability, yet sustained capital inflows from both foreign and local investors signal confidence in the long-term fundamentals of the Brazil hospitality market.
Key Report Takeaways
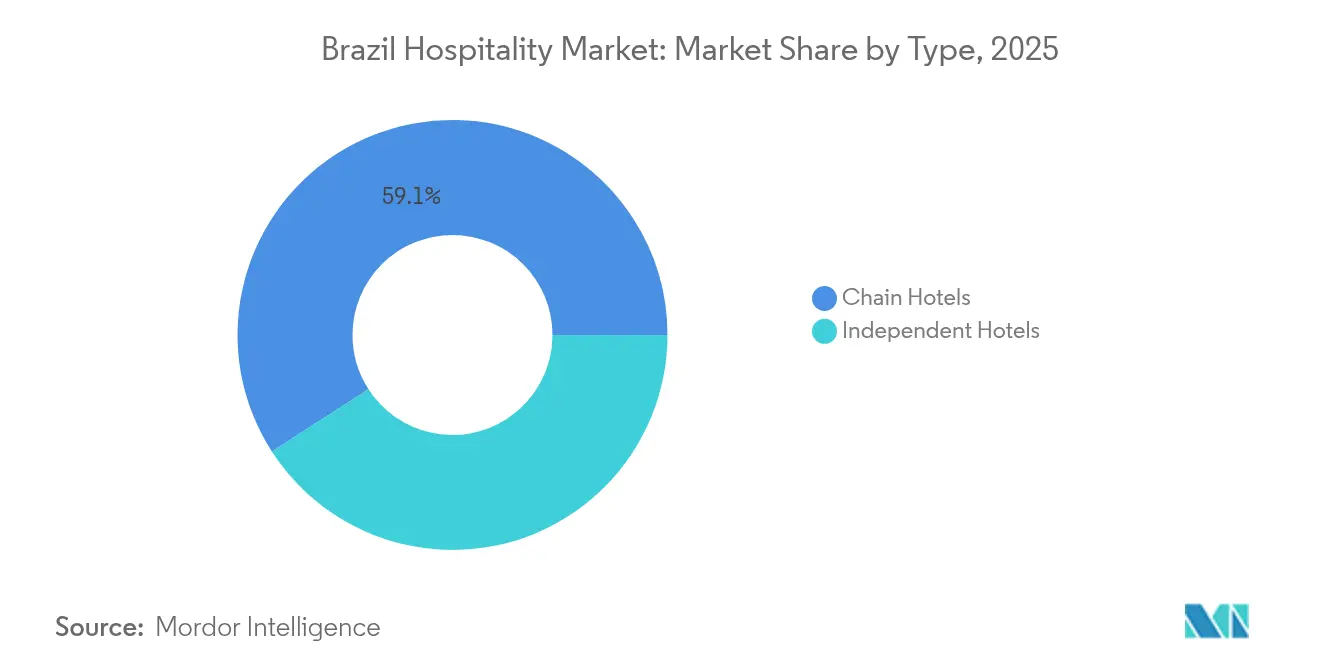
- By type, chain hotels captured 59.12% of the Brazil hospitality market share in 2025, and they are also projected to remain the fastest-growing sub-segment with a 7.29% CAGR from 2026 to 2031.
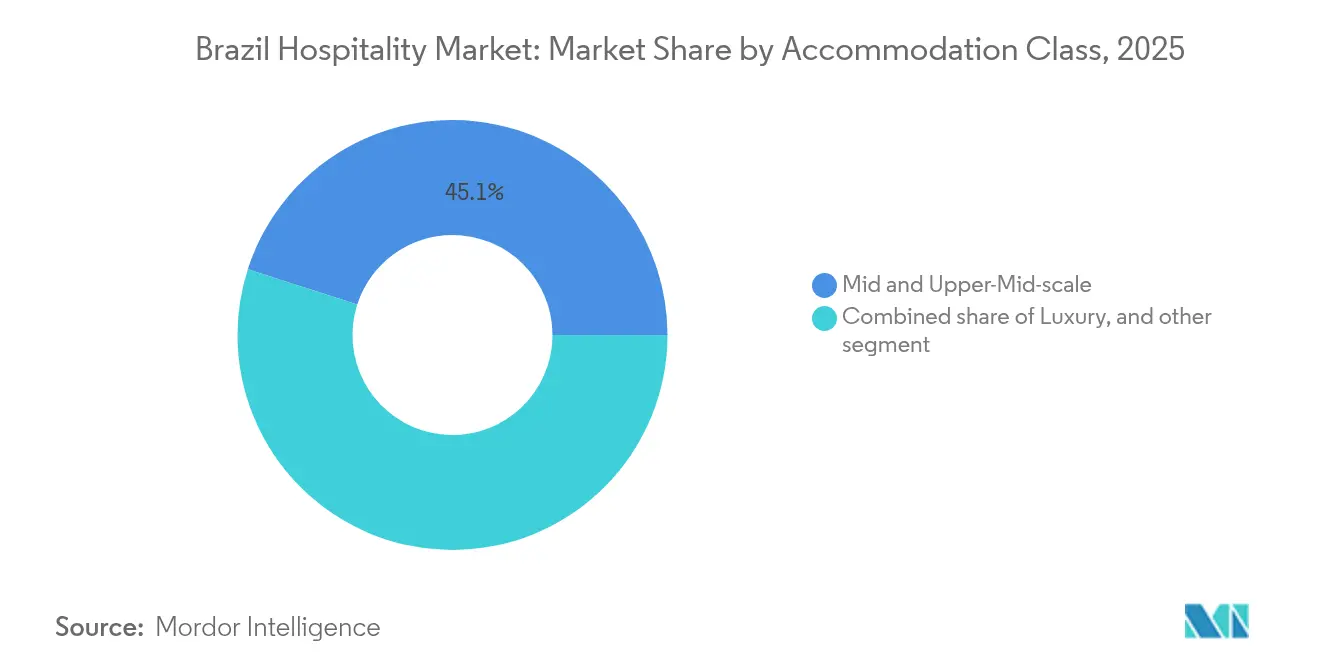
- By accommodation class, mid and upper-mid-scale properties accounted for 45.05% of the Brazil hospitality market share in 2025, while service apartments are expected to lead growth with the highest CAGR of 11.05% over 2026–2031.
- By booking channel, OTAs represented 42.60% of the Brazil hospitality market size in 2025, but direct digital channels are forecasted to expand the fastest with a 13.48% CAGR during 2026–2031.
- By geographic region, Southeast Brazil contributed 54.75% of the Brazil hospitality market share in 2025, whereas the North region is anticipated to register the fastest growth at 7.24% CAGR in the 2026–2031 period.
Note: Market size and forecast figures in this report are generated using Mordor Intelligence’s proprietary estimation framework, updated with the latest available data and insights as of 2026.
Brazil Hospitality Market Trends and Insights
Drivers Impact Analysis*
| Driver | (~) % Impact on CAGR Forecast | Geographic Relevance | Impact Timeline |
|---|---|---|---|
| Post-Covid inbound surge from Chile, Argentina & USA | +1.2% | Southeast, South | Short term (≤ 2 years) |
| Domestic leisure boom tied to PIX instant-payment adoption | +0.9% | National | Medium term (2-4 years) |
| RevPAR lift from large-scale events | +0.7% | Southeast, North | Short term (≤ 2 years) |
| Expansion of low-cost regional airlines | +0.6% | North, Northeast, Central-West | Medium term (2-4 years) |
| Lula’s green-credit line for eco-lodges | +0.4% | Amazon, Pantanal | Long term (≥ 4 years) |
| Second-home hotelisation in northeast beach towns | +0.3% | Northeast | Long term (≥ 4 years) |
| Source: Mordor Intelligence | |||
Post-Covid inbound surge from Chile, Argentina & USA
International arrivals eclipsed pre-pandemic peaks in 2024 as Argentina, Chile, and the USA accelerated outbound travel to Brazil, propelling Rio de Janeiro and São Paulo to eight-year RevPAR highs during Carnival 2025. LATAM Airlines expanded trans-Atlantic capacity by 36%, signaling durable demand from the Spain and Portugal corridors[1]. November 2024 saw 2.1 million international passengers, a 14% jump versus 2023, and average visitor spend reached USD 2,177, the world’s seventh-highest. The favorable BRL exchange rate made Brazil comparatively inexpensive, redirecting Brazil travelers toward domestic destinations and reinforcing hotel occupancy uplift in gateway cities. Hotels leveraged loyalty promotions and bundled event packages to capture incremental demand around mega-events, boosting ADRs well beyond 2019 benchmarks. Industry stakeholders anticipate sustained momentum as airlift rebuilds and visa policies streamline group-travel facilitation.
Domestic leisure boom tied to PIX instant-payment adoption
PIX processed over BRL 1 trillion (USD 200 billion) monthly transactions in 2024 and attracted 170 million unique users, democratizing online travel booking and triggering spontaneous weekend getaways. Hotels integrating PIX at checkout reported 16% revenue gains and 25% customer-base growth, underscoring the linkage between instant settlement and booking conversion rates. Financial inclusion enabled first-time travelers from lower-income brackets to access dynamic pricing, expanding shoulder-period demand. Cross-border PIX pilots with Paraguay and Argentina further enlarged Brazil’s regional tourism catchment, as 236,320 Paraguayan visitors used PIX in 2024 alone. By 2025 PIX is on track to represent 44% of domestic digital commerce, surpassing credit cards for the first time. Hospitality operators are refining revenue-management algorithms to reflect PIX-driven booking velocity and micro-segmented stay patterns that prioritize two-night breaks in secondary markets[2].
RevPAR lift from large-scale events (Rock in Rio, COP-30)
Mega-events consistently drive occupancy and average daily rate (ADR) far above seasonal norms. Rock in Rio 2024 pushed Rio’s ADR to approximately USD 181.44, marking a 35.5% year-over-year increase, while the G20 summit elevated ADR above USD 232, with peak rates nearing USD 560. COP-30 is prompting Belém to more than double its room supply to 50,000 beds, with projected ADR approaching USD 500. The federal government has allocated about USD 44.8 million for the development of a 500-room leaders’ village, underscoring the synergy between event-driven demand and infrastructure investment. Long-term benefits include improved urban mobility, strengthened public security, and extensive international exposure through destination marketing—effects that endure well beyond the event timelines. To maximize revenue during these high-compression periods, operators are launching pop-up F&B concepts and premium experiential packages, resulting in significant RevPAR spikes that substantially boost annual profitability.
Expansion of low-cost regional airlines
LATAM’s addition of 2,000 monthly domestic flights and GOL’s new Belém–Miami service are examples of network growth that activate latent hotel demand in tier-2 and tier-3 markets. Twenty-six new aircraft scheduled for Brazilian deployment equate to 13% fleet growth, opening point-to-point connections between secondary hubs and Guarulhos. Parallel USD 250 million investments in Guarulhos’ new passenger pier boost runway capacity and operational resilience during peak traffic. Enhanced connectivity reduces travel time and cost for leisure and corporate guests alike, encouraging developers to consider mid-scale hotels in agribusiness corridors. Hotel pipelines in Goiania, Cuiabá, and Manaus illustrate how aviation liberalization is recalibrating geographic revenue distribution across the Brazil hospitality market.
Lula’s green-credit line for eco-lodges
The federal green-credit scheme subsidizes sustainability-certified lodge developments in the Amazon and Pantanal, lowering borrowing costs by up to 300 basis points compared with commercial rates. Investors leverage these incentives to retrofit existing jungle lodges with solar arrays and wastewater recycling, enhancing operating margins and eligibility for global tour operator partnerships. Demand for low-impact travel experiences aligns with post-pandemic consumer preferences toward wellness and nature, allowing operators to command ADR premiums while diversifying Brazil’s tourism portfolio. The program also stimulates local supply chains through timber certification and indigenous community engagement, creating shared value that resonates with ESG-focused asset managers. The long-term timeline indicates a gradual but steady contribution to national occupancy growth.
Restraints Impact Analysis*
| Restraint | (~) % Impact on CAGR Forecast | Geographic Relevance | Impact Timeline |
|---|---|---|---|
| Chronic airport slot constraints at Congonhas & Santos-Dumont | -0.8% | Southeast | Medium term (2-4 years) |
| Persistent double-digit service-tax burden (ISS + ICMS) | -1.1% | National | Long term (≥ 4 years) |
| Elevated real-estate costs in prime Southeast markets | -0.5% | São Paulo Faria Lima and Rio Zona Sul | Medium term (2-4 years) |
| High OTA commission structures eroding independent-hotel margins | -0.4% | Nationwide, acute for leisure destinations | Short term (≤ 2 years) |
| Source: Mordor Intelligence | |||
Chronic airport slot constraints at Congonhas & Santos-Dumont
Slot caps at Santos-Dumont restrict annual throughput to 6.5 million passengers, distancing corporate travelers from central Rio and deflecting traffic to Galeão, whose financial viability depends on hitting 25 million travelers yet remains below 9 million[3]. Congonhas expansion debates mirror Rio’s gridlock as Aena’s redevelopment plan fails to unlock substantial additional slots before 2027. Limited peak-hour frequencies push business clients toward higher-fare windows or alternative transport, compressing weekday occupancy in premium hotels located near financial districts. Hotel investors are delaying upgrades to meeting-space inventory pending clarity on slot policy, slowing capex cycles that would otherwise enhance Brazil's hospitality market competitiveness. Airlines advocate for slot reallocation mechanisms, but municipal opposition tied to noise-abatement weighs on policy change probability.
Persistent double-digit service-tax burden (ISS + ICMS)
Cumulative tax takes often exceed 20% when municipal ISS rates of up to 5% stack atop state ICMS ranging 17%–19%, squeezing net operating income. The 10-year phased replacement of ISS/ICMS with IBS and CBS should lower compliance complexity, yet uncertainty over apportionment keys and transition credits fosters investor hesitation[4]. Smaller operators divert managerial resources to reconcile split invoicing of accommodation (ISS-taxed) versus F&B (ICMS-taxed), raising administrative overhead. Transfer-pricing scrutiny on management-fee flows constrains multinational chains’ ability to centralize services, adding friction to portfolio expansion. Although recent rulings exclude municipal tax from PIS/COFINS-Import bases, relief benefits import-heavy luxury properties more than domestic mid-scale operators, perpetuating uneven impact across segments.
*Our forecasts treat driver/restraint impacts as directional, not additive. The impact forecasts reflect baseline growth, mix effects, and variable interactions.
Segment Analysis
By Type: Chain dominance and conversion momentum
Chain Hotels accounted for 59.12% of the Brazil hospitality market size in 2025, benefiting from strong brand recall and nationwide distribution. Their 7.29% CAGR outlook reflects robust franchise demand and pipeline additions by Accor, Hilton, and Marriott. Loyalty programs funnel repeat guests, while centralized procurement lowers cost per available room. Independent properties, holding the remaining 40.88%, leverage local charm in beach and eco-destinations but struggle with marketing scale. Conversion activity accelerates as owners seek the revenue premium derived from brand affiliation. Franchise agreements now include technology bundles such as integrated channel managers and PIX-enabled direct booking engines that boost net ADR. Independent hoteliers who resist branding focus on niche positioning and partnerships with regional OTAs to defend occupancy. The divergent strategies keep both segments relevant, yet the Brazil hospitality market continues to skew toward professionally managed chains in gateway and secondary cities.
Chain operators deploy asset-light models to extend reach without balance-sheet burden, aligning with investors’ preference for annuity-style income. Management contracts increasingly include ESG performance clauses that tie incentive fees to energy-efficiency metrics, a trend that resonates with global capital allocators. Independent clusters in heritage centers like Paraty differentiate through cultural programming and farm-to-table gastronomy, scoring top guest-satisfaction indexes despite lower marketing budgets. Both segments contend with rising labor costs, prompting experimentation with contactless check-in and housekeeping on demand. Ultimately, hybrid alliances—where independents join soft brands—could blend brand power with local authenticity and further reshape competitive dynamics within the Brazil hospitality market.

By Accommodation Class: Mid-scale breadth and serviced-apartment acceleration
Mid & Upper-Mid-scale hotels captured 45.05% share of the Brazil hospitality market size in 2025, serving price-sensitive business travelers and an expanding middle class. Average pipeline length sits at 24 months, faster than luxury projects, enabling timely response to demand spikes from regional events. Service Apartments, while holding smaller base inventory, are projected to log an 11.05% CAGR through 2031, the fastest among all classes, as relocation assignments, digital nomadism, and extended tourist stays gain traction. Brands such as Adagio and Hyatt House roll out modular designs that cut development time by 15% and allow flexible unit mix.
Luxury demand rebounds in destinations such as Ceará, where four resorts with nightly rates of up to R$15,000 open by 2026, catering to high-net-worth adventure seekers. Deep-pocketed guests drive clusters of ancillary revenue from private surf charters to heli-tours lifting total-spend per occupied room. Budget & Economy hotels face compression of net ADR as tax and utility costs rise, but they remain indispensable in transport corridors frequented by truck drivers and domestic tour groups. With eco-lodges gaining access to subsidized green finance, a new sub-segment of rustic-luxury emerges, enabling rate premiums while meeting sustainability goals. The resulting class stratification enhances choice for consumers and diversifies revenue streams across the Brazil hospitality market.
By Booking Channel: Disintermediation gains pace
Online Travel Agencies retained 42.60% share of the Brazil hospitality market size in 2025, leveraging search aggregation and marketing heft. Yet Direct Digital bookings are rising at 13.48% CAGR as hotels integrate PIX, chatbot-driven customer service, and loyalty-driven rate parity on their websites. Net ADR can improve up to 8 percentage points when reservations bypass intermediaries, prompting chains to offer member-exclusive discounts. Corporate/MICE platforms rebound as multinationals reinstate in-person meetings; however, virtual-hybrid event formats temper long-haul group demand. Wholesale & Traditional Agents persist in handling government delegations and pilgrimage groups but confront shrinking commissions.
Mobile-first Brazilians increasingly rely on social-media-linked booking widgets that convert inspiration into instant transactions, shortening the look-to-book window. OTAs counter by bundling airfare and ground transport, deepening loyalty through tiered reward schemes. Hotels employ CRM analytics to mine repeat-guest data, tailoring upsell offers such as late-checkout and co-working passes. The resulting tug-of-war cultivates healthier channel-mix discipline, positioning the Brazil hospitality market for higher margin resilience.
Geography Analysis
The Southeast region represented 54.75% of the Brazil hospitality market share in 2025 on the strength of São Paulo’s corporate hub and Rio de Janeiro’s event magnetism. Congonhas and Santos-Dumont slots constrain weekday frequency, yet Guarulhos’ USD 250 million terminal project will ease international surges by 2028. Hotel pipelines concentrate on conversion opportunities near financial districts, where land scarcity heightens barriers to entry. Rate ceilings are tested during mega-events, reaffirming the region’s pricing power.
The North posts the fastest 7.24% CAGR through 2031, buoyed by COP-30 preparations that will raise Belém’s room count from 18,000 to 50,000. Federal investments extend beyond hospitality to urban mobility, enhancing tourist mobility within the Amazon gateway. Eco-cruise operators collaborate with lodges to offer multi-modal itineraries, lengthening average stay. Local authorities facilitate expedited licensing for projects using sustainable materials, expediting supply timelines. The boom seeds long-term potential for biodiversity tourism and scientific expeditions that demand specialized lodging.
In the Northeast, established sun-and-sand corridors continue to attract domestic families and European charters. Ceará’s high-end pipeline, including branded golf-resorts and private-villa enclaves, signals confidence in premium leisure demand. South and Central-West regions rely on agribusiness-driven corporate demand; occupancy stabilizes on weekdays but dips on holidays, resulting in balanced yet modest growth rates. Overall, geographic diversification cushions operators against regional shocks and maintains aggregate stability for the Brazil hospitality market.
Regulatory Landscape
Brazil hospitality is overseen federally by the Ministerio do Turismo (MTur), which sets sector programs and publishes normative acts, while operators also navigate layered municipal and state taxation on services and F&B. Cadastur (Cadastro de Prestadores de Servicos Turisticos) functions as the mandatory registry for lodging and other tourism-service providers under the General Tourism Law framework (Lei 11.771/2008, as modernized by Lei No. 14.978 of September 2024), shaping eligibility for participation in federal programs and visibility in official tourism systems.
Digital compliance has increased through MTur measures, including Portaria MTur No. 41 (November 2025) establishing the FNRH Digital (digital National Guest Registration Form) for lodging facilities. On the investment facilitation side, Portaria MTur No. 10 (March 18, 2026) set an implementation plan for the Private Investment Attraction Program for Tourism (2024-2027), including a target to map 30 tourism projects by 2027, which ties regulation to a more structured pipeline of bankable tourism and hospitality projects.
Value Chain Analysis
Brazil hospitality value creation starts with real estate development and conversion, then moves through financing (including federal mechanisms linked to MTur and the broader tourism investment agenda), construction and fit-out, and finally operations led by chains, independent owners, and third-party managers. International and domestic groups such as Accor, Hilton, Marriott, Atlantica, and Vila Gale anchor the brand and operating layer, while demand capture increasingly runs through a mix of OTAs and direct digital channels, reinforced by PIX-enabled payments and loyalty ecosystems that support disintermediation.
On the distribution and enabling-services side, airline connectivity, destination infrastructure, and public-sector project packaging shape where and how supply is added, particularly beyond the main Southeast hubs. MTur initiatives such as Portaria MTur No. 6 (February 2026) on Tourism Mobility and Connectivity and Portaria MTur No. 10 (March 2026) on private investment attraction formalize how projects are surfaced and supported, linking hospitality growth with transport and destination upgrades. The active pipeline indicates scaling activity across developers, brands, and management partners, including a 178-hotel development pipeline reported for 2026 with about R$13.6 billion in planned investment, increasing the importance of standardized procurement, local contractor capacity, and technology vendors that enable compliant guest registration and channel management.
Competitive Landscape
The leading hotel groups hold a significant share of the Brazil hospitality market, yet the landscape remains sufficiently open to support the entry and growth of new competitors. Accor holds a leading position, thanks to its diversified brand portfolio ranging from budget-friendly options like Ibis to high-end offerings such as Fairmont. A well-established loyalty program with millions of members in Brazil further reinforces its strong presence. Hilton is pursuing an ambitious growth strategy, aiming to significantly expand its presence by the end of the decade, with a focus on secondary coastal cities using its Hampton and Curio Collection brands. Marriott, meanwhile, is rolling out its City Express brand to attract cost-conscious business travelers and small enterprises, signaling a targeted push into more affordable, utilitarian segments.
Local group WAM accelerates with a RMB 500 million (USD 69.76 million) resort complex in Paraíba, exemplifying domestic capital’s appetite for greenfield development. Aparthotel innovators like HQ Hotels enter São Paulo via asset-light partnerships with Wyndham and sbe, blending extended-stay layouts with celebrity chef venues. Technology funnels differentiate players: cloud-based revenue management, AI-driven demand forecasting, and PIX-integrated check-out streamline operations. ESG performance becomes a tender criterion for corporate RFPs, rewarding chains that embed carbon-tracking dashboards.
M&A potential remains high as family-owned independents seek exit options post-pandemic. Franchise conversions proceed swiftly due to standardized PIP (property improvement plan) templates that reduce downtime. Legislative progress on VAT reform could unlock additional deal flow by clarifying cross-border tax credits. As product-class adjacency blurs think luxury tented camps or branded residences operators refine portfolio strategies to defend RevPAR and capture share in the evolving Brazil hospitality market.
Brazil Hospitality Industry Leaders
-
Accor SA
-
Atlantica Hospitality
-
Intercity Hotels
-
Marriott International Inc.
-
Hilton Worldwide Holdings Inc.
- *Disclaimer: Major Players sorted in no particular order
Market Opportunities and Future Outlook
Digitization and formalization of lodging operations create room for property-level technology upgrades and managed-services models, particularly for independents and conversions that need to align with MTur requirements such as FNRH Digital while also improving channel mix through direct digital and PIX acceptance. Evidence of fast compliance adoption is visible for 2026, with MTur reporting FNRH Digital uptake surpassing 4,000 lodging facilities, reinforcing demand for PMS integrations, identity and guest-data workflows, and outsourced compliance support tailored to Brazilian operating realities.
Investment-led growth beyond core capitals stands out as a concrete opportunity area, supported by the MTur private investment attraction program (PNT 2024-2027) and by brand pipelines targeted at secondary markets. In 2026, the reported pipeline of 178 projects (26,302 new housing units) totaling around R$13.6 billion through 2030, with most projects outside major urban centers, points to expansion in interior business corridors and emerging leisure destinations where midscale, economy, and extended-stay formats can be replicated efficiently. Corporate commitments also underline where development models are concentrating, including Marriott disclosing plans to add 110 hotels in Brazil and Vila Gale announcing a R$1 billion expansion plan, supporting opportunities for local developers, third-party operators, and supply partners in conversions, multi-use projects, and serviced-apartment formats.
Recent Industry Developments
- July 2026: Marriott International announced plans to add 110 hotels to its Brazil portfolio by 2030, including projects tied to the Maraey complex in Marica such as a Ritz-Carlton Reserve and JW Marriott. The move broadens branded supply across luxury and upper-upscale while reinforcing the pipeline momentum driven by destination projects and large-scale developments.
- July 2025: Hampton by Hilton confirmed a 100-room seaside property in Praia Grande as part of the Litoral Plaza complex, launching alongside a private cruise terminal investment of BRL 1 billion (USD 200 million). Linking new room supply to cruise infrastructure supports leisure demand capture in coastal micro-markets outside the primary gateways.
- September 2024: Brazil enacted Lei No. 14.978, modernizing the General Tourism Law (Lei 11.771/2008) and updating definitions for tourism service providers. The legislative update tightened the framework that underpins registration and oversight of lodging operators, influencing how hotels align documentation and service classification with federal tourism policy.
Research Methodology Framework and Report Scope
Market Definition and Coverage
For this methodology, the Brazil hospitality market is defined as revenue generated from accommodation stays and related guest services delivered in Brazil, covering spending tied to lodging formats and booking pathways that support travel and local stays.
Scope exclusions: This sizing excludes passenger travel tickets and pure real estate value of properties, and it also excludes restaurant and cafe spending that is not attached to the lodging and guest-service boundary used in the model.
Segmentation Overview
- By Type
- Chain Hotels
- Independent Hotels
- By Accommodation Class
- Luxury
- Mid & Upper-Mid-scale
- Budget & Economy
- Service Apartments
- By Booking Channel
- Direct Digital
- OTAs
- Corporate / MICE
- Wholesale & Traditional Agents
- By Geographic Region
- North Region
- Northeast Region
- Central-West Region
- Southeast Region
- South Region
Data Sources, Market Sizing, and Validation
Desk Research
Desk research was used to build the factual base that our model sits on, and then to cross-check direction and plausibility. We referenced public tourism and macro series from sources such as Brazil's Ministry of Tourism, the Brazilian Institute of Geography and Statistics (IBGE), the Central Bank of Brazil (for currency and inflation indicators), and UN Tourism for travel flows and travel demand context. Where needed, we also reviewed materials from industry and hotel associations, plus company filings, investor presentations, and reputable press, to understand pricing behavior, capacity additions, and booking shifts.
To reduce gaps around company-level benchmarking and time-series continuity, we also used paid subscriptions for company financials and intelligence, along with news and financials tracking, and selective patent databases where service technology signals were relevant. The desk inputs were not treated as final answers, and they mainly served to set guardrails for assumptions that were then validated by experts. The sources listed here are illustrative only, and we also used other public and paid references for collection, validation, and clarification.
Primary Interviews and Surveys
Primary work focused on validating what drives revenue in Brazil hospitality and how it is changing by booking route and property positioning. We spoke with operators, distribution-side participants, and supporting service providers across major tourism corridors and business hubs, which helped us confirm occupancy patterns, average daily rate movement, and the typical share of direct versus intermediary bookings. These inputs were then used to test assumptions from desk research and to resolve gaps where public reporting was not consistent across states and property types.
Distribution of primary research fieldwork respondents
| Company type | Respondent position |
|---|---|
| Top tier: 27% | CXOs: 19% |
| Mid tier: 54% | Functional/Unit leaders: 37% |
| Smaller Players: 19% | Managers: 44% |
Market-Sizing & Forecasting
Sizing starts with a top-down build that reconstructs the demand pool from travel and lodging activity, and then converts that activity into revenue using observed price and mix behavior. Key inputs include accommodation supply additions (rooms and property count signals), occupancy and seasonality patterns, ADR progression by class, booking-channel mix shifts (direct digital versus intermediated), and domestic versus international trip mix. When these are combined, the core revenue curve is traceable to real activity indicators rather than only to narrative growth rates.
Results are then corroborated with selective bottom-up approximations, such as sampled property revenue checks, operator roll-ups where disclosures exist, and volume times ASP sanity checks at the channel level. When bottom-up signals are missing for smaller markets or independent properties, the gap is handled through calibrated penetration assumptions tied to region-level tourism intensity and verified by interviews. For forecasting, we use scenario analysis anchored in expected travel demand, pricing normalization, and supply pipeline timing, with assumptions reviewed against expert consensus so the final outlook stays realistic under different macro conditions.
Data Validation & Update Cycle
Validation is done through multiple checks so that the final totals do not drift away from observable market signals. We compare model outputs against independent indicators like tourism arrivals trends, lodging performance benchmarks, and macro variables that influence discretionary spend, and then investigate any large variances before sign-off. When a mismatch appears, follow-up questions are raised with relevant interviewees, and assumptions are adjusted only when the change is consistently supported.
Each report is refreshed annually, and interim updates are triggered when material events occur, such as sharp currency moves, policy shifts that affect travel, or step-changes in room supply additions. Before delivery, an analyst performs a fresh pass on the key inputs and forecast drivers so clients receive an updated view that reflects the latest available evidence.
Mordor Intelligence's Brazil Hospitality Market Size Versus Other Published Estimates
Different published market values for Brazil hospitality can look far apart because studies do not always measure the same revenue boundary, and they also pick different base years and conversion choices. The spread typically comes from what is counted as hospitality revenue, the timing of currency conversion, and how pricing is carried forward when inflation and demand mix are changing.
In practice, the biggest gaps show up when dining and broader HoReCa spending are blended into lodging revenue, or when large parts of the sector are estimated using aggressive price expansion without a clear ADR and occupancy check. A refresh-led process also matters because the USD view can shift when FX averages are updated, and that is why the annual update pass, currency timing discipline, and ADR-based ASP logic applied by Mordor Intelligence can land on a smaller but more traceable total versus wider-scope estimates.
Benchmark comparison
| Source | Market Size | Gaps in Research Methodology |
|---|---|---|
| Mordor Intelligence | USD 8.44 B (2025) | |
| Global Consultancy A | USD 17.60 B (2024) | Uses a broader definition of hospitality and a different base year, which can pull in adjacent guest services and apply a different pricing curve, thereby lifting the USD total versus a lodging-anchored revenue boundary. |
| Industry Publisher B | USD 125.00 B (2024) | Represents HoReCa, which includes restaurants and catering alongside hotels, so the scope is materially wider than a lodging and guest-service market size even before considering FX timing and inflation assumptions. |
Taken together, the table shows that scope choices explain most of the variance, and year and currency timing explain a meaningful remainder. By keeping the demand pool tied to lodging activity and then testing pricing with occupancy and ADR signals, our estimate stays easier to reproduce, audit, and update when market conditions change.
Key Questions Answered in the Report
What revenue figure is Brazil’s hospitality forecast to reach by 2031?
Sector value is set to climb to USD 11.59 billion by 2031, reflecting a 5.44% CAGR.
Which accommodation class is expanding the quickest across the country?
Service Apartments are leading growth with an 11.05% CAGR projected through 2031.
How is PIX instant payment reshaping hotel booking behavior in Brazil?
PIX drives spontaneous domestic trips by removing card-fee friction, boosting weekend occupancy and helping hotels record revenue gains of roughly 16% after adoption.
What hotel demand spike is expected from COP-30 in Belém?
Delegates and visitors linked to the 2028 summit will nearly triple local room supply needs, pushing projected ADR toward USD 500.
Which Brazil region currently generates the greatest share of hotel revenue in 2025?
The Southeast region, anchored by São Paulo and Rio de Janeiro, commanded 54.75% of national revenue in 2025.