
Horticulture Lighting Market Size and Share
Market Overview
| Study Period | 2020 - 2031 |
|---|---|
| Market Size (2026) | USD 11.02 Billion |
| Market Size (2031) | USD 19.62 Billion |
| Growth Rate (2026 - 2031) | 12.23 % |
| Fastest Growing Market | Asia Pacific |
| Largest Market | Europe |
| Market Concentration | Medium |
Major Players *Disclaimer: Major Players sorted in no particular order Image © Mordor Intelligence. Reuse requires attribution under CC BY 4.0. | |
Horticulture Lighting Market Analysis by Mordor Intelligence
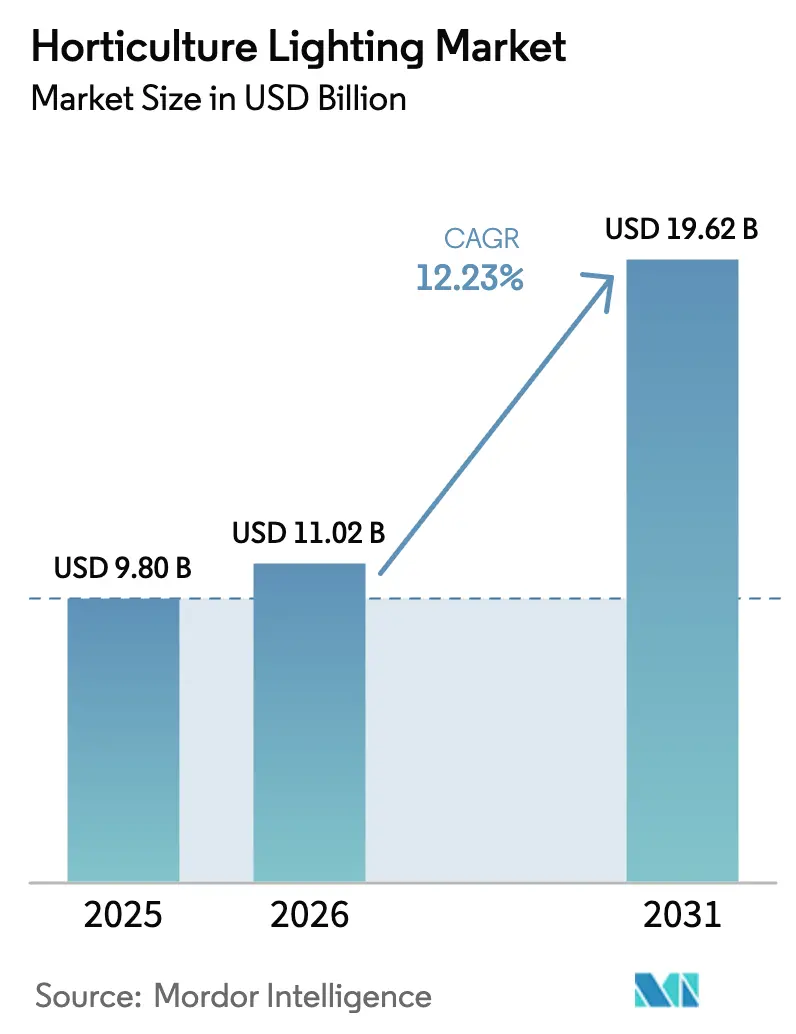
The horticultural lighting market size is projected to expand from USD 9.80 billion in 2025 and USD 11.02 billion in 2026 to USD 19.62 billion by 2031, registering a 12.23% CAGR between 2026 and 2031. Precision-tuned LED spectra are lifting cannabinoid yields in legalized North American cannabis cultivation, while urban food-security mandates in Asian megacities and the European Union’s Fit-for-55 energy program are triggering rapid retrofits of legacy high-intensity discharge fixtures. Fixture prices have fallen 15-20% since 2024 as Samsung and LG scale semiconductor production, yet plasma and other alternative light sources are re-emerging in research environments that need continuous spectra. Hardware commoditization is steering vendors toward cloud-based spectral analytics, and corporate ESG-linked green bonds are unlocking capital for large retrofit programs.
Key Report Takeaways
- By lighting technology, LED systems held 86.13% of horticultural lighting market share in 2025, while plasma and other alternatives are advancing at a 12.41% CAGR through 2031.
- By offering, hardware captured 71.52% of revenue in 2025; software and services are forecast to grow at a 12.53% CAGR through 2031.
- By installation type, new builds controlled 58.36% of revenue in 2025, whereas retrofits are projected to expand at a 13.46% CAGR.
- By cultivation, tomatoes and peppers led with 23.74% of horticultural lighting market size in 2025, and berries are poised for a 15.22% CAGR through 2031.
- By application, greenhouses commanded 49.21% revenue in 2025; vertical farms are expected to post the highest 15.21% CAGR to 2031.
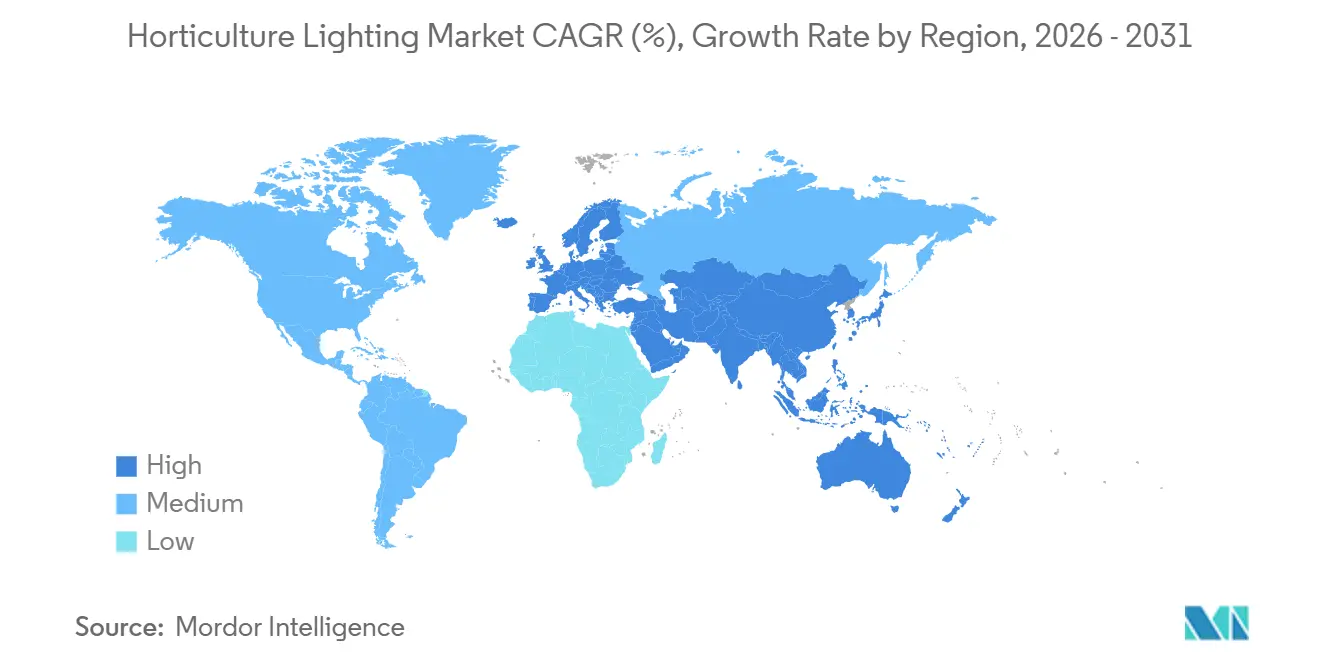
- By geography, Europe dominated with 32.94% share in 2025, and Asia-Pacific is forecast for a 13.42% CAGR through 2031.
Note: Market size and forecast figures in this report are generated using Mordor Intelligence’s proprietary estimation framework, updated with the latest available data and insights as of January 2026.
Market Trends and Insights
Drivers Impact Analysis of Horticulture Lighting Market*
| Driver | (~) % Impact on CAGR Forecast | Geographic Relevance | Impact Timeline |
|---|---|---|---|
| Precision-tuned LED spectra raising cannabinoid yield in North American cannabis grows | +2.1% | North America, with spillover to Europe and Australia | Medium term (2-4 years) |
| Urban food-security programs accelerating vertical-farm lighting demand across Asian megacities | +2.3% | Asia-Pacific core (Singapore, Tokyo, Seoul, Shanghai), spillover to Middle East | Long term (≥4 years) |
| EU "Fit-for-55" energy directives incentivising LED retrofits in heated glass greenhouses | +1.8% | Europe (Netherlands, Germany, Spain, France) | Short term (≤2 years) |
| Surge in off-grid micro-powered CEA solutions for desert farming in GCC countries | +1.2% | Middle East (Saudi Arabia, UAE, Qatar) | Medium term (2-4 years) |
| Corporate ESG-linked green bonds funding large-scale horticultural greenhouse LED roll-outs | +1.5% | Global, with concentration in North America and Europe | Medium term (2-4 years) |
| Cloud-based spectral analytics optimising photosynthetic photon efficacy in controlled-environment facilities | +1.4% | Global, early adoption in North America and Europe | Long term (≥4 years) |
| Source: Mordor Intelligence | |||
Precision-Tuned LED Spectra Raising Cannabinoid Yield In North American Cannabis Grows
Cannabis growers are shifting from broad-spectrum metal-halide lamps to LED fixtures emitting 680-730 nm far-red wavelengths, boosting THC and CBD concentrations by 12-18 percent and cutting waste heat by 40-50 percent. The segment, valued at USD 1.5 billion in 2025, is growing at 15% annually as additional U.S. states legalize medical and adult-use sales. Fixture vendors Fluence and California LightWorks dominate large facilities, while modular systems from Black Dog LED are winning budget-sensitive craft operators. Federal rescheduling could accelerate multi-state expansion beyond 2028.
Urban Food-Security Programs Accelerating Vertical-Farm Lighting Demand Across Asian Megacities
Under its "30 by 30" plan, Singapore allocated SGD 200 million (USD 148 million) in 2024 to enhance its food security and reduce reliance on imports. Meanwhile, in 2025, Tokyo set aside JPY 5 billion (USD 33 million) to subsidize urban agriculture initiatives, aiming to promote sustainable farming practices within the city. Seoul's Smart Farm Innovation Center rolled out 12 hectares of fully enclosed farms, utilizing Samsung's LM301H LEDs, which boast an impressive efficacy of 3.1 µmol J⁻¹.[1] These advanced farming systems, equipped with lighting fixtures priced between USD 150-250 m², achieve 10-15 harvests annually. This high productivity ensures a lighting payback period of under four years, making the investment in such technology economically viable and efficient.
EU Fit-for-55 Energy Directives Incentivising LED Retrofits In Heated Glass Greenhouses
Under the Fit-for-55 package, growers are required to reduce greenhouse gas emissions by 55% by 2030. This initiative is driving the replacement of traditional 1,000 W HPS lamps with more energy-efficient 400-600 W LED arrays. In 2025, Germany allocated grants totaling EUR 120 million (approximately USD 130 million) to support this transition. Dutch pilot programs demonstrated significant success, achieving a 40-50% reduction in lighting energy consumption while maintaining a light intensity of over 200 µmol m⁻² s⁻¹ PPFD, which is essential for cultivating crops like tomatoes and peppers.[2] However, the process of obtaining CE-mark certification under IEC 62471 standards imposes additional costs, ranging from EUR 8,000 to 15,000 per model. These expenses create challenges for smaller vendors, slowing down their ability to launch new products in the market.
Surge In Off-Grid Micro-Powered CEA Solutions For Desert Farming In GCC Countries
In 2024-2025, Saudi Arabia's Vision 2030 allocated SAR 1.2 billion (USD 320 million) to controlled-environment projects, aiming to enhance agricultural sustainability and food security in the region. Solar-powered LED farms in the UAE and Qatar have successfully achieved water-use efficiency targets under 5 L kg⁻¹, representing a significant ten-fold improvement compared to traditional field crops. However, challenges persist, as dust accumulation has been reported to reduce photovoltaic output by 15-25 percent monthly. These advancements highlight the region's commitment to leveraging innovative technologies while addressing environmental constraints.
Restraints Impact Analysis of Horticulture Lighting Market*
| Restraint | (~) % Impact on CAGR Forecast | Geographic Relevance | Impact Timeline |
|---|---|---|---|
| Acute aluminium and rare-earth cost inflation squeezing high-power LED fixture margins | -1.9% | Global, with acute impact in Asia-Pacific manufacturing hubs | Short term (≤2 years) |
| Fragmented regional import tariffs complicating fixture price parity for Asia-Pacific growers | -1.3% | Asia-Pacific (India, ASEAN, Australia), spillover to Africa | Medium term (2-4 years) |
| Photobiological safety compliance costs delaying spectrum-tuning product launches in EU | -0.8% | Europe, with secondary effects in North America | Short term (≤2 years) |
| Limited DALI/KNX interoperability curbing smart-lighting adoption in legacy greenhouses | -0.7% | Global, concentrated in Europe and North America, legacy facilities | Long term (≥4 years) |
| Source: Mordor Intelligence | |||
Acute Aluminium And Rare-Earth Cost Inflation Squeezing High-Power LED Fixture Margins
In 2025, average aluminium prices climbed to USD 2,580 per tonne, marking a significant increase that led to a rise of USD 6-10 in fixture bills of materials per unit. This surge in costs resulted in a notable compression of manufacturers' gross margins, reducing them by as much as 12 percentage points.[3] Furthermore, the implementation of stringent export quotas by China significantly impacted the market for rare earth elements. These restrictions drove prices of europium and terbium oxides up by 30 percent, thereby exerting additional pressure on suppliers of LED phosphors and further complicating their operational dynamics.
Fragmented Regional Import Tariffs Complicating Fixture Price Parity For Asia-Pacific Growers
India's 25% import duty, Australia's anti-dumping levies, which range from 15% to 58%, and Pakistan's 20% regulatory duty collectively drive landed costs to increase by 35-40% above ex-factory prices. These elevated costs significantly impact the pricing structure and profitability of multinational companies operating in these regions. To navigate these challenges, multinationals are compelled to maintain country-specific inventories tailored to meet the unique regulatory requirements and market conditions of each country. This approach, while necessary, results in an approximate 8-12% inflation in their working capital. The increased working capital requirements not only add financial strain but also introduce additional complexities in managing supply chain operations effectively.
*Our forecasts treat driver/restraint impacts as directional, not additive. The impact forecasts reflect baseline growth, mix effects, and variable interactions.
Horticulture Lighting Market Segment Analysis
By Lighting Technology:
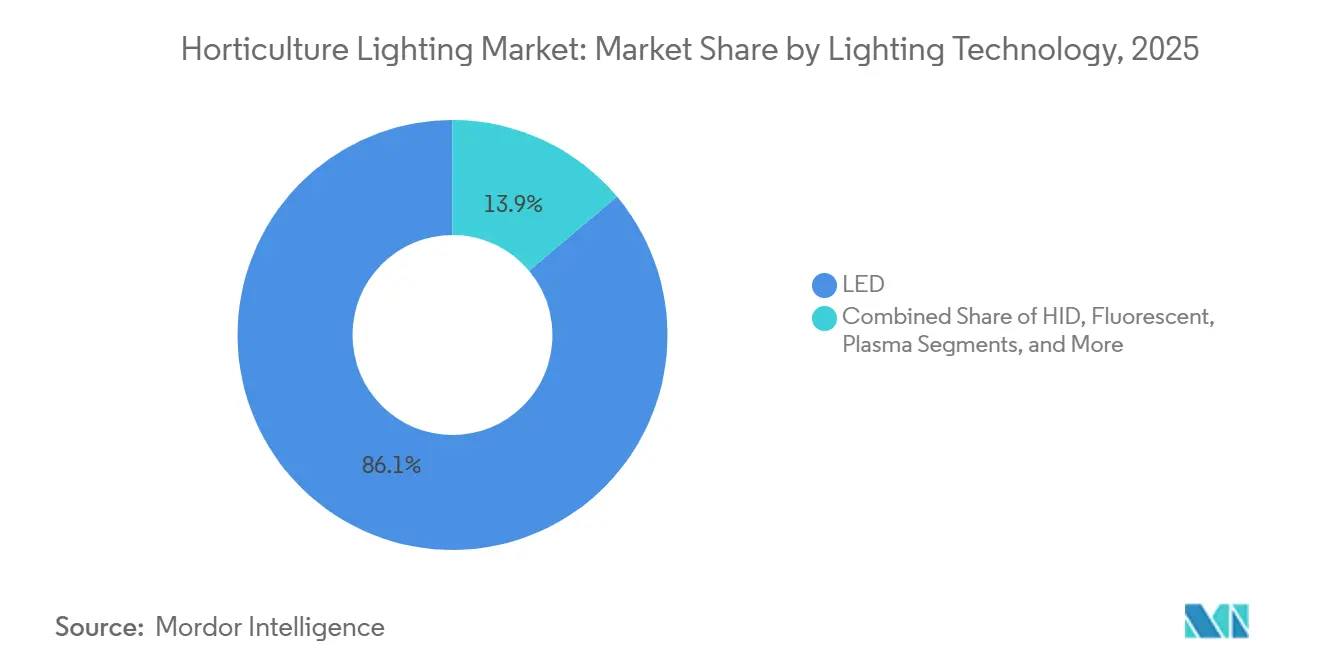
LED Dominance With A Resurgent Plasma NicheLED systems held 86.13% of horticultural lighting market share in 2025, reflecting sustained 40-50 percent energy savings versus HID lamps. The horticultural lighting market size for plasma and other alternatives is projected to advance at a 12.41% CAGR as research facilities value their continuous 380-780 nm spectra. LED fixture costs have declined to USD 80-150 m⁻², and gallium-nitride-on-silicon roadmaps suggest further price drops by 2028.
LED innovation is shifting toward 10-channel tunable arrays, typified by Heliospectra’s MITRA X platform released in 2024, which recreates sunrise-to-sunset transitions with 1 percent spectral granularity. Plasma systems priced at USD 800-1 200 per unit are penetrating high-margin cannabis and cut-flower operations despite higher capex. HID lamps, still clinging to 8-10 percent share in older greenhouses, are falling out of favor as bulb supply tightens under EU Ecodesign rules.

By Offering:
Hardware Commoditization Fuels Software Value CaptureHardware contributed 71.52% of 2025 revenue, yet falling LED package prices are shrinking average selling prices by 6-8 percent yearly. Software and services are expanding at 12.53% CAGR as platforms such as LumiGrow smartPAR Cloud charge USD 2-5 m⁻² yr⁻¹ for photon efficacy optimization. These SaaS fees already represent 12-18 percent of total project value in new vertical farms.
Driver electronics now embed Bluetooth LE and Zigbee radios, eliminating hard-wired DALI infrastructure and reducing installation labor USD 8-12 per linear meter. Energy-savings-as-a-service models pioneered by Deere Infinite Vertical keep fixtures off growers’ balance sheets, although legal complexities around measurement and verification confine adoption to operators above USD 10 million annual revenue.
By Installation Type:
Retrofit Momentum Builds On Payback CertaintyNew facilities accounted for 58.36% of 2025 spending, largely purpose-built vertical farms that integrate lighting, HVAC, fertigation, and robotics from day one. Retrofits, however, will outrun at a 13.46% CAGR as growers secure 18-36 month paybacks by swapping 1 000 W HPS for 600 W LED arrays. Netherlands’ Wageningen University trials demonstrated 42 percent power savings and an 8 percent tomato yield uplift.
Older glasshouses face higher capex because 480 V distribution upgrades can add USD 15-25 m⁻², stretching paybacks beyond four years. Germany’s 40 percent capital grants shorten this window, whereas Spanish plastic-house operators still defer upgrades amid milder climates. Leasing at 8-12 percent interest over seven years inflates lifecycle costs 25-35 percent versus construction loans available to green-field projects.
By Cultivation:
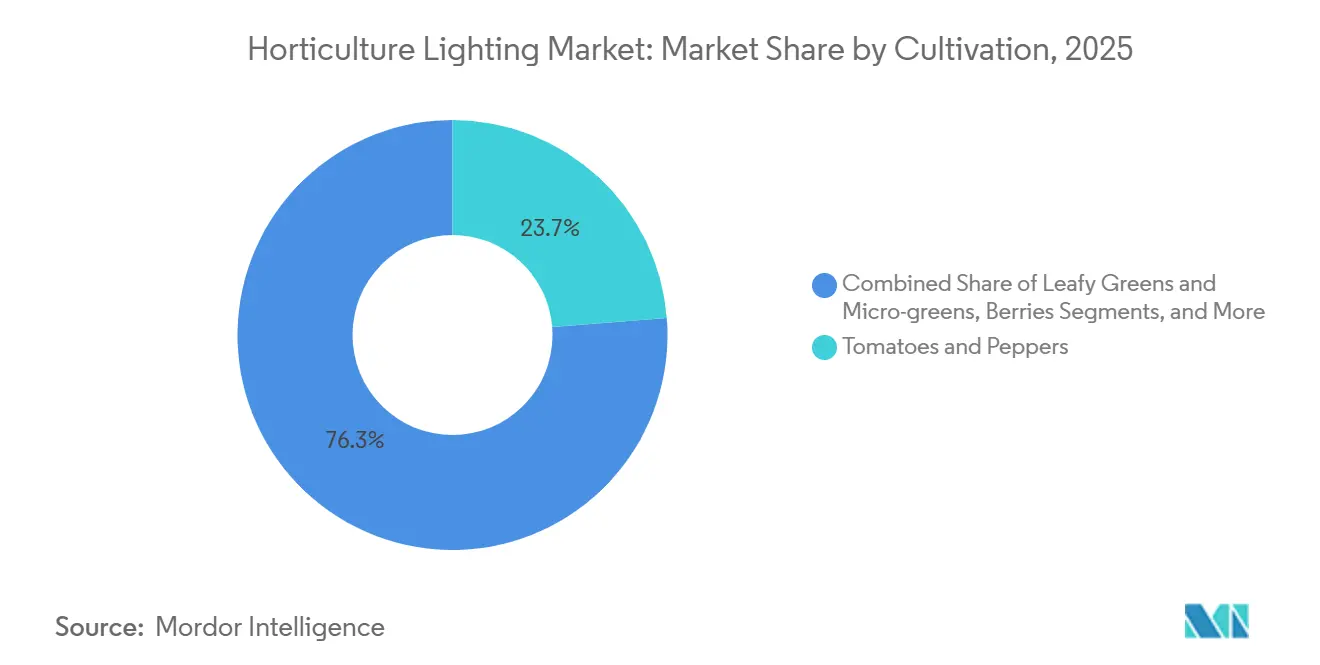
Berries Overtake Growth Rates Of Traditional Glasshouse StaplesTomatoes and peppers led revenue with 23.74 percent share in 2025, yet berries will grow fastest at 15.22% CAGR as far-red LEDs extend strawberry and blueberry seasons and lift anthocyanin content 15-22 percent. Premium berry programs at Driscoll’s and Naturipe Farms retrofitted 180 ha of interlighting during 2024-2025, raising yields 18-25 percent and enhancing shelf life by 12 days.
Leafy greens fill vertical farms near high-price urban markets, accounting for 18-20 percent of spend, whereas cannabis and specialty botanicals hold 15-18 percent share. Cut flowers command 12-14 percent thanks to strict stem-length grading in Dutch auctions. Remaining crops — from cucumbers to propagation seedlings — absorb hybrid HPS-LED deployments where radiant heat is still desirable.
By Application:
Vertical Farms Gain Traction Despite Capital IntensityGreenhouses still represent 49.21 percent of horticultural lighting market size, but indoor and vertical farms will post a 15.21% CAGR through 2031 as cities chase local food security. Vertical facilities can achieve 10-15 crop cycles annually at 400-600 µmol m⁻² s⁻¹ PPFD, but capex runs USD 1 200-2 000 m⁻², with lighting making up 35-40 percent.
Research institutes, aquaponics, and container farms share 14-18 percent of spending. More than 320 container units were installed worldwide in 2025, predominantly in Middle Eastern sites where water scarcity and high heat favor modular deployment. Power costs above USD 0.12 kWh⁻¹ remain the tipping point for economic viability.
Geography Analysis
Europe Horticulture Lighting Market
Europe dominated with 32.94 percent share in 2025 as Fit-for-55 subsidies cover 40 percent of LED retrofit capex in countries such as Germany and France. Netherlands’ 10 000 ha of heated glasshouses consumed 4.5 TWh in 2024, making energy savings of 40-50 percent through LEDs financially compelling. Spain’s Almería plastics sector is less aggressive because natural light suffices most of the year, but pilot LED-climate algorithms delivered 18-month paybacks.
APAC Horticulture Lighting Market
Asia-Pacific will be the fastest-growing region at 13.42% CAGR. China’s 1.2 million ha of protected horticulture is scaling LEDs to offset land limits, while Singapore pumped SGD 200 million (USD 148 million) into vertical farms since 2024. Japanese urban farms receive JPY 5 billion (USD 33 million) in annual subsidies, and India’s 25 percent tariff raises costs versus ASEAN neighbors with 0-5 percent duties. Australia’s anti-dumping tariffs on Chinese drivers divert orders to Korean suppliers at 12-18 percent mark-ups.
North America and Middle East Horticulture Lighting Market
North America accounted for roughly 30 percent share in 2025. United States cannabis lighting reached USD 1.5 billion that year, and Canada’s 2 800 ha of glasshouses are rapidly retrofitting LEDs under volatile natural-gas prices. Mexico’s 1 800 ha of tomato greenhouses fitted interlighting in 2024-2025, gaining 18-25 percent yield bumps. Saudi Arabia, UAE, and Qatar together invested USD 320 million in solar-powered LED farms to cut 85-90 percent import dependence.
Regulatory Landscape
Regulatory Landscape: The horticulture lighting market continues to converge on safety and performance standards for luminaires used in controlled environments. In May 2026, IEC 63545:2026 was published, establishing an international safety benchmark for horticultural luminaires operating up to 1,000 V, and it complements CE marking pathways used in Europe. The standard sets design and performance expectations that suppliers and installers can reference across deployments.
On efficiency and performance, DLC Horticultural Technical Requirements V4.0 became effective on April 18, 2025, with compliance required starting July 1, 2026, which shapes product eligibility for rebates and procurement. China formalized GB/T 44473-2024 for LED horticultural lighting (issued November 28, 2024, implemented June 1, 2025), while California Title 24 stakeholders are drafting 2028 code-cycle updates that move mandatory PPE language toward 2.5 umol/J for larger controlled-environment horticulture installations (over 40 kW), aligning policy with DLC V4.0 thresholds.
Competitive Landscape
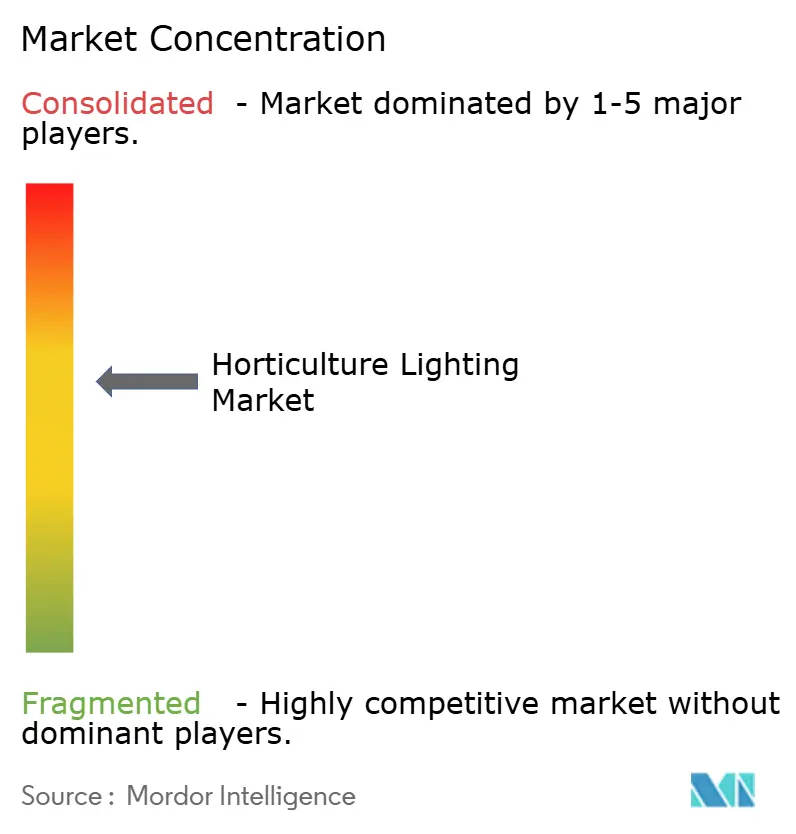
The horticultural lighting market registers moderate fragmentation: the top five players, Signify, ams OSRAM, Fluence, Samsung, and LG Innotek, held about 45-50 percent combined revenue in 2025. Samsung and LG use semiconductor scale to underprice fixtures by 15-20 percent, a move that forced Heliospectra to raise SEK 25.6 million (USD 2.8 million) in fresh equity to sustain R&D in spectral tuning.
Signify absorbed Fluence in 2022 to consolidate cannabis and vertical-farm channels. Ams OSRAM, by contrast, divested non-core fixtures to focus on upstream LED dies. Patent filings surged: Signify lodged 18 horticulture patents in 2024-2025, and Samsung targeted gallium-nitride-on-silicon processes that omit rare-earth phosphors. Plug-and-play wireless systems for old glasshouses and IP65 dust-proof enclosures for desert use are emerging white-space arenas.
Nationstar Optoelectronics and Everlight are flooding markets with sub-USD 80 m⁻² LED kits, compressing gross margins across Europe and South America. Deere Infinite Vertical is piloting savings-as-a-service contracts, retaining fixture ownership and billing growers per kilowatt-hour saved. Standards groups such as LightingEurope and the DesignLights Consortium are steering interoperability rules that will further lower entry barriers for price-aggressive challengers.
Horticulture Lighting Industry Leaders
-
Signify Holding
-
ams OSRAM AG
-
Fluence Bioengineering (Scotts Miracle-Gro)
-
Heliospectra AB
-
Hortilux Schréder
- *Disclaimer: Major Players sorted in no particular order
Horticulture Lighting Market Companies Covered in this Report
- Signify Holding
- ams OSRAM AG
- Fluence Bioengineering (Scotts Miracle-Gro)
- Heliospectra AB
- Hortilux Schréder
- Gavita International BV
- Valoya Oy
- LumiGrow Inc.
- Samsung Electronics Co. Ltd.
- LG Innotek
- Cree LED (SMART Global)
- Current Lighting Solutions
- Everlight Electronics
- Hort Americas LLC
- B-Light Group
- California LightWorks
- Agrolux Nederland BV
- Illumitex Inc.
- Deere and Co. (Infinite Vertical)
- Nanolux Technology
Market Opportunities and Future Outlook
Market Opportunities and Future Outlook: Efficacy-driven qualification rules and code pathways create a clearer upgrade cycle for growers, and they define where suppliers can differentiate through higher PPE alongside controllability. DLC Horticultural V4.0 raises the minimum PPE threshold to 2.5 micromoles per joule, and the July 1, 2026 compliance requirement concentrates demand on luminaires that can pass third-party listing and maintain performance in humid, high-dust environments. Alongside this, the California Energy Commission 2025 Energy Code already enforces mandatory PPE requirements for controlled environment horticulture spaces above 40 kW, and Title 24 stakeholder drafts for the 2028 cycle indicate tighter language toward 2.5 umol/J, which pushes manufacturers to refresh portfolios toward compliance-ready SKUs.
A second opportunity band is the shift from fixture-only retrofits to software-led, forecast-driven lighting and energy management that ties crop strategy to energy pricing and environmental control. This direction is reinforced by vendor actions combining tunable, multi-channel LEDs with control stacks, including Signify extending Philips GrowWise control to enable remote spectral steering and energy trading features (announced in 2025). Capacity additions in Europe and North America also point to expanding execution for dynamic lighting programs, including MechaTronix commencing operation of expanded production capacity in Treviso, Italy (January 2026), and Roelands Plant Farms selecting Sollum Technologies dynamic LED technology for a 12-acre expansion at Lambton Shores in Ontario (February 2026).
Recent Industry Developments in Horticulture Lighting Market
- June 2026: Signify expanded its Philips GreenPower LED toplighting force portfolio, adding toplighting force performance and toplighting force elite solutions. The announcement broadened the choice set for greenhouse operators balancing upfront cost and operating efficiency. It also supports Signify's positioning in large retrofit and new-build projects where efficacy and controllability are procurement priorities.
- February 2026: ams OSRAM settled pending patent disputes with Shenzhen Meizhi Optoelectronics Technology Co., Ltd. involving LED components used in horticultural lighting. The settlement reinforced supply-chain scrutiny around authorized LED components. It can influence luminaire makers' sourcing strategies, certification timelines, and risk management in horticulture-focused product lines.
- January 2026: MechaTronix commenced operation of expanded production capacity in Treviso, Italy, targeting 1,000 grow lights per day. The expansion strengthens European supply capacity for dynamic lighting projects. It also supports accelerated deployment of high-performance horticulture lighting in continental markets.
Horticulture Lighting Market Report Scope and Research Methodology
Market Definition and Coverage
This market covers revenue from horticulture lighting systems used to support plant growth in controlled or semi-controlled environments, where artificial light supplements or replaces natural daylight in greenhouses and indoor cultivation.
Scope exclusions: We exclude general architectural lighting for homes and offices, and we also exclude lamps sold only for decorative use without a horticulture intent.
Segments Covered in This Report
- By Lighting Technology
- LED
- HID
- Fluorescent
- Plasma and Others
- By Offering
- Hardware (Fixtures, Drivers, Controls)
- Software and Services
- By Installation Type
- New Installations
- Retrofit Installations
- By Cultivation
- Vegetables and Fruits
- Leafy Greens and Micro-Greens
- Berries
- Tomatoes and Peppers
- Flowers and Ornamentals
- Cannabis and Specialty Crops
- Other Crops
- By Application
- Greenhouses
- Indoor and Vertical Farms
- Research/Academic Facilities
- Aquaponics and Container Farms
- By Geography
- North America
- United States
- Canada
- Mexico
- South America
- Brazil
- Argentina
- Rest of South America
- Europe
- Germany
- United Kingdom
- France
- Italy
- Spain
- Rest of Europe
- Asia Pacific
- China
- Japan
- South Korea
- India
- Australia
- New Zealand
- Rest of Asia-Pacific
- Middle East and Africa
- Middle East
- United Arab Emirates
- Saudi Arabia
- Turkey
- Rest of Middle East
- Africa
- South Africa
- Nigeria
- Kenya
- Rest of Africa
- Middle East
- North America
Data Sources, Market Sizing, and Validation
Desk Research
Desk work starts with building a clean fact base on controlled environment agriculture and lighting adoption. We typically review public sources such as USDA reports, Eurostat datasets, FAOSTAT, the International Energy Agency energy efficiency publications, and customs trade statistics for lighting equipment, which helps us map demand pockets and pricing direction.
Along with those, we use company filings, investor presentations, product specification sheets, and association websites connected to greenhouse growers and indoor farming. Patent databases and a news and financials subscription are used to track new fixture designs, spectrum control features, and announced capacity expansions or facility builds that can move volumes. This list is not exhaustive, and other public sources were also referenced for data collection, cross-checking, and clarification.
Primary Interviews and Surveys
Fieldwork is used to sanity-check pricing, mix shifts, and real shipment momentum across LEDs and legacy technologies, including what is being retrofitted versus installed in new builds. We speak with a mix of lighting manufacturers, component suppliers, distributors, greenhouse operators, and indoor farm teams across APAC, EMEA, and the Americas, so assumptions can be stress-tested from both the supply side and the user side.
Distribution of primary research fieldwork respondents
| Company type | Respondent position | Region |
|---|---|---|
| Top tier: 32% | CXOs: 12% | APAC: 41% |
| Mid tier: 50% | Functional/Unit leaders: 37% | EMEA: 35% |
| Smaller Players: 18% | Managers: 51% | Americas: 24% |
Market-Sizing & Forecasting
Sizing starts from a top-down build where controlled-environment cultivation area and crop expansion signals are translated into lighting demand, then adjusted using replacement cycles and retrofit intensity. To keep the totals realistic, we corroborate them with selective bottom-up approximations, such as sampled fixture shipments through key channels and an ASP times volume check by technology.
Inputs that matter in horticulture lighting include the LED penetration rate versus HID, average wattage and fixture density by facility type, retrofit payback expectations tied to electricity prices, and the pace of new greenhouse and indoor farm openings. We also track observed LED price erosion and the mix shift toward smart controls and service attachments, because that changes revenue even when unit volumes look stable. For forecasting, scenario analysis is used around power cost sensitivity and controlled-environment agriculture buildout timing, and then a light multivariate regression is applied to link demand with indicators like CEA area growth and energy prices. Where bottom-up signals are thin in smaller countries, gaps are handled with regional proxies and then validated through expert checks on channel coverage.
Data Validation & Update Cycle
Model outputs are checked against independent signals, such as greenhouse area additions, controlled-environment crop capacity announcements, and observed pricing moves in major fixture categories. Variances are reviewed across more than one analyst pass, and outliers trigger a re-check of the underlying drivers, followed by targeted re-contacts when the story does not align with what the data is implying.
Reports are refreshed annually, and interim updates are made when a material event changes demand or pricing assumptions. Before delivery, we run a fresh scan of key releases and trade signals so clients receive the latest updated view.
Mordor Intelligence's Horticulture Lighting Market Estimate Compared With Other Published Estimates
Published market sizes for horticulture lighting can be far apart because the counted scope shifts between hardware-only versus hardware plus software and services, and because some models assume different rates of LED price declines and retrofit timing. Differences also come from the exact year used for currency conversion and the month when new pricing information is refreshed.
When ASPs are updated more frequently, the model captures faster LED price erosion and shifting mix toward controls, which can pull the value up or down even if unit demand is unchanged. The refresh cadence, currency timing, and the way price curves are validated against real quotes are key checks that keep the number tied to what buyers are paying, which is how Mordor Intelligence arrives at its 2026 total.
Benchmark comparison
| Source | Market Size | Gaps in Research Methodology |
|---|---|---|
| Mordor Intelligence | USD 11.02 B (2026) | |
| Industry Publisher A | USD 7.13 B (2024) | Uses an earlier base year and does not clearly show how LED price erosion and mix shift into controls are refreshed, which can understate later-year revenue when retrofit cycles accelerate. |
| Industry Publisher B | USD 6.26 B (2024) | Anchors the model in 2024 and emphasizes hardware revenue, so the timing of currency conversion and the inclusion of software and service attachments can differ from a broader offering-based scope. |
The spread across the three figures is mainly explained by year anchoring and what is counted beyond fixtures, followed by how quickly prices are revised as LED costs keep moving. By keeping scope rules explicit and linking assumptions to observable facility activity and pricing checks, our estimate stays traceable and easier to replicate.
Key Questions Answered in the Report
How large will global horticultural lighting revenue be by 2031?
The sector is forecast to reach USD 19.62 billion by 2031 under a 12.23% CAGR.
Which crop segment is expanding fastest under LEDs?
Berries lead with a 15.22% CAGR as far-red spectra extend harvest windows and enhance anthocyanin content.
What drives retrofits in European glasshouses?
EU Fit-for-55 rules and 40 percent subsidy rates slash payback periods to 18-36 months.
How do vertical-farm power costs impact viability?
Facilities need electricity below USD 0.12 kWh⁻¹ because lighting can account for 35-40 percent of capex.