
Hops Market Size and Share
Hops Market Analysis by Mordor Intelligence
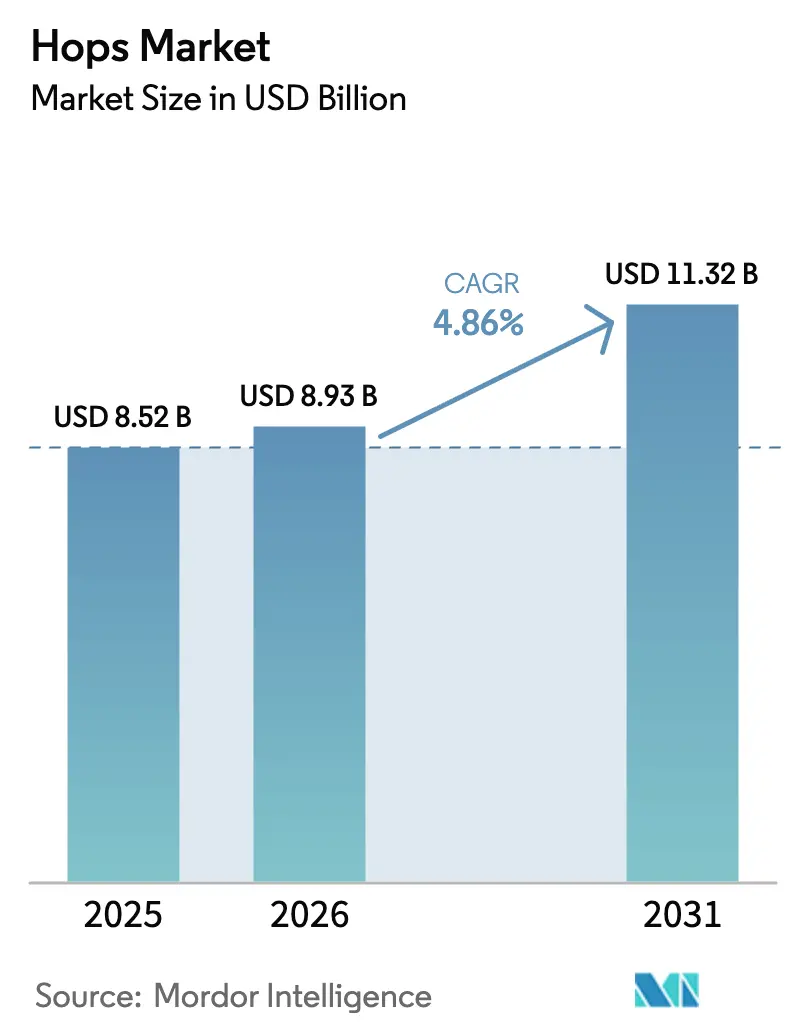
The hops market size was valued at USD 8.52 billion in 2025 and estimated to grow from USD 8.93 billion in 2026 to reach USD 11.32 billion by 2031, at a CAGR of 4.86% during the forecast period (2026-2031). The market is influenced by a tightening balance among acreage, yield, and demand for specialty varieties, shaping grower strategies and contracting practices. Forward contracts account for 65–93% of annual output, ensuring cash flow stability for growers but limiting spot availability for aroma-focused craft brewers. Europe maintains its market significance due to its established processing capacity, while the Asia-Pacific region is witnessing growth in the craft beer segment, driven by rising disposable incomes and increased demand for premium lagers and non-alcoholic beers. In North America, growers are shifting from low-margin bittering cultivars to proprietary aroma varieties, while South American processors are exploring supercritical extraction methods to enhance alpha-acid recovery. Competitive advantage in the market now depends on cultivar intellectual property, precision agriculture, and the ability to diversify revenue streams through nutraceutical and beverage-related opportunities.
Key Report Takeaways
- By geography, Europe led with 42.3% of the hops market share in 2025, while Asia-Pacific is forecast to expand at a 5.1% CAGR through 2031.
Note: Market size and forecast figures in this report are generated using Mordor Intelligence’s proprietary estimation framework, updated with the latest available data and insights as of January 2026.
Global Hops Market Trends and Insights
Drivers Impact Analysis*
| Driver | (~) % Impact on CAGR Forecast | Geographic Relevance | Impact Timeline |
|---|---|---|---|
| Rising popularity of craft beer | +1.0% | Global, concentrated in North America, Europe, and Asia-Pacific urban centers | Medium term (2–4 years) |
| Expansion of micro-breweries | +0.7% | Asia-Pacific cores such as China, Vietnam, India with spill-over to Brazil and Argentina | Medium term (2–4 years) |
| Increasing demand for aroma hops in premium lagers | +0.6% | Europe, North America, and premium segments in Asia-Pacific | Long term (≥4 years) |
| Rising disposable income in emerging economies | +0.5% | China, India, Vietnam, United Arab Emirates, Turkey, and South Africa | Long term (≥4 years) |
| Premiumization trend in non-alcoholic beer | +0.3% | Early leadership in Europe and North America, spreading globally | Short term (≤2 years) |
| Surge in hop-based nutraceutical extracts | +0.2% | North America and Europe, emerging in Asia-Pacific wellness channels | Long term (≥4 years) |
| Source: Mordor Intelligence | |||
Rising Popularity of Craft Beer
Craft beer has transitioned from a niche interest to a mainstream preference, driven by brewers using hopping rates three to five times higher than those in macro lagers, which has significantly increased demand for aroma hop varieties [1]Source: Brewers Association, “Mid-Year 2025 Craft Brewing Update,” brewersassociation.org. In China, the number of craft breweries doubled to 3,100 between 2021 and 2023, boosting sales from USD 662 million to USD 971 million, with a projected target of USD 1.5 billion by 2028[2]Source: United States Department of Agriculture Foreign Agricultural Service, “China Hops Market Brief,” fas.usda.gov. In contrast, mature markets like the United States experienced a slight decline in brewery counts by mid-2025, indicating market saturation and a shift in innovation investments toward cities in the Asia-Pacific region. Aroma hops such as Citra and Nelson Sauvin command a 15–20% price premium, encouraging growers to reallocate acreage from high-alpha commodity hops.
Expansion of Micro-Breweries
Microbrewery licensing has seen significant growth across the Asia-Pacific region, with China adding 1,400 facilities between 2021 and 2023. Brazil's emerging craft beer industry is experiencing a similar expansion, while Chile's more than 300 breweries now account for 1.7% of the country's domestic beer market share. The Canadian craft beer industry remains entirely dependent on imported hops. Contractual imbalances are evident as small producers often lack the bargaining power to secure multiyear supply agreements, leaving them reliant on volatile spot markets where aroma hop varieties command premium prices. Grower-owned cooperatives, such as Yakima Chief Hops, play a crucial role by allocating limited hop varieties to member breweries, thereby strengthening direct-to-brewer supply chains.
Increasing Demand for Aroma Hops in Premium Lagers
Mainstream lagers are increasingly adopting aroma-forward recipes, reflecting the influence of craft beer on consumer preferences. Germany's 2024 hop crop, totaling 46,536 metric tons, accounted for 41% of the global supply. However, drought conditions have led to a reduction in the 2025 forecast, impacting the availability of Hallertau Mittelfrüh and Tettnang varieties. New Zealand growers capitalize on the Southern Hemisphere harvest season to export 85% of their production, with triploid varieties commanding prices of nearly USD 20,700 per metric ton. Poland primarily exports hops in the form of raw cones, while merchants in Germany and the United States predominantly carry out value-added extraction processes.
Surge in Hop-Based Nutraceutical Extracts
Xanthohumol, present in concentrations ranging from 0.11 to 12.7 milligrams per gram, forms the basis for new nutraceutical formulations that aim to provide antioxidant and anti-inflammatory health benefits. Supercritical extraction in Brazil’s Vale do Ribeira achieves a recovery rate of 72% for alpha acids, compared to 15% using solvent-based methods, ensuring pharmaceutical-grade purity. Regulatory hurdles are minimized by the United States Food and Drug Administration's "Generally Recognized as Safe" (GRAS) designation and favorable opinions from the European Food Safety Authority. Suppliers such as Kalsec and John I. Haas are expanding production of standardized extracts for use in dietary supplements, functional foods, and cosmetics. Additionally, China’s growing wellness market presents a high-margin opportunity, provided domestic processors comply with Good Manufacturing Practice (GMP) certification requirements.
Restraints Impact Analysis*
| Restraint | (~) % Impact on CAGR Forecast | Geographic Relevance | Impact Timeline |
|---|---|---|---|
| Limited cultivation regions | -0.6% | Global, acute in Asia-Pacific, South America, Middle East, and Africa | Long term (≥4 years) |
| Climate change impact on yields | -0.9% | Germany, Czech Republic, Pacific Northwest, and Australia | Short term (≤2 years) |
| Volatile farm-gate prices hurting long-term contracts | -0.5% | North America and Europe | Medium term (2–4 years) |
| Increasing labor costs in major hop-growing regions | -0.7% | United States, Canada, Germany, United Kingdom, and Australia | Medium term (2–4 years) |
| Source: Mordor Intelligence | |||
Limited Cultivation Regions
Hop production is viable only between 35 and 55 degrees latitude, making emerging beer markets heavily reliant on imports. The United States, Germany, and the Czech Republic collectively account for over 75% of global hop production, while countries like China, Brazil, and South Africa import more than 99% of their brewing hops in 2024. In Brazil, hop cultivation remains minimal, despite favorable extraction yields, which leads to higher landed costs due to freight and tariffs. In 2024, New Zealand's disease-free hop farms achieved premium prices of approximately USD 20,700 per metric ton. However, they represent only 0.5% of the global cultivation area[3]Source: New Zealand Hops, “Industry Overview 2024,” nzhops.co.nz. Argentina and Kenya have initiated pilot programs, and the absence of pelletization and extraction facilities necessitates shipping raw hops to Europe or North America for processing. Poland exports 65% of its hop cones as raw material, missing out on the added value from downstream processing.
Increasing Labor Costs in Major Hop-Growing Regions
In 2024, agricultural wages in Washington State increased by 3.1%, reaching USD 18.73 per hour, while the federal H-2A visa program established minimum wages of up to USD 19.75 per hour[4]Source: United States Bureau of Labor Statistics, “Agricultural Wages 2024,” bls.gov. In Germany, farm labor costs averaged EUR 13.50 per hour, equivalent to USD 14.85 per hour, contributing to higher expenses for labor-intensive activities. These rising costs have prompted many farmers to explore automation and mechanization as a means to reduce their dependency on manual labor. Mechanical harvesters, priced between USD 500,000 and USD 1 million, impose substantial financial burdens on family farms, often requiring significant investment or financing options. In Canada, limited domestic production is primarily due to short growing seasons and elevated labor costs, which make it challenging for farmers to compete with imports from regions with more favorable growing conditions and lower production expenses.
*Our forecasts treat driver/restraint impacts as directional, not additive. The impact forecasts reflect baseline growth, mix effects, and variable interactions.
Geography Analysis
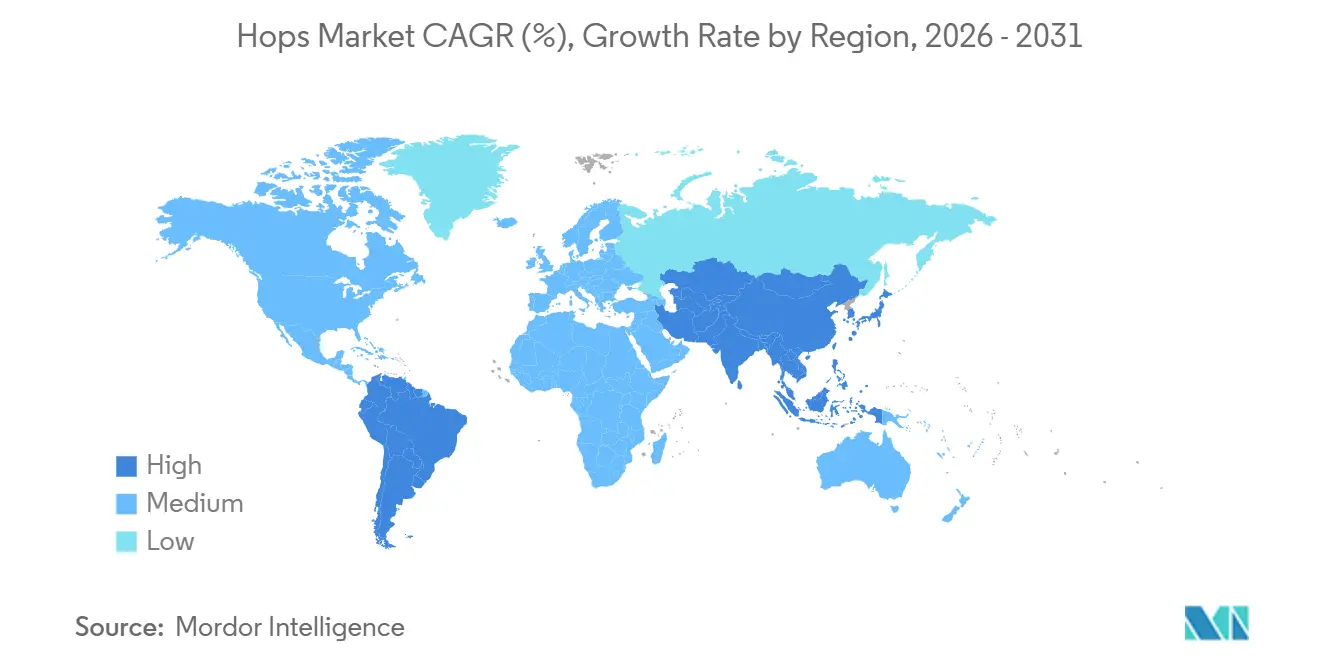
Europe held a commanding 42.3% share of the hops market in 2025, driven by its heritage terroirs, advanced processing capabilities, and robust contracting networks. Germany’s Hallertau region remains a key contributor, although drought and pest pressures have reduced the 2025 forecast, prompting brewers to diversify sourcing to the Czech Republic and Slovenia. In 2022, the United Kingdom imported USD 25.46 million worth of hop extracts, highlighting Europe’s dual role as a producer and redistributor. Poland primarily exports raw hop cones, reflecting processing gaps that allow German and United States merchants to capture higher margins. Belgium’s Trappist brewing tradition sustains steady imports of noble hops, while Russian trade remains volatile due to sanctions impacting Anadolu Efes facilities.
The Asia-Pacific region is the fastest-growing hops market, with a projected CAGR of 5.1% through 2031. Growth is fueled by China’s expanding craft brewing industry and the premium lager upgrades in India and Vietnam. Despite importing over 99% of its hops, rising disposable incomes are driving demand for proprietary aroma cultivars sourced from the United States, Australia, and New Zealand. The region’s hops market is anticipated to narrow the gap as macro brewers reformulate lagers with fruit-forward and dry-hopped profiles. While domestic cultivation remains limited, pilot farms and extraction technology initiatives in Australia and Brazil indicate a gradual move toward regional self-sufficiency.
North America produced 39,496 metric tons of hops in 2024, though acreage has declined as growers shift from low-margin bittering varieties to patented aroma lines. The Pacific Northwest remains a global hub for cultivar innovation, with varieties such as Simcoe, Mosaic, and Citra leading the way in the market. In South America, the hops market is still in its early stages of development. Brazil is testing supercritical extraction methods to achieve self-sufficiency, and Argentina’s Patagonian trials are awaiting scalability. The hops market in the Middle East and Africa is projected to nearly double by 2031, driven by expatriate consumption in the United Arab Emirates and tourism corridors.


Regulatory Landscape
Hops trade and quality are shaped by marketing standards, certification, and import controls that cover cones, pellets, and extracts. In the European Union, Implementing Regulation (EU) 2024/601 and Delegated Regulation (EU) 2024/602 set the current framework for marketing standards and certification of hops and hop products, replacing earlier EU rules and tightening traceability across member-state competent authorities.
Outside the EU, compliance is often driven by import equivalence and phytosanitary requirements rather than mandatory domestic inspection. Great Britain has extended import controls for hops and hop products, including the use of EU certificates or attestations of equivalence for third-country imports, through 1 February 2027. In the United States, official hop inspection is provided under the Agricultural Marketing Act of 1946 (via USDA FGIS services) and is typically permissive unless required by buyer or protocol. Phytosanitary certification for exports is managed by USDA APHIS through PCIT to meet importing-country pest and disease standards.
Value Chain Analysis
The hop value chain begins with specialized input supply (rhizomes/planting material, trellis systems, irrigation, and crop protection), then moves to farm production in latitude-bounded regions. After harvest, kilning and baling feed downstream processing into pellets and extracts, which are then distributed to breweries and non-brewing end users. Processing and merchanting capture much of the value through pelletization, CO2 or other extraction, blending, and quality assurance, while cooperatives and merchant houses coordinate contracting, inventory, and logistics, particularly for aroma varieties with tighter allocation.
Two structural features shape throughput and pricing along the chain: inventory overhang and contracting complexity. USDA reported hop stocks held by growers, dealers, and brewers at 173 million pounds on March 1, 2025, down 6% year over year, which supports buyer leverage in spot and renewal negotiations. In the United States, proprietary varieties take up a large share of acreage (about 63% cited in industry reporting), often with split ownership between landholders and variety-rights holders, slowing acreage rationalization and complicating grower-brewer renegotiations. Coordination bodies such as the International Hop Growers Convention and national associations help align supply plans, but bottlenecks persist where regions lack local pelletization and extraction capacity and must ship raw material to established processors.
Competitive Landscape
The hops market involves grower-owned cooperatives and proprietary-variety breeding programs, resulting in a fragmented supply base and shifting pricing power to cultivar originators. Traditional merchant houses, some with multi-generational histories spanning 160 to 225 years, are experiencing leadership transitions. In 2024, these transitions reflect a shift from family succession models to professional management structures, driven by increasing capital intensity and global competition. These cooperatives leverage heritage relationships and proprietary varieties to serve craft brewers seeking unique aromatic profiles that set their products apart.
Opportunities are emerging in processing technology and non-brewing applications, with supercritical carbon dioxide extraction achieving a 72% alpha-acid recovery rate compared to 15% from conventional methods. This advancement enables pharmaceutical-grade purity for nutraceutical markets. In these markets, xanthohumol concentrations ranging from 0.11 to 12.7 milligrams per gram are highly valued in dietary supplements, functional foods, and cosmetics. Merchant houses are creating specialized divisions to target non-brewing markets, focusing on hop-derived antioxidants and essential oils for wellness applications. Meanwhile, smaller players are adopting direct-to-brewer sales models and on-farm pelletization, bypassing traditional merchant channels to capture value-added margins. They capitalize on the Southern Hemisphere harvest season, which spans from September to March, and their disease-free status to supply Northern Hemisphere brewers during the off-season.
Processing technology has emerged as a key area of competition. Brazil’s 72% alpha-acid recovery rate demonstrates the potential of supercritical extraction. Companies like Kalsec and John I. Haas’s BetaTec division are advancing standardized xanthohumol extracts for use in dietary supplements, which offer higher margins compared to brewing applications. Rising labor costs in regions such as Washington State, Germany, and Australia are driving mechanization and may accelerate consolidation as undercapitalized farms exit the market.
Market Opportunities and Future Outlook
Opportunities cluster around two areas where constraints are already visible: (1) climate resilience and farm-level cost reduction, and (2) higher-value downstream applications beyond brewing. Genome-enabled breeding has shifted from incremental selection to more targeted programs, supported by the May 2026 publication of a comprehensive hop genetic map led by Helmholtz Munich with Hopsteiner and the Carlsberg Research Laboratory, which supports faster development of heat- and drought-tolerant cultivars and tailored flavor traits. Kirin Holdings, in September 2025, disclosed a seedling propagation technique that uses a six-week heat treatment at 25 degrees Celsius to induce heat and drought tolerance, indicating ongoing work to stabilize yields and quality under climate stress.
On processing and diversification, higher-margin extract and nutraceutical pathways create room for growth where regions without extraction infrastructure currently ship raw cones. The context already highlights supercritical extraction achieving materially higher alpha-acid recovery compared with solvent methods, and standardized xanthohumol extracts being scaled by suppliers such as Kalsec and John I. Haas to expand into dietary supplements, functional foods, and cosmetics. Farm-side adaptation investments also function as a cost hedge, including the July 2026 expansion of a pilot agri-PV project in Bavaria (Wimmer/Gruber Tandem) covering five hectares with 2 MWp, which links crop protection and energy generation in a major hop-growing geography.
Recent Industry Developments
- April 2026: Yakima Chief Hops expanded its sourcing partnership with IGN Quality Hops in Germany to strengthen access to German hop varieties. The initiative increases supply-chain redundancy for brewers seeking European aroma profiles and reduces single-region risk during tight allocation periods.
- March 2026: Constellation Brands announced an agreement to acquire the remaining interest in HOPWTR, a non-alcoholic beverage positioned around hops-derived ingredients. The acquisition signals continued commercialization of hop-adjacent applications beyond beer and can lift demand for standardized hop extracts and flavor compounds.
- November 2024: TOP HOP GROUP announced an acquisition, expanding its footprint in the Czech hop sector. Consolidation at the processor and merchant level supports broader sourcing portfolios and can improve access to pelletization and quality-control capabilities for export-oriented supply chains.


Research Methodology Framework and Report Scope
Market Definition and Coverage
This market covers the value of hops sold for commercial use, mainly for brewing, where demand is shaped by acreage, yields, and contracting patterns across major producing and consuming regions.
Scope exclusions: We exclude finished beer and other downstream beverages, and we do not count unrelated flavoring ingredients that are not hop-derived.
Segmentation Overview
- By Geography
- North America
- United States
- Production Analysis (Area Harvested, Yield, and Production Volume)
- Consumption Analysis (Consumption Value and Volume)
- Import Market Analysis (Import Value, Volume, and Key Supplying Markets)
- Export Market Analysis (Export Value, Volume, and Key Destination Markets)
- Wholesale Price Trend Analysis and Forecast
- Regulatory Framework
- List of Key Players
- Logistics and Infrastructure
- Seasonality Analysis
- Canada
- Production Analysis (Area Harvested, Yield, and Production Volume)
- Consumption Analysis (Consumption Value and Volume)
- Import Market Analysis (Import Value, Volume, and Key Supplying Markets)
- Export Market Analysis (Export Value, Volume, and Key Destination Markets)
- Wholesale Price Trend Analysis and Forecast
- Regulatory Framework
- List of Key Players
- Logistics and Infrastructure
- Seasonality Analysis
- United States
- Europe
- Germany
- Production Analysis (Area Harvested, Yield, and Production Volume)
- Consumption Analysis (Consumption Value and Volume)
- Import Market Analysis (Import Value, Volume, and Key Supplying Markets)
- Export Market Analysis (Export Value, Volume, and Key Destination Markets)
- Wholesale Price Trend Analysis and Forecast
- Regulatory Framework
- List of Key Players
- Logistics and Infrastructure
- Seasonality Analysis
- United Kingdom
- Production Analysis (Area Harvested, Yield, and Production Volume)
- Consumption Analysis (Consumption Value and Volume)
- Import Market Analysis (Import Value, Volume, and Key Supplying Markets)
- Export Market Analysis (Export Value, Volume, and Key Destination Markets)
- Wholesale Price Trend Analysis and Forecast
- Regulatory Framework
- List of Key Players
- Logistics and Infrastructure
- Seasonality Analysis
- Russia
- Production Analysis (Area Harvested, Yield, and Production Volume)
- Consumption Analysis (Consumption Value and Volume)
- Import Market Analysis (Import Value, Volume, and Key Supplying Markets)
- Export Market Analysis (Export Value, Volume, and Key Destination Markets)
- Wholesale Price Trend Analysis and Forecast
- Regulatory Framework
- List of Key Players
- Logistics and Infrastructure
- Seasonality Analysis
- Czech Republic
- Production Analysis (Area Harvested, Yield, and Production Volume)
- Consumption Analysis (Consumption Value and Volume)
- Import Market Analysis (Import Value, Volume, and Key Supplying Markets)
- Export Market Analysis (Export Value, Volume, and Key Destination Markets)
- Wholesale Price Trend Analysis and Forecast
- Regulatory Framework
- List of Key Players
- Logistics and Infrastructure
- Seasonality Analysis
- Belgium
- Production Analysis (Area Harvested, Yield, and Production Volume)
- Consumption Analysis (Consumption Value and Volume)
- Import Market Analysis (Import Value, Volume, and Key Supplying Markets)
- Export Market Analysis (Export Value, Volume, and Key Destination Markets)
- Wholesale Price Trend Analysis and Forecast
- Regulatory Framework
- List of Key Players
- Logistics and Infrastructure
- Seasonality Analysis
- Poland
- Production Analysis (Area Harvested, Yield, and Production Volume)
- Consumption Analysis (Consumption Value and Volume)
- Import Market Analysis (Import Value, Volume, and Key Supplying Markets)
- Export Market Analysis (Export Value, Volume, and Key Destination Markets)
- Wholesale Price Trend Analysis and Forecast
- Regulatory Framework
- List of Key Players
- Logistics and Infrastructure
- Seasonality Analysis
- Slovenia
- Production Analysis (Area Harvested, Yield, and Production Volume)
- Consumption Analysis (Consumption Value and Volume)
- Import Market Analysis (Import Value, Volume, and Key Supplying Markets)
- Export Market Analysis (Export Value, Volume, and Key Destination Markets)
- Wholesale Price Trend Analysis and Forecast
- Regulatory Framework
- List of Key Players
- Logistics and Infrastructure
- Seasonality Analysis
- Germany
- Asia-Pacific
- China
- Production Analysis (Area Harvested, Yield, and Production Volume)
- Consumption Analysis (Consumption Value and Volume)
- Import Market Analysis (Import Value, Volume, and Key Supplying Markets)
- Export Market Analysis (Export Value, Volume, and Key Destination Markets)
- Wholesale Price Trend Analysis and Forecast
- Regulatory Framework
- List of Key Players
- Logistics and Infrastructure
- Seasonality Analysis
- Australia
- Production Analysis (Area Harvested, Yield, and Production Volume)
- Consumption Analysis (Consumption Value and Volume)
- Import Market Analysis (Import Value, Volume, and Key Supplying Markets)
- Export Market Analysis (Export Value, Volume, and Key Destination Markets)
- Wholesale Price Trend Analysis and Forecast
- Regulatory Framework
- List of Key Players
- Logistics and Infrastructure
- Seasonality Analysis
- Vietnam
- Production Analysis (Area Harvested, Yield, and Production Volume)
- Consumption Analysis (Consumption Value and Volume)
- Import Market Analysis (Import Value, Volume, and Key Supplying Markets)
- Export Market Analysis (Export Value, Volume, and Key Destination Markets)
- Wholesale Price Trend Analysis and Forecast
- Regulatory Framework
- List of Key Players
- Logistics and Infrastructure
- Seasonality Analysis
- China
- South America
- Brazil
- Production Analysis (Area Harvested, Yield, and Production Volume)
- Consumption Analysis (Consumption Value and Volume)
- Import Market Analysis (Import Value, Volume, and Key Supplying Markets)
- Export Market Analysis (Export Value, Volume, and Key Destination Markets)
- Wholesale Price Trend Analysis and Forecast
- Regulatory Framework
- List of Key Players
- Logistics and Infrastructure
- Seasonality Analysis
- Argentina
- Production Analysis (Area Harvested, Yield, and Production Volume)
- Consumption Analysis (Consumption Value and Volume)
- Import Market Analysis (Import Value, Volume, and Key Supplying Markets)
- Export Market Analysis (Export Value, Volume, and Key Destination Markets)
- Wholesale Price Trend Analysis and Forecast
- Regulatory Framework
- List of Key Players
- Logistics and Infrastructure
- Seasonality Analysis
- Brazil
- Middle East
- Turkey
- Production Analysis (Area Harvested, Yield, and Production Volume)
- Consumption Analysis (Consumption Value and Volume)
- Import Market Analysis (Import Value, Volume, and Key Supplying Markets)
- Export Market Analysis (Export Value, Volume, and Key Destination Markets)
- Wholesale Price Trend Analysis and Forecast
- Regulatory Framework
- List of Key Players
- Logistics and Infrastructure
- Seasonality Analysis
- United Arab Emirates
- Production Analysis (Area Harvested, Yield, and Production Volume)
- Consumption Analysis (Consumption Value and Volume)
- Import Market Analysis (Import Value, Volume, and Key Supplying Markets)
- Export Market Analysis (Export Value, Volume, and Key Destination Markets)
- Wholesale Price Trend Analysis and Forecast
- Regulatory Framework
- List of Key Players
- Logistics and Infrastructure
- Seasonality Analysis
- Turkey
- Africa
- Kenya
- Production Analysis (Area Harvested, Yield, and Production Volume)
- Consumption Analysis (Consumption Value and Volume)
- Import Market Analysis (Import Value, Volume, and Key Supplying Markets)
- Export Market Analysis (Export Value, Volume, and Key Destination Markets)
- Wholesale Price Trend Analysis and Forecast
- Regulatory Framework
- List of Key Players
- Logistics and Infrastructure
- Seasonality Analysis
- South Africa
- Production Analysis (Area Harvested, Yield, and Production Volume)
- Consumption Analysis (Consumption Value and Volume)
- Import Market Analysis (Import Value, Volume, and Key Supplying Markets)
- Export Market Analysis (Export Value, Volume, and Key Destination Markets)
- Wholesale Price Trend Analysis and Forecast
- Regulatory Framework
- List of Key Players
- Logistics and Infrastructure
- Seasonality Analysis
- Kenya
- North America
Data Sources, Market Sizing, and Validation
Desk Research
We start by building a clear fact base on hop growing, trade, and pricing because these are the practical levers that move supply and value year to year. Public datasets and official publications were used to anchor acreage trends, harvested area, yield direction, and cross-border flows, which helps avoid sizing the market from one country lens only.
Typical references include sources such as FAOSTAT for crop and area indicators, UN Comtrade for import export direction, USDA and national agriculture departments for crop outlooks, and Eurostat for regional agriculture and trade series, along with publications from hops grower and brewer associations where available. Company annual reports, investor presentations, and reputable press were used to understand contracting norms, product mix shifts, and capacity changes in processing. In addition, we used paid subscriptions for company financials and intelligence, shipment-level trade checks, and patent databases to validate technology and variety activity, and this desk list is not exhaustive because many other sources were also consulted for collection, validation, and clarification.
Primary Interviews and Surveys
To make the model realistic, we spoke with and surveyed people across the hops value chain, including growers, processors, traders, importers, and brewing procurement teams, and then we revisited assumptions where answers did not match desk signals. Since this is a global market, inputs were balanced across key producing regions and main demand centers so we could sanity check pricing, contracted versus spot shares, and variety mix shifts that change average selling prices over time.
Distribution of primary research fieldwork respondents
| Company type | Respondent position | Region |
|---|---|---|
| Top tier: 39% | CXOs: 14% | APAC: 41% |
| Mid tier: 42% | Functional/Unit leaders: 39% | EMEA: 36% |
| Smaller Players: 19% | Managers: 47% | Americas: 23% |
Market-Sizing & Forecasting
Our sizing starts with a top-down build where production and trade data reconstruct the available supply pool, which is then translated into value using wholesale price direction and product form mix checks. That view is then corroborated with selective bottom-up approximations, such as sampled price per kilogram by key origin, channel checks on contracted volumes, and supplier roll ups where public financials allow it, before totals are adjusted for gaps.
Key inputs used in the market model include harvested area and yield swings, contract coverage levels, export and import volumes by major origin and destination, average wholesale price movement, and the share shift toward higher value aroma and specialty varieties (illustrative, not exhaustive). When a country series was missing or delayed, we bridged it using nearby season patterns, trade mirrors, and interview-based sanity ranges, and then the step was documented so it can be repeated.
For forecasting, scenario analysis was used because weather-driven supply variability and contracting behavior can change availability and pricing faster than a straight line trend. Variables such as planted area intentions, brewing demand outlook, inventory tightness, and expected price progression were stress tested with experts, and we used the most consistent scenario set to extend the forecast window.
Data Validation & Update Cycle
We validate outputs by checking whether implied consumption and trade balances make sense against independent signals, such as country level export totals, observed price direction, and reported acreage shifts. When a number looks off, we break it down to the country and driver level, re-check source timing and unit conversions, and then re-contact relevant respondents if the variance remains material.
Before publication, the model and write-up go through multi-step analyst reviews so assumptions, math, and narrative stay aligned. The report is refreshed annually, and if there is a major supply shock or trade shift, an interim update is triggered. Right before delivery, a final pass is completed so clients receive the latest updated view that matches the current data cut.
Mordor Intelligence's Hops Market Size Versus Other Published Estimates
Published hops market numbers can differ even when the topic name looks the same, because the scope can shift between raw hops, processed forms, and adjacent uses outside brewing, and because pricing and trade treatments are not always consistent. The table below shows how differences in included applications, price build logic, and the year used for updates can widen or narrow the reported value.
Key gaps usually come from whether estimates fold in non-brewing uses like nutraceutical or medicinal positioning, how contract pricing is translated into an average selling price, and whether volume is aligned to production and trade balances or inferred from high level demand statements. The table also hints at refresh cadence differences, where an older data cut can miss a change in acreage, yields, or export mix that directly affects value.
Benchmark comparison
| Source | Market Size | Gaps in Research Methodology |
|---|---|---|
| Mordor Intelligence | USD 8.93 B (2026) | |
| Trade Journal A | USD 8.10 B (2023) | Uses an earlier base year and presents a shorter horizon, and it appears to mix broad use cases without clearly reconciling them to production and trade balances, which can shift the implied price level. |
| Regional Consultancy B | USD 7.80 B (2026) | Broader stated coverage across applications is paired with limited clarity on price formation by form and contract versus spot share, which can pull the value down when a conservative blended ASP is applied. |
The table shows a spread that largely comes from scope and pricing treatment, and in Mordor Intelligence's model the value is tied back to production, import export movements, and wholesale price trend checks for the 2026 data cut so the market total stays traceable to repeatable drivers.


Key Questions Answered in the Report
What is the projected value of the hops market in 2031?
The hops market is forecast to reach USD 11.32 billion by 2031.
Which region commands the largest share of hops revenue?
Europe held 42.3% of global value in 2025 due to Germany’s dominant production and processing capacity.
Which region is growing the fastest in hops demand?
Asia-Pacific is projected to grow at 5.1% annually through 2031, driven by China’s expanding craft segment.
Why are aroma hops increasingly important to brewers?
Premium lagers and craft beers use higher late-addition hopping rates, creating 15–20% price premiums for cultivars like Citra and Nelson Sauvin.
What new non-brewing opportunities exist for hop growers?
Supercritical extraction enables high-purity xanthohumol for nutraceuticals and functional foods, offering higher margins than traditional brewing channels.
Page last updated on:


 Your data is secure and never sold or shared.


