
Market Overview
| Study Period | 2020 - 2031 |
|---|---|
| Forecast Data Period | 2026 - 2031 |
| Base Year Market Size (2025) | USD 9.74 Billion |
| Market Size (2026) | USD 9.98 Billion |
| Market Size (2031) | USD 11.27 Billion |
| Growth Rate (2026 - 2031) | 2.47 % |
| Market Concentration | Medium |
Major Players *Disclaimer: Major Players sorted in no particular order Image © Mordor Intelligence. Reuse requires attribution under CC BY 4.0. | |
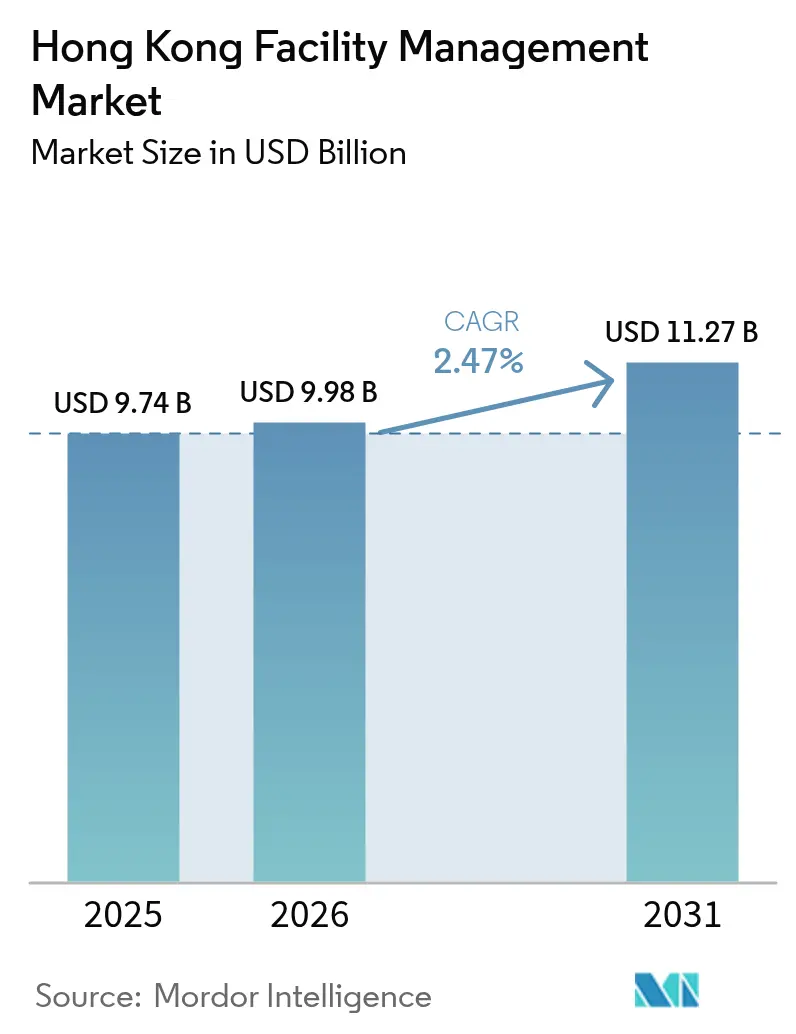
Hong Kong Facility Management Market Analysis by Mordor Intelligence
The Hong Kong facility management market size was valued at USD 9.74 billion in 2025 and estimated to grow from USD 9.98 billion in 2026 to reach USD 11.27 billion by 2031, at a CAGR of 2.47% during the forecast period (2026-2031). The expansion rate reflects a mature real-estate base where incremental value comes from service sophistication, technology integration, and strict regulatory compliance rather than new floor-area additions. Government megaprojects, a surging data-center footprint, and mandatory green-building standards are the leading demand catalysts, while workforce shortages and aggressive low-bid tenders constrain margin expansion. International and local providers, therefore, focus on integrated contracts, digital maintenance platforms, and ESG-oriented offerings to capture premium opportunities inside the Hong Kong facility management market.
Key Report Takeaways
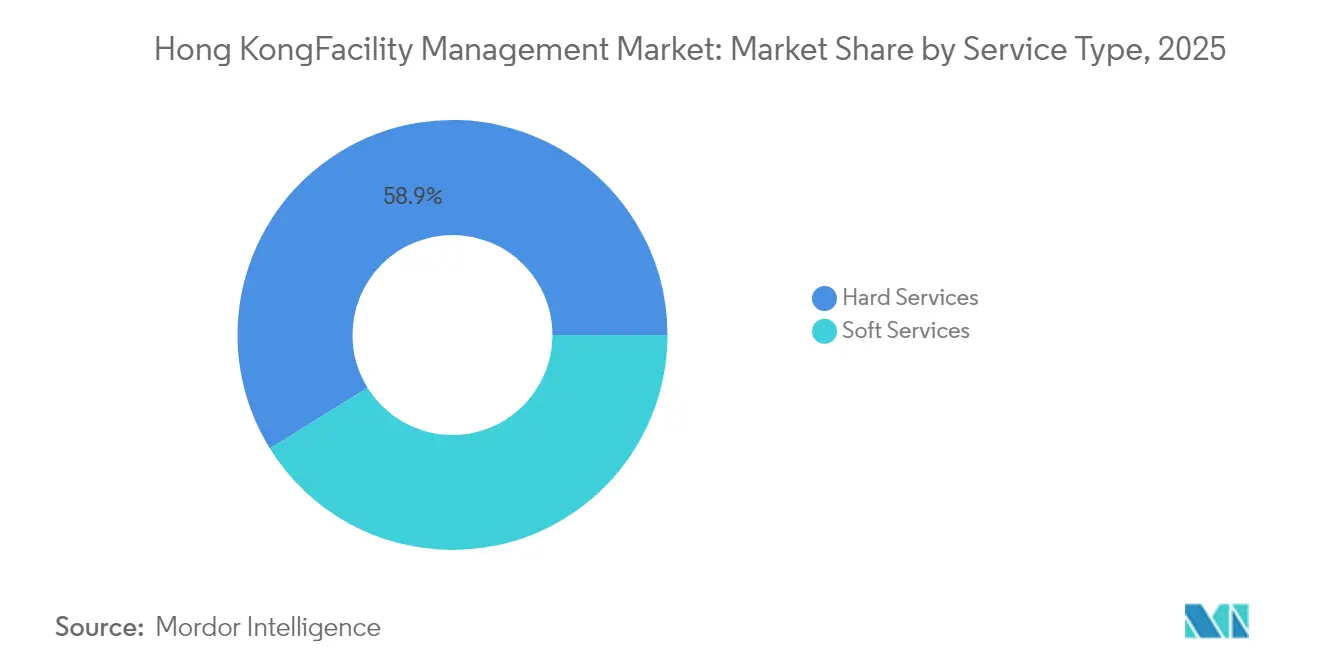
- By service type, Hard Services commanded 58.85% revenue share in 2025, whereas Soft Services is forecast to post a 3.63% CAGR to 2031 as wellness, security, and waste-management contracts scale up.
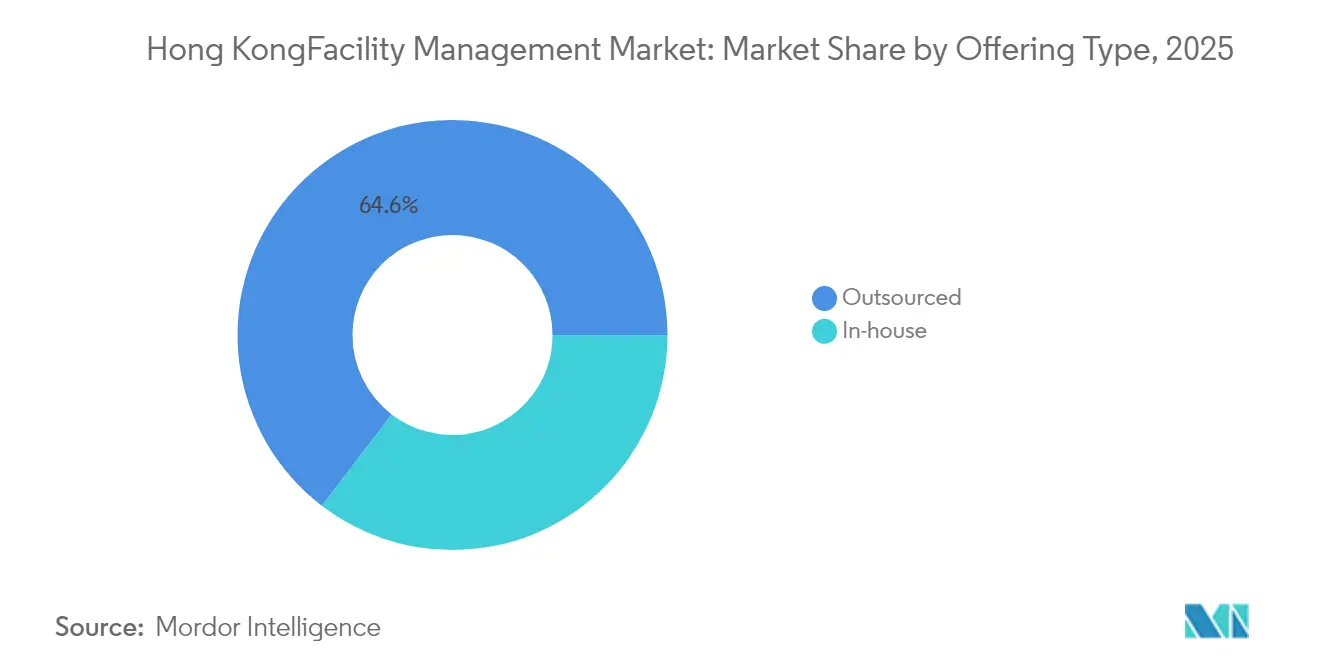
- By offering type, outsourced models accounted for 64.60% of the Hong Kong facility management market share in 2025, and the category is set to grow at 3.12% through 2031, driven by cost-flexibility needs and new procurement-transparency rules.
- By end-user industry, the Commercial segment held 37.05% of the Hong Kong facility management market size in 2025; Institutional and Public Infrastructure is projected to expand at 4.02% CAGR, supported by refurbishment budgets and transport links.
Note: Market size and forecast figures in this report are generated using Mordor Intelligence’s proprietary estimation framework, updated with the latest available data and insights as of 2026.
Hong Kong Facility Management Market Trends and Insights
Drivers Impact Analysis*
| Driver | (~) % Impact on CAGR Forecast | Geographic Relevance | Impact Timeline |
|---|---|---|---|
| Rapid recovery in Grade-A office occupancy post-pandemic | +0.8% | Hong Kong Island, Kowloon Central | Medium term (2-4 years) |
| Government-led infrastructure megaprojects boosting FM demand | +1.2% | New Territories, Lantau Island | Long term (≥ 4 years) |
| Corporate push for green buildings and ESG-certified facilities | +0.6% | Central, Admiralty, Tsim Sha Tsui | Medium term (2-4 years) |
| Cost-optimization drive toward outsourced Integrated FM models | +0.9% | Territory-wide | Short term (≤ 2 years) |
| Mandated BIM–AI convergence driving predictive maintenance services | +0.4% | New developments, data centers | Long term (≥ 4 years) |
| Expanding data-center footprint requiring specialised mission-critical FM | +0.7% | Tseung Kwan O, Tsuen Wan | Medium term (2-4 years) |
| Source: Mordor Intelligence | |||
Government-led Infrastructure Megaprojects Boosting FM Demand
The government’s capital works pipeline sustained the strongest pull on the Hong Kong facility management market before June 2025. The Kwu Tung North and Fanling North project, valued at HK$17.32 billion (USD 2.25 billion), covered 70 hectares of land formation and required asset-lifecycle FM contracts for MEP, fire safety, and compliance monitoring.[1]Annual public works spending of HK$225–345 billion (USD 29.2–44.8 billion) further broadened the tender pool for technical service providers. Complex undertakings such as Route 6’s subsea tunnel needed BIM-enabled maintenance schemes that only integrated operators could supply. Providers that pair hard and soft capabilities, therefore, secured multi-year revenue visibility inside the Hong Kong facility management market.
Corporate Push for Green Building and ESG-Certified Facilities
BEAM Plus registrations climbed to 1,996 projects by April 2025, confirming that sustainability metrics became a central procurement filter for landlords and occupiers. Swire Properties reported that 98% of its wholly owned buildings held the highest BEAM Plus rating, raising the performance bar for FM vendors. The Hong Kong Green Label Scheme granted bonus BEAM credits for certified products, accelerating demand for transparent supply chains. Hang Lung’s tenant-focused “Changemakers” program wove green-service clauses into FM contracts, while ISS created a Group Head of ESG role to embed sustainability know-how. These shifts channelled incremental value toward operators with verified energy-optimisation and reporting capabilities, deepening the Hong Kong facility management market penetration within Grade-A portfolios.
Cost-Optimization Drive Toward Outsourced Integrated FM Models
Economic uncertainty and high interest rates spurred occupiers to swap fixed payrolls for variable-cost contracts. CBRE’s facility-management revenue rose 16% year-on-year in Q1 2025, led by technology and life-sciences clients seeking bundled solutions. Outsourcing already held a 65.1% share of the Hong Kong facility management market in 2024, and the Building Management Amendment Ordinance 2024 mandated tender transparency that favoured licensed integrated providers. Clients realised savings of up to 12% versus fragmented sourcing, reinforcing the pull toward single-invoice models. As a result, outsourced Integrated FM is set to outgrow the overall Hong Kong facility management market through 2030.
Expanding Data-Centre Footprint Requiring Mission-Critical FM
Cloud and AI workloads sparked a data-centre construction spree across Tseung Kwan O and Tsuen Wan. Equinix committed USD 124 million to the HK6 site, featuring 3,550 high-density cabinets with liquid cooling that demands 24/7 thermal analytics and redundancy management. SUNeVision launched plans for the 470,000 square-foot Mega Plus campus, necessitating predictive power-usage assessments and Tier-4 security protocols. Mission-critical FM contracts typically price at a 40–60% premium over standard commercial assets, making the segment the most profitable slice of the Hong Kong facility management market.
Restraints Impact Analysis*
| Restraint | (~) % Impact on CAGR Forecast | Geographic Relevance | Impact Timeline |
|---|---|---|---|
| Prolonged real-estate price volatility dampens new contracts | -0.4% | Central, Admiralty, Causeway Bay | Short term (≤ 2 years) |
| Escalating labour costs amid a skilled technician shortage | -0.6% | Territory-wide | Medium term (2-4 years) |
| Tightening foreign-worker visa quotas restricts the FM workforce supply | -0.3% | Territory-wide | Long term (≥ 4 years) |
| Margin squeeze from aggressive low-bid tendering culture | -0.2% | Government contracts, SME sector | Short term (≤ 2 years) |
| Source: Mordor Intelligence | |||
Escalating Labour Costs Amid Skilled-Technician Shortage
The Labour and Welfare Bureau projected a territory-wide deficit of 180,000 workers by 2028, with construction and city operations trades hardest hit. Certified HVAC technicians commanded wage increases of 8–10% during 2024, eroding contract margins for FM providers. The Construction Industry Council promoted Modular Integrated Construction, which delivered 30% faster build times and 70% labour savings on pilot projects, but up-front technology investment weighed on service providers. Firms responded by cross-training staff and adopting sensor-based fault detection to maintain service standards inside the Hong Kong facility management market despite the talent squeeze.
Tightening Foreign-Worker Visa Quotas Restricting Workforce Supply
Policy changes narrowed visa pathways for blue-collar roles in 2024, forcing FM operators to rely more on local recruitment and automation. Although the Top Talent Scheme attracted managerial applicants, it did little for cleaning and security shortages. Providers installed IoT networks—such as Milesight’s estate-wide rollout—to replace manual patrols and reduce headcount needs by 40%. Over time, firms with robust training pipelines and digital-twin capabilities will remain resilient in the Hong Kong facility management market.
*Our forecasts treat driver/restraint impacts as directional, not additive. The impact forecasts reflect baseline growth, mix effects, and variable interactions.
Segment Analysis
By Offering Type: Outsourcing Commands Two-Thirds of Spend
Outsourced contracts held 64.60 of % Hong Kong facility management market share in 2025 and are projected to rise to 66.20% by 2031. Integrated FM combines engineering, cleaning, and catering in one invoice, creating 10–12% total-cost savings versus fragmented sourcing. The Building Management Amendment Ordinance 2024 required greater tender transparency and favoured licensed operators, accelerating the move toward professional providers. In-house teams persisted in hospitals, universities, and statutory bodies that value security and direct control, yet even these entities adopted outsourced consultancy for energy audits, adding incremental revenue to the Hong Kong facility management market.

By End-User Industry: Commercial Stock Dominates, Public Infrastructure Accelerates
Commercial assets generated 37.05% of the Hong Kong facility management market size in 2025. Grade-A vacancies peaked at 12.9% in January 2024, but landlords upgraded tenant-experience amenities to protect rental yields, fuelling demand for smart-office support. Logistics facilities such as Goodman’s 112,549 square-meter Gateway complex required 24/7 systems monitoring, broadening the service scope.
Institutional and Public Infrastructure is poised for the fastest growth at 4.02% CAGR. The Architectural Services Department allocated HK$1–30 million (USD 0.13–3.9 million) per refurbishment across parks, sports centres, and correctional buildings in its 2024-25 program. Healthcare facilities adopted AI-driven waste-segregation and predictive maintenance to meet infection-control standards, adding high-margin work orders to the Hong Kong facility management market.
By Service Type: Hard Services Anchor Revenue, Soft Services Lead Growth
Hard Services accounted for 58.85% of 2025 revenue, highlighting how regulatory inspections on electrical, plumbing, and fire-safety systems underpin the Hong Kong facility management market. Five-year electrical recertifications and monthly potable-water checks kept contractor backlogs high. Record summer temperatures, averaging 29.7 °C in August 2023, further increased HVAC optimisation demand. Consequently, Hard Services retained the largest share of the Hong Kong facility management market in 2025.
Soft Services will grow fastest at 3.63% CAGR through 2031. Housing Society pilots showed that pay-as-you-throw schemes cut refuse by 10% and lifted recycling by 23%, triggering higher demand for specialised cleaning and waste-audit contracts. Security, front-of-house, and catering vendors extended offerings around wellness and digital-badge access. Therefore, Soft Services will expand its slice of the Hong Kong facility management market even though Hard Services continues to anchor absolute revenue.
Geography Analysis
Hong Kong Island delivered the highest per-square-foot FM spend because Central and Admiralty housed the bulk of Grade-A offices. Even amid elevated vacancies, landlords retained premium maintenance contracts to uphold ESG credentials. Kowloon’s mixed commercial-industrial profile demanded both heavy-duty mechanical services and retail-oriented soft services, creating a balanced revenue mix for the Hong Kong facility management market.
The New Territories emerged as the principal growth engine. Government plans for a Northern Metropolis and Route 6 tunnel opened demand for compliance-focused FM, while Tseung Kwan O’s data-centre cluster added mission-critical requirements at premium rates. Modular Integrated Construction pilots in Fanling demonstrated cost and speed gains that later translated into lower life-cycle FM expenses but higher digital-service intensity.
Across all districts, rising climate volatility raised cooling loads. Observatory forecasts indicated 2025 would again challenge heat records, pushing asset owners toward AI-based chiller optimisation in an effort to curb energy bills and maintain indoor comfort within the Hong Kong facility management market.
Regulatory Landscape
Hong Kong facility management operates under a multi-agency compliance stack that links licensing, building safety, and energy performance to day-to-day service delivery. The Property Management Services Authority (PMSA) regulates property management companies and practitioners under the Property Management Services Ordinance (Cap. 626), while the Secretary for Home and Youth Affairs issues the Code of Practice on Building Management and Safety under the Building Management Ordinance (Cap. 344), shaping maintenance standards that influence inspection routines, documentation, and vendor selection for regulated works.
On the technical and sustainability side, the Buildings Energy Efficiency Ordinance (Cap. 610) enforces minimum energy performance through the Building Energy Code and the Energy Audit Code. This tightens the compliance role of FM teams in audit preparation, metering data capture, and remedial works planning. For public-sector assets, the Architectural Services Department (ArchSD) Guidebook for Innovative and Smart Technologies and the Electrical and Mechanical Services Department (EMSD) BIM-AM Standards further codify interoperability and lifecycle information requirements, including the use of open protocols such as BACnet for centralized control. As a result, procurement increasingly favors integrated providers that can align BMS, BIM-based asset data, and ongoing maintenance reporting.
Value Chain Analysis
The Hong Kong facility management value chain starts with asset owners and occupiers, including commercial landlords, public works clients, housing operators, and data centers, that define compliance, uptime, and ESG requirements. This is followed by contract structuring through single FM, bundled FM, or integrated FM models. Outsourced lead contractors then assemble delivery using a mix of in-house engineering and specialist subcontractors, covering areas such as HVAC, electrical, fire systems, lifts, water quality, cleaning, and security. OEMs and distributors supply spares and controls, while proptech providers contribute BMS integration, sensors, and analytics.
Regulation and digital standards increasingly shape the operating backbone of the chain. The 2024 Edition of the Building Energy Code (BEC 2024), gazetted on 22 November 2024 under the Buildings Energy Efficiency Ordinance (Cap. 610), raises the data and performance bar for building systems. Government guides from ArchSD and lifecycle information frameworks from EMSD (BIM-AM) also reinforce platform interoperability and structured asset data from design through upkeep. Persistent labor constraints continue to bottleneck field execution, which is accelerating adoption of remote monitoring, digital workflows, and centralized control-tower operating models among major providers such as FSE Lifestyle Services (Urban Group), Synergis, and G4S Facility Services in Hong Kong.
Competitive Landscape
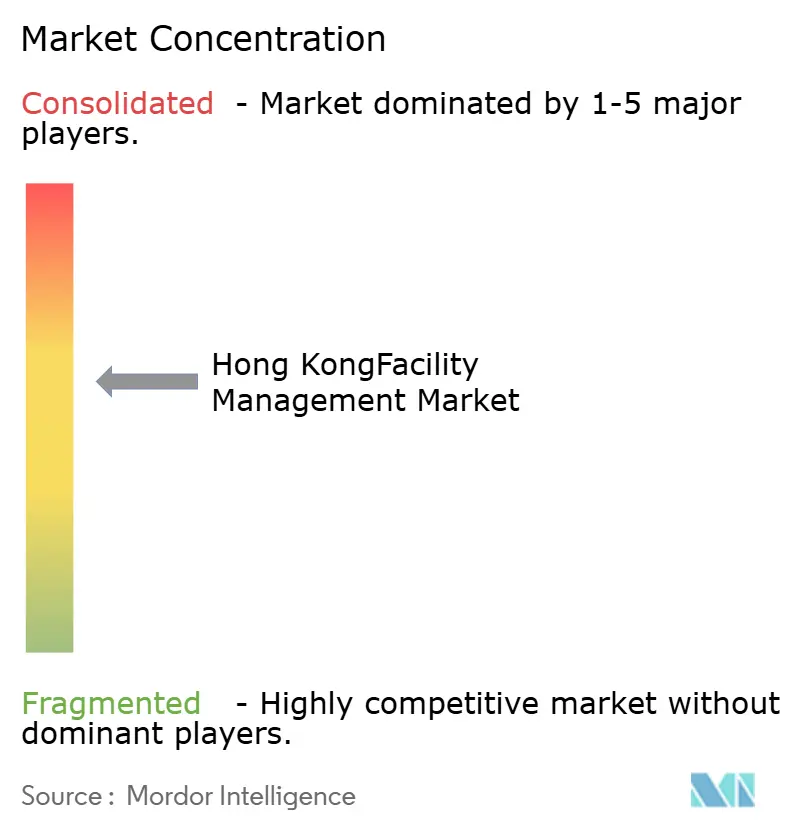
The market remained moderately fragmented in 2024-25. Multinationals ISS, CBRE, Sodexo, JLL leveraged global platforms to secure cross-border contracts. Regional specialists like Savills Hong Kong, Knight Frank, and Colliers combined brokerage insight with local compliance expertise to upsell FM mandates. Domestic operators, including Sino Property Services, Hang Yick, and Urban Group, retained stronghold positions in residential estates due to community ties and licensing familiarity.
Technology adoption defines competitive advantage. Milesight’s sensor suite cut manual patrol hours and provided real-time alerts, improving response times by 30%.[4] CBRE integrated AI-driven energy analytics for life-sciences clients, while ISS formalised an ESG governance framework to satisfy green-procurement audits. The Construction Industry Council’s CITF subsidies for BIM, laser scanners, and safety systems lowered capital barriers for prop-tech entrants, intensifying rivalry within the Hong Kong facility management market.
Regulation also shaped positioning. The Building Management Amendment Ordinance 2024 enforced licensed-provider requirements for major property functions, a shift that is expected to nudge smaller, non-compliant firms toward merger or exit. Collectively, the top five suppliers controlled about 40% of 2024 revenue, leaving ample room for consolidation.
Hong Kong Facility Management Industry Leaders
-
Savills Hong Kong Limited
-
Knight Frank Hong Kong Limited EAA
-
G4S Facility Services Hong Kong Limited
-
Urban Group
-
Dusservice Hong Kong
- *Disclaimer: Major Players sorted in no particular order
Market Opportunities and Future Outlook
Energy-audit readiness and data-backed operations create a clear whitespace for providers that can package metering, analytics, and compliance reporting into recurring service lines. The Energy Audit Code 2024 framework under the Buildings Energy Efficiency Ordinance tightens audit planning and documentation discipline, with audits commencing on or after 20 September 2026 under the updated requirements. This is lifting demand for FM teams that can connect BMS data, maintenance records, and rectification programs into auditable evidence.
Platform-led, interoperable smart building operations is also emerging as a practical opportunity area, supported by both private-sector deployments and public-sector trial mechanisms. NTT Com Asia launched its OCEAN Intelligence smart building platform in February 2025 to support real-time equipment data collection and predictive AI use cases. Hongkong Land announced an AI-powered integrated facility management control tower (IFMCT) rollout across Alexandra House, Charter House, and Exchange Square, with a pathway to broader deployment across its Central Portfolio. On the public side, EMSD has used the E&M InnoPortal to connect government innovation needs with solution providers, facilitating over 200 trial projects, and the Hong Kong Housing Authority is implementing smart estate management pilots across ten public rental housing estates. This expands the addressable scope for IoT-enabled security, cleaning, and maintenance automation within large, multi-building portfolios.
Recent Industry Developments
- April 2026: Savills Property Management Limited obtained certification under the Water Supplies Department Quality Water Supply Scheme for Buildings, Fresh Water (Management System) for its management operations and 10 managed properties. The milestone improves Savills' ability to win and retain mandates where water system governance and documented operating controls are embedded in tenant and regulator expectations.
- March 2026: Savills Property Management Group partnered with Ricoh Hong Kong Limited to implement AI and drone technology for external building facade inspections across a managed portfolio of more than 222,000 units and 190 million square feet. The collaboration shifts inspections toward safer, higher-frequency, data-driven workflows and supports compliance-led services for scaled operators.
- January 2026: FSE Lifestyle Services Limited commenced a new property management services agreement with CIFI Group for the period from 1 January 2026 to 31 December 2028. The multi-year renewal highlights the role of long-duration contracts in stabilizing outsourced FM revenue and supports continued investment in delivery capabilities across managed portfolios.
Research Methodology Framework and Report Scope
Market Definition and Coverage
For this study, the Hong Kong facility management market is defined as the value of services used to operate, maintain, and support buildings and sites across hard and soft needs, delivered through in-house teams or outsourced contracts.
Scope exclusions: Excludes new-build construction and major capital upgrades that are booked as project works rather than ongoing facility operations.
Segmentation Overview
- By Offering Type
- In-house
- Outsourced
- Single FM
- Bundled FM
- Integrated FM
- By End-user Industry
- Commercial (IT and Telecom, Retail and Warehouses, etc.)
- Hospitality (Hotels, Eateries, Large-scale Restaurants)
- Institutional and Public Infrastructure (Govt, Education, Transportation)
- Healthcare (Public and Private Facilities)
- Industrial and Process (Manufacturing, Energy, Mining)
- Other End-user Industries (Multi-housing, Entertainment, Sports and Leisure)
- By Service Type
- Hard Services
- Asset Management
- MEP and HVAC Services
- Fire Systems and Safety
- Other Hard FM Services
- Soft Services
- Office Support and Security
- Cleaning Services
- Catering Services
- Other Soft FM Services
- Hard Services
Data Sources, Market Sizing, and Validation
Desk Research
Desk research helped us map the demand base and the rules that shape service buying in Hong Kong. We relied on public sources such as the Hong Kong Census and Statistics Department, Buildings Department releases, Electrical and Mechanical Services Department guidance, and Environment and Ecology Bureau climate and energy policies, which signal maintenance intensity and compliance work.
We also reviewed sources such as trade association publications, listed-company annual reports, investor presentations, and reputable press coverage to understand outsourcing patterns, contract formats, and price movement across common service lines. Where needed, paid subscriptions for company financials and intelligence, news and financials, and patent databases were used to fill gaps on provider revenue exposure, technology adoption signals, and major contract announcements. The desk sources cited above are illustrative only, and many other public and paid references were also used for data collection, validation, and clarification.
Primary Interviews and Surveys
We conduct expert interviews and surveys with facility heads, property managers, procurement leaders, engineers, and finance or operations managers in Hong Kong. Their input helps test fee levels, outsourcing shares, labor intensity, contract renewal behavior, and demand across property types in the local market. Follow-up questions help resolve gaps and compare reported views with desk data.
Distribution of primary research fieldwork respondents
| Company type | Respondent position |
|---|---|
| Top tier: 29% | CXOs: 18% |
| Mid tier: 49% | Functional/Unit leaders: 32% |
| Smaller Players: 22% | Managers: 50% |
Market-Sizing & Forecasting
Sizing was built using top-down and bottom-up checks, so the final totals remain explainable and repeatable. From the top-down side, we reconstructed the addressable annual spend by linking Hong Kong's active built stock and occupied space with typical service intensity and outsourcing share across hard and soft FM.
In practice, a few market fingerprints did most of the work, including the mix of hard versus soft service needs in dense high-rise assets, the pace of outsourced adoption versus in-house delivery, labor cost and availability trends for on-site roles, compliance-led maintenance cycles for MEP and fire safety systems, and the growth of data centers and other high-uptime facilities that raise baseline O&M spend. Those assumptions were then corroborated using selective bottom-up approximations such as sampled contract values, provider revenue exposure to Hong Kong FM, and channel checks on prevailing monthly service rates, with gaps handled through conservative range-setting and follow-up calls.
For forecasting, we used scenario analysis supported by short time-series smoothing, which works well when growth is steady and is driven by a few clear levers. The key levers that were stress-tested with experts included outsourcing penetration, wage inflation versus productivity, building retrofit activity that changes maintenance intensity, and policy-driven demand tied to energy and safety requirements.
Data Validation & Update Cycle
Totals and growth rates were validated through triangulation across independent signals, and then reviewed through step-by-step checks before sign-off. We compared outputs against related indicators such as constructed and occupied floor space trends, large contract awards, and the implied spend per square foot for common building types, and then investigated outliers where implied pricing or volumes drifted from interview reality.
When a material variance showed up, assumptions were reworked and the relevant experts were re-contacted to confirm the updated inputs. Reports are refreshed annually, and interim updates are made when major policy changes, sharp labor shifts, or unusually large outsourcing deals can move the near-term outlook. Before delivery, a final analyst pass is completed so clients receive the most current view based on the latest available information.
Mordor Intelligence's Hongkong Facility Management Market Size Compared With Other Published Estimates
Published market values for facility management in Hong Kong can differ widely because the service bundle is not defined the same way across sources, and currency timing and base years are not always aligned. We see the biggest gaps when one estimate mixes property services, parking operations, or hotel management into the same bucket as day-to-day facility operations, which changes the spend pool.
The main gap comes from whether property management and parking management are counted inside facility management totals, where Mordor Intelligence treats the market as hard and soft FM services tied to operating and maintaining the built environment, rather than broader property service revenue. Differences also show up when older estimates are kept in HKD and then converted using a single exchange rate, or when aggressive outsourcing penetration is assumed without validating it by end-user building type.
Benchmark comparison
| Source | Market Size | Gaps in Research Methodology |
|---|---|---|
| Mordor Intelligence | USD 9.74 B (2025) | |
| Industry Study A | USD 10.49 B (2025) | Uses a wider service bucket that includes items such as property management and car parking rental and management, which inflates totals versus a pure FM definition, and it is originally stated in HKD with conversion assumptions not consistently disclosed. |
| Regional Consultancy B | USD 5.04 B (2026) | Appears to emphasize outsourced and technology-led contracts and may exclude in-house delivery, which can undercount total spend in a mature market where many assets still retain internal teams for core operations. |
Overall, the spread is explained mostly by scope choices and how currency and base year assumptions are handled. By keeping inputs tied to observable building operations demand drivers, and then checking them with supplier and buyer interviews, the resulting market size stays easier to trace back to clear variables and repeatable steps.
Key Questions Answered in the Report
What is the current size of the Hong Kong facility management market?
The Hong Kong facility management market size reached USD 9.98 billion in 2026 and is expected to hit USD 11.27 billion by 2031 at a 2.47% CAGR during 2026-2031.
Which segment is expanding fastest?
Soft Services is projected to grow at 3.63% CAGR through 2031, outpacing Hard Services as corporations prioritise wellness, security, and waste-audit solutions.
Why is outsourcing dominant in Hong Kong?
Outsourced contracts capture more than 64.60% share because integrated providers deliver 10–12% cost savings and meet new procurement-transparency rules, making them attractive amid economic uncertainty.
How do government megaprojects affect demand?
Projects worth HK$225–345 billion (USD 29.2–44.8 billion) annually require comprehensive FM support from design through operations, adding long-term revenue streams for integrated providers.
What are the main challenges for service providers?
Labour shortages and rising technician wages inflate operating costs, while tighter visa quotas limit foreign-worker inflow, compelling firms to invest in automation and training.
How important is ESG in facility management contracts?
BEAM Plus and Green Label criteria now influence vendor selection, pushing FM companies to offer energy optimisation, transparent sourcing, and real-time sustainability reporting.