
Market Overview
| Study Period | 2020 - 2031 |
|---|---|
| Forecast Data Period | 2026 - 2031 |
| Base Year Market Size (2025) | USD 10.73 Billion |
| Market Size (2026) | USD 10.93 Billion |
| Market Size (2031) | USD 11.98 Billion |
| Growth Rate (2026 - 2031) | 1.86% CAGR |
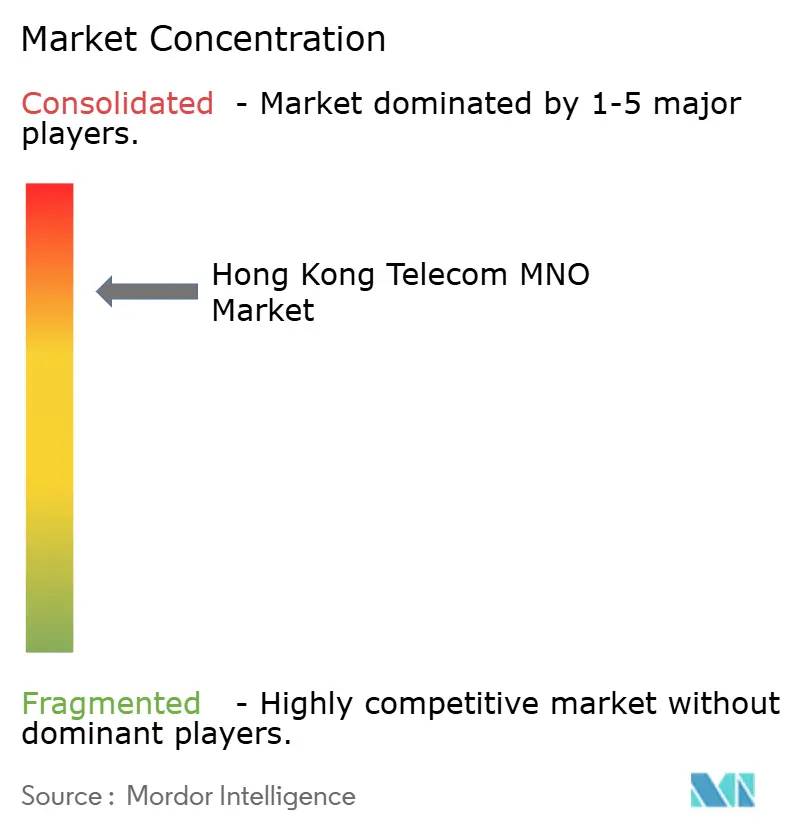
| Market Concentration | High |
Major Players *Disclaimer: Major Players sorted in no particular order Image © Mordor Intelligence. Reuse requires attribution under CC BY 4.0. | |
Hong Kong Telecom MNO Market Analysis by Mordor Intelligence
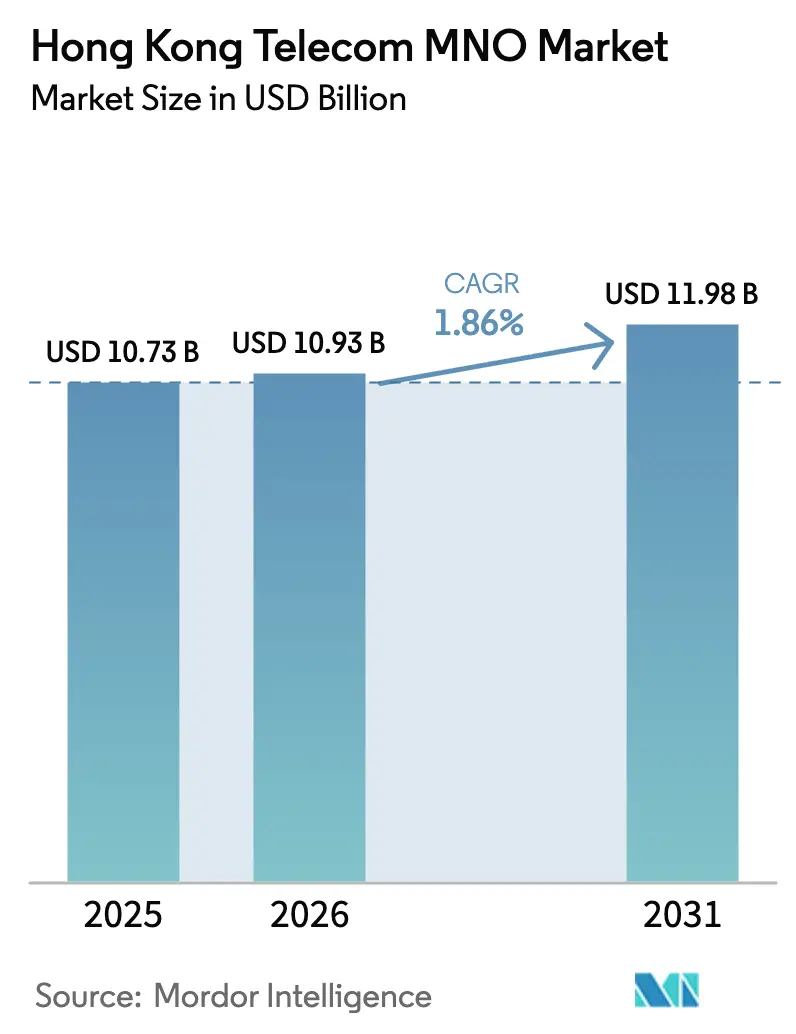
The Hong Kong Telecom MNO Market size was valued at USD 10.73 billion in 2025 and estimated to grow from USD 10.93 billion in 2026 to reach USD 11.98 billion by 2031, at a CAGR of 1.86% during the forecast period (2026-2031).
Hong Kong’s mature subscriber base-mobile penetration exceeds 300%-shifts growth away from customer acquisition toward value-added data services, enterprise private 5G solutions, and cross-border roaming bundles. Operators are prioritizing 5G network densification, edge computing, and API exposure to monetize ultra-low-latency applications while simultaneously navigating energy-cost inflation and spectrum-related cash outflows. Regulatory incentives such as tax deductions on spectrum fees and a transparent auction pipeline reinforce capital spending discipline, whereas competition from digital-only MVNOs intensifies price pressure in entry-level plans. Strategic asset sales and targeted acquisitions illustrate how carriers are freeing up balance-sheet capacity to fund infrastructure upgrades and pursue the next wave of enterprise demand.
Key Report Takeaways
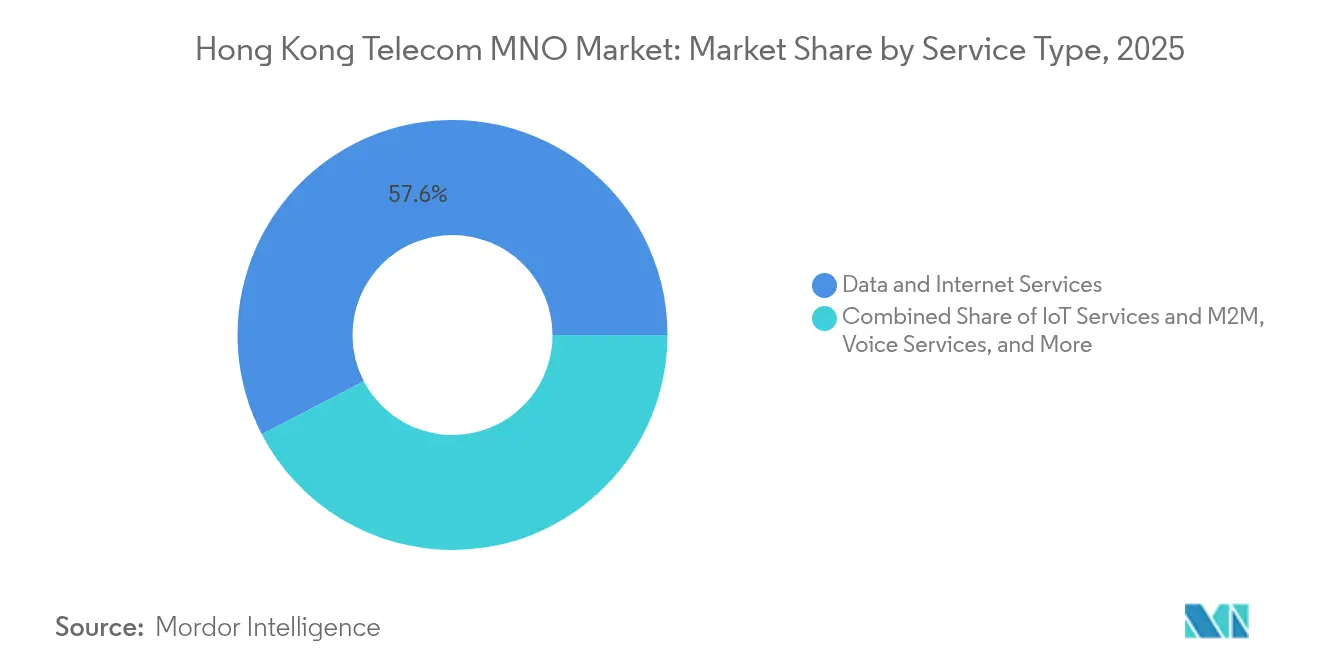
- By service type, Data and Internet Services led with 57.63% revenue share in 2025; IoT and M2M Services are forecast to expand at a 1.93% CAGR through 2031.
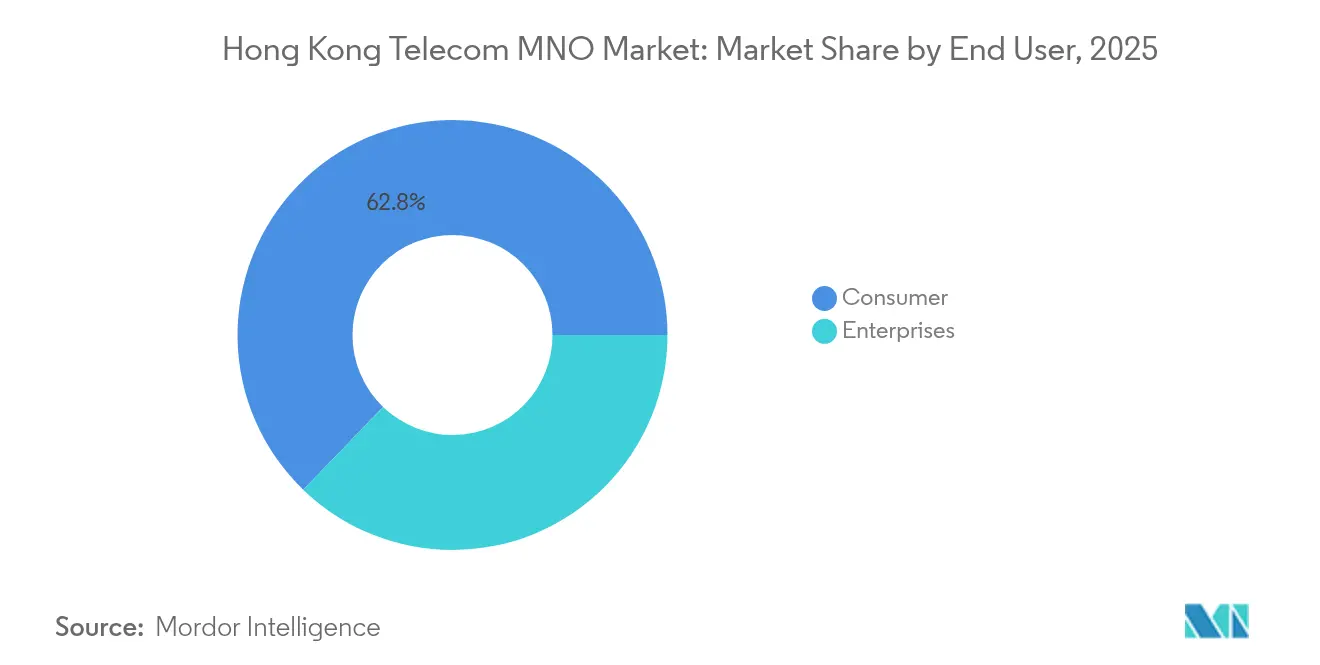
- By end user, the consumer segment held 62.78% of the Hong Kong Telecom MNO market share in 2025, while enterprise is projected to grow at a 2.09% CAGR to 2031.
Note: Market size and forecast figures in this report are generated using Mordor Intelligence’s proprietary estimation framework, updated with the latest available data and insights as of 2026.
Hong Kong Telecom MNO Market Trends and Insights
Drivers Impact Analysis*
| Driver | (~) % Impact on CAGR Forecast | Geographic Relevance | Impact Timeline |
|---|---|---|---|
| 5G adoption accelerating data ARPU uplift | +0.4% | Hong Kong SAR, Greater Bay Area | Medium term (2-4 years) |
| Enterprise demand for private 5G and IoT connectivity | +0.3% | Hong Kong SAR, mainland China | Long term (≥ 4 years) |
| Surge in OTT video and cloud-gaming traffic | +0.2% | Hong Kong SAR | Short term (≤ 2 years) |
| GBA cross-boundary roaming bundles boosting usage | +0.2% | Greater Bay Area corridor | Medium term (2-4 years) |
| Government green-net incentives reducing opex | +0.1% | Hong Kong SAR | Long term (≥ 4 years) |
| Open-Gateway API monetization opportunities | +0.1% | Hong Kong SAR, regional | Long term (≥ 4 years) |
| Source: Mordor Intelligence | |||
5G Adoption Accelerating Data ARPU Uplift
All four operators have surpassed 99% population coverage on 5G, enabling tiered pricing based on speed, latency, and guaranteed network slices.[1]Paul Rainford, “Hutchison Showcases 3.1 Gbps at 5G-Advanced Trial,” LIGHTREADING.COM HKT reported 1.571 million 5G subscribers, 46% of its postpaid base, by mid-2024, while Hutchison hit 54% package penetration, signaling rapid migration away from legacy services.[2]HKT launched a smartphone POS app for merchants, expanding fintech service revenues HKT.COM.The shift supports premium tariffs for immersive video, AR navigation, and real-time analytics that depend on 3 Gbps download rates demonstrated at venues such as the Hong Kong Exhibition Center. As 5G-Advanced features roll out, operators anticipate double-digit uplifts in average data usage per user, cushioning ARPU erosion from entry-level plans. Near-term monetization stems largely from high-value customers, yet network slicing positions carriers to scale bespoke latency-sensitive services for enterprises over the forecast window.
Enterprise Demand for Private 5G and IoT Connectivity
Digital transformation across finance, logistics, and utilities is unlocking multi-year contracts for dedicated 5G networks that guarantee throughput, latency, and security. China Mobile Hong Kong’s inertial-navigation system for the Fire Services Department and HK Electric’s robotics collaboration with Hutchison showcase high-reliability, low-latency use cases. Enterprise growth, clocking a 2.15% CAGR, outpaces the broader Hong Kong Telecom MNO market as businesses pay premiums for managed connectivity, edge computing, and cybersecurity bundles. Operators leverage network slicing to deliver data-sovereignty-compliant environments, creating recurring revenue streams that offset flat consumer ARPU. The Greater Bay Area’s dense manufacturing hub amplifies addressable demand, strengthening the long-term contribution of enterprise services to top-line growth.
Surge in OTT Video and Cloud-Gaming Traffic
Over-the-top video and cloud gaming dominate downstream traffic, with Ericsson forecasting outsized uplink demand from AI-enhanced video assistants and user-generated immersive content. [3]Ericsson Mobility Report 2025, “AI Video Dynamics,” ERICSSON.COMNow TV’s addressable advertising platform leverages network analytics to deliver personalized content, adding incremental revenue layers for 5G-enabled multicast services. Traffic profiles increasingly require symmetrical bandwidth and ultra-low latency, compelling operators to upgrade backhaul and invest in mobile edge computing nodes. While spectrum amortization costs squeeze margins, bandwidth-hungry applications support tiered pricing that can stabilize ARPU. As AI-driven video creation enters mainstream consumer behavior, carriers anticipate a step-change in data consumption, necessitating accelerated densification of small-cell sites across Hong Kong’s dense urban landscape.
GBA Cross-Boundary Roaming Bundles Boosting Usage
Cross-border travel rebounded sharply following pandemic reopening, lifting Hutchison’s roaming revenue by 30% to HKD 684 million (USD 88 million) in 2024. China’s approval of 5G cross-network roaming among its four national operators underpins seamless connectivity for tourists and business travelers. Hong Kong carriers bundle mainland data allowances with local plans, reducing bill-shock and stimulating higher-usage patterns. The Greater Bay Area Integration Scheme positions Hong Kong as a connectivity hub, enhancing the Hong Kong Telecom MNO market appeal to multinational enterprises that require guaranteed service levels across borders. Medium-term gains stem from upselling roaming passes and embedded SIM profiles, which leverage existing network assets without proportionate incremental capex.
Restraints Impact Analysis*
| Restraint | (~) % Impact on CAGR Forecast | Geographic Relevance | Impact Timeline |
|---|---|---|---|
| SIM penetration saturation limits subscriber growth | -0.3% | Hong Kong SAR | Short term (≤ 2 years) |
| Fierce price competition from MVNOs erodes ARPU | -0.2% | Hong Kong SAR | Medium term (2-4 years) |
| Rising energy tariffs for dense 5G networks | -0.2% | Hong Kong SAR | Medium term (2-4 years) |
| Uncertainty on post-2028 spectrum refarming fees | -0.1% | Hong Kong SAR | Long term (≥ 4 years) |
| Source: Mordor Intelligence | |||
SIM Penetration Saturation Limits Subscriber Growth
Hong Kong records 27.8 million active SIM cards across a population of 7.5 million, equating to 326% penetration and effectively capping net-adds potential. High multiple-SIM ownership, driven by cross-border business needs and device-specific plans, shifts competition toward retention rather than acquisition. Academic studies highlight how entrenched vertical integration deters MVNO growth, further concentrating the subscriber base among incumbent operators. In the short term, subscriber churn dynamics supersede gross-add metrics, constraining topline expansion and forcing carriers to innovate around ARPU uplift rather than scale. Saturation also heightens sensitivity to service-quality lapses, placing reputational risk squarely on network availability during 5G densification.
Fierce Price Competition from MVNOs Erodes ARPU
Digital-only MVNO brands leverage lean cost structures and web-based self-care to undercut traditional tiered data plans, causing a 10% slide in postpaid ARPU at major operators such as SmarTone. Although MVNOs hold limited market share, their transparent pricing influences consumer expectations, especially among budget-conscious younger demographics. The pressure compels incumbents to maintain aggressive handset subsidies or bundle digital lifestyle services, strategies that compress margins even as network investment obligations climb. Medium-term ARPU stabilization hinges on mitigating the “race to the bottom” through differentiated content, loyalty ecosystems, and superior network experiences anchored on 5G-Advanced capabilities.
*Our forecasts treat driver/restraint impacts as directional, not additive. The impact forecasts reflect baseline growth, mix effects, and variable interactions.
Segment Analysis
### By Service Type: Data Dominance Drives Market Evolution
Data and Internet Services accounted for 57.63% of the Hong Kong Telecom MNO market size in 2025, underscoring the territory’s shift toward data-centric revenue sources. Enterprises deploy cloud-native applications that rely on dependable, high-throughput mobile links, while consumers embrace 4K streaming, cloud gaming, and AI-powered video assistants. The rising utilization of 5G fixed-wireless access for branch connectivity adds incremental volume, reinforcing the profit pool for data-tier upgrades. IoT and M2M Services, though contributing a smaller base today, are forecast to grow at 1.93% CAGR, benefiting from smart-city sensors, asset-tracking for port logistics, and industrial automation. Operators bundle SIM-management platforms and analytics dashboards, capturing end-to-end solution value beyond basic connectivity.
Data monetization relies on continuous investment in core and transport layers. Incumbents pursue network-API strategies to surface quality-of-service controls directly into enterprise workflows, aligning with GSMA Open Gateway standards. Voice Services, despite migration to VoLTE, still serve critical roles in financial compliance and emergency services, preserving a predictable if declining cash flow. Messaging Services, cannibalized by OTT apps, now emphasize A2P traffic for authentication and alerting. Complementary pay-TV and OTT content packages, amplified by addressable advertising, further cement Data and Internet Services as the fulcrum of revenue generation, ensuring the service-type mix will skew even more heavily toward data by 2031.


### By End User: Enterprise Growth Outpaces Consumer Maturity
The consumer segment represented 62.78% of the Hong Kong Telecom MNO market size in 2025, reflecting near-ubiquitous smartphone adoption and multi-SIM usage patterns. Yet incremental revenue comes largely from upselling 5G premium tiers, device insurance, and gaming add-ons rather than net subscriber additions. Operators use digital wallets, loyalty programs, and lifestyle bundles to sustain stickiness in a market where switching costs are low and price transparency high.
Enterprise services, displaying a 2.09% CAGR to 2031, capture budget allocations for private 5G deployments, managed security, and IoT analyticsHKT’s HKD 2.5 billion contract pipeline validates the rising appetite for integrated solutions that blend connectivity with cloud, AI, and cybersecurity controls. Banks, logistics operators, and utilities prioritize deterministic latency and data-residency compliance, attributes unavailable via public mobile broadband. The upshot is a widening revenue gap where enterprise ARPU dwarfs consumer equivalents, positioning enterprise services as the principal engine of margin expansion over the forecast horizon.
Geography Analysis
The entire Hong Kong Telecom MNO market operates within Hong Kong SAR’s 1108 square-kilometer footprint, enabling cost-efficient 5G densification that delivers blanket urban coverage at sub-6 GHz and millimeter-wave bands. Near-universal availability supports the territory’s role as an international finance and shipping hub, where milliseconds of latency translate into significant transactional value for algorithmic trading and real-time logistics. Regulatory oversight by OFCA assures predictable spectrum allocation, including a USD 280 million auction in late 2024 that replenished operator holdings in the 700 MHz, 3.5 GHz, and 4.9 GHz bands.
Hong Kong’s integration into the Greater Bay Area magnifies cross-boundary roaming volumes, with specialized data-sharing packages spanning Shenzhen, Guangzhou, and Macau corridors. China Mobile Hong Kong leverages its parent’s nationwide footprint to market seamless mainland roaming, while rivals forge reciprocal agreements to maintain competitive parity. The Hong Kong Telecom MNO market benefits from this unique trans-border traffic mix, capturing incremental revenue without proportional infrastructure duplication.
Cybersecurity legislation enacted in March 2025 classifies telecom networks as critical infrastructure, mandating robust resilience standards and third-party vendor audits. While compliance elevates opex, it concurrently opens advisory and managed-security revenue streams, particularly for enterprise customers subject to the same regulatory framework. Submarine-cable landing stations and hyperscale data centers in Tseung Kwan O reinforce Hong Kong’s status as a global connectivity junction, underpinning demand for high-capacity backhaul that feeds directly into the mobile core.
Regulatory Landscape
Hong Kong telecommunications is regulated by the Communications Authority (CA), an independent statutory body under the Communications Authority Ordinance (Cap. 616), with the Office of the Communications Authority (OFCA) acting as the executive arm to administer and enforce the Telecommunications Ordinance and related frameworks, alongside the Competition Ordinance. Policy direction and sector development are supported through the Commerce and Economic Development Bureau (CEDB), and the market remains liberalized with no foreign ownership restrictions in telecom licensing.
Spectrum policy and compliance milestones shape operator investment planning. OFCA continues to manage assignment and re-assignment processes, including the planned re-assignment of the 850/900 MHz bands in May 2026 and the 2.3 GHz band in March 2027, while administering performance bond requirements tied to 26/28 GHz spectrum rollout obligations (as of March 2026). In parallel, Hong Kong enacted cybersecurity legislation in March 2025 that classifies telecom networks as critical infrastructure, which increases resilience and audit requirements and raises governance expectations for MNO network operations and vendor management.
Competitive Landscape
Hong Kong’s four-player oligopoly, HKT, SmarTone, China Mobile Hong Kong, and Hutchison, commands the entire Hong Kong Telecom MNO market, each leveraging specific strengths to stave off commoditization. HKT exploits its fiber backhaul and Pay-TV ecosystem to cross-sell convergence bundles, while SmarTone emphasizes award-winning 5G network performance validated by independent tests. China Mobile Hong Kong’s parentage offers pricing leverage on mainland roaming, and Hutchison capitalizes on wholesale agreements and early 5G-Advanced trials to position itself as an innovation frontrunner.
Strategic transactions underline a pivot toward capital-light models: HKT divested a 40% stake in its fiber subsidiary for USD 870 million to fund 5G densification without ballooning leverage. China Mobile’s bid for HKBN indicates appetite for fixed-line assets that can backstop enterprise growth aspirations. Competitive differentiation increasingly hinges on software capabilities, network slicing orchestration, API exposure, and AI-driven customer-care chatbots, as pure connectivity pricing races to the bottom.
Operators also vie for ESG leadership given Hong Kong’s governmental green-net subsidies that reward energy-efficient base-station deployments. SmarTone has piloted solar-powered micro-cells, while HKT experiments with liquid-cooling in edge data centers. Such initiatives trim energy opex and demonstrate environmental stewardship-key considerations for institutional investors assessing long-term sustainability in the Hong Kong Telecom MNO market.
Hong Kong Telecom MNO Industry Leaders
China Mobile Hong Kong Co. Ltd.
Hong Kong Telecommunications (HKT) Ltd.
SmarTone Telecommunications Holdings Ltd.
3 Hong Kong
- *Disclaimer: Major Players sorted in no particular order

Market Opportunities and Future Outlook
Enterprise-led monetization is the clearest whitespace as Hong Kong operators increasingly bundle managed connectivity with edge, security, and IoT enablement for regulated and latency-sensitive sectors. HKT’s business performance supports this pattern, with 13% year-on-year revenue expansion in business supporting Chinese Mainland enterprises, consistent with Greater Bay Area-linked demand for cross-boundary connectivity and service-level assurance. Joint innovation also supports solution development cycles, including HKT and ASTRI setting up a Joint R&D Laboratory at the Hong Kong-Shenzhen Innovation and Technology Park to work on advanced telecom and digital capabilities.
Spectrum and network modernization programs further create room for differentiated 5G-Advanced services and new pricing constructs beyond basic data. Hong Kong assigned 300 MHz in the 6/7 GHz band on 31 March 2025 for a 15-year term to promote longer-horizon readiness, while OFCA planned an auction for 50 MHz in the 2.5/2.6 GHz band in late 2025 to expand capacity options. On rollout, the CA granted a 15-month extension to 26/28 GHz milestones for HKT, China Mobile Hong Kong, and SmarTone, with revised deadlines spanning July 2027 to July 2029, keeping mmWave use cases on an active, regulated timeline while allowing operators to align densification with enterprise demand and device ecosystem maturity.
Recent Industry Developments
- June 2026: China Mobile Hong Kong ceased its 2G mobile service on 23 June 2026, marking the last major operator in Hong Kong to shut down 2G. The shutdown accelerates legacy network retirement and supports spectrum refarming and operational simplification as operators prioritize 5G and 5G-Advanced capabilities.
- May 2026: Hutchison Telecommunications (Hong Kong) introduced three 5G monthly plans under the 3 Hong Kong and 3SUPREME brands that bundle add-on services such as cybersecurity, home insurance, and pet care. The packaging highlights how MNOs are using non-connectivity benefits to differentiate retail plans and defend ARPU in a highly competitive, saturated SIM market.
- April 2026: HKT signed an MoU with ASTRI to establish a Joint R&D Laboratory at the Hong Kong-Shenzhen Innovation and Technology Park. The lab strengthens local engineering and solution development for advanced network and digital applications, supporting a deeper enterprise pipeline around 5G evolution, AI, and IoT integration.


Research Methodology Framework and Report Scope
Market Definition and Coverage
For this report, the Hong Kong telecom market is measured as the value of operator and service-provider revenues generated from delivering connectivity and related telecom services to consumers and enterprises within Hong Kong.
Scope exclusions: We exclude handset and device hardware sales, and we also exclude pure IT managed services that sit outside telecom service delivery.
Segmentation Overview
- Overall Telecom Revenue and ARPU
- Service Type
- Voice Services
- Data and Internet Services
- Messaging Services
- IoT and M2M Services
- OTT and PayTV Services
- Other Services (VAS, Roaming and International Services, Enterprise and Wholesale Services, etc.)
- End-user
- Enterprises
- Consumer
Data Sources, Market Sizing, and Validation
Desk Research
Desk research was used to map the market structure and to anchor the model to official demand signals that can be checked year after year. We relied on public statistics and regulator publications to understand the number of subscriptions, penetration levels, coverage upgrades, and service-mix changes over time.
Key inputs were taken from non-paywalled sources such as OFCA telecom indicators, Communications Authority annual reports, Hong Kong government open data releases where relevant, and public spectrum and licensing information. We also reviewed company annual reports and investor presentations, plus reputed press releases for tariff changes and network rollout updates. For revenue and company context, we supplemented this with a paid subscription for company financials and news, and another paid tool for patent and technology tracking where it helped clarify 5G and fiber investment direction. These desk research sources are illustrative, and many other public documents were also used to collect, validate, and clarify the data.
Primary Interviews and Surveys
Primary discussions were used to test the desk-research picture against what is happening in pricing, mix shifts, and customer behavior across mobile, broadband, and value-added services. We spoke with a mix of operator-side and channel-side experts, as well as enterprise users, and then we re-checked any large gaps by following up with additional calls so the assumptions stayed consistent.
Distribution of primary research fieldwork respondents
| Company type | Respondent position | Region |
|---|---|---|
| Top tier: 31% | CXOs: 14% | |
| Mid tier: 52% | Functional/Unit leaders: 37% | |
| Smaller Players: 17% | Managers: 49% |
Market-Sizing & Forecasting
Sizing starts from a top-down build that reconstructs service revenues from the active subscription base, typical plan pricing, and observed mix by service type across Hong Kong. Results are then checked with selective bottom-up approximations, such as rolling up sampled operator revenue disclosures, channel checks on common plan levels, and subscriber based ASP x volume sanity tests.
Key inputs that matter in this market include total telecom services revenue indicators, mobile and fixed broadband subscription counts, post-paid versus pre-paid mix signals, 5G adoption and upgrade pace, fiber household penetration, and roaming recovery effects where applicable. Where public series did not split cleanly by service, we used primary feedback to allocate revenue shares using repeatable rules, and then we tested the split against operator disclosures and regulatory commentary.
For forecasting, we used scenario analysis supported by trend smoothing on key drivers, mainly 5G upgrade momentum, broadband speed tier migration, and pricing intensity in a high-penetration market. When a variable showed a one-off jump, the assumption was normalized through expert inputs before being carried into the forward years.
Data Validation & Update Cycle
Outputs are validated through multiple checks so the totals make sense against independent signals, such as penetration rates, subscription counts, and the direction of reported service revenues. Any sharp variance across years is reviewed, and if a driver cannot explain it clearly, the underlying assumption is revisited and respondents are re-contacted.
Before sign-off, the model goes through step-by-step analyst review, including unit consistency checks, currency conversion timing checks, and cross-service overlap removal where double counting can happen. Reports are refreshed annually, and interim updates are made when major events materially change pricing, licensing, or demand. Right before delivery, a final pass is completed so clients receive the latest updated view.
Mordor Intelligence's Hong Kong Telecom Market Size Compared With Other Published Estimates
Published market sizes can look far apart because each publisher draws the line differently on what counts as telecom revenue and how pricing and usage are projected in a mature, high-penetration market.
Handset sales revenue sits outside Mordor Intelligence's scope here, so the totals stay tied to service revenues like voice, data, broadband, messaging, and related telecom services, which are then checked against subscription and regulatory indicators. Some external estimates also use more aggressive assumptions on ARPU expansion from 5G upgrades or apply different currency timing, which can lift the stated market even when subscription growth is modest.
Benchmark comparison
| Source | Market Size | Gaps in Research Methodology |
|---|---|---|
| Mordor Intelligence | USD 10.73 B (2025) | |
| Industry Association A | USD 16.35 B (2024) | Often aligned to total sector revenue reporting and can include device sales and broader communications-related revenues, which increases the total versus a service-only view. The year reference also differs, which can affect comparability when FX and one-off roaming recovery effects are present. |
| Trade Journal B | USD 12.10 B (2025) | Typically published as a high-level run-rate using blended ARPU assumptions, with limited transparency on how enterprise versus consumer revenues are split and how OTT or pay-TV is treated, which can shift the final value up or down. |
The comparison shows that most of the spread comes from what is included in telecom revenue, plus base-year alignment and how ARPU progression is handled. By sticking to a clearly defined service revenue pool and validating it against subscriptions and regulator statistics, the final number stays easier to trace and repeat when the market is updated.


Key Questions Answered in the Report
What revenue does the Hong Kong Telecom MNO market generate in 2026?
The sector records USD 10.93 billion in 2026 and is projected to rise to USD 11.98 billion by 2031.
How fast is 5G subscriber migration in Hong Kong?
Operators report 46-54% of postpaid customers on 5G plans, underpinning higher-tier ARPU.
Which service type contributes most to carrier revenue?
Data and Internet Services hold 57.63% share, far outpacing voice and messaging segments.
Where are the strongest growth opportunities?
Enterprise private 5G, IoT connectivity, and network-API monetization show the highest CAGRs, with enterprise revenues growing 2.09% yearly to 2031.
How does Greater Bay Area integration affect operators?
Cross-border roaming bundles drive a 30% rebound in roaming revenue and open new enterprise service channels across mainland corridors.
Page last updated on:


