
Market Overview
| Study Period | 2020 - 2031 |
|---|---|
| Forecast Data Period | 2026 - 2031 |
| Base Year Market Size (2025) | USD 194.92 Billion |
| Market Size (2026) | USD 202.30 Billion |
| Market Size (2031) | USD 253.97 Billion |
| Growth Rate (2026 - 2031) | 4.65 % |
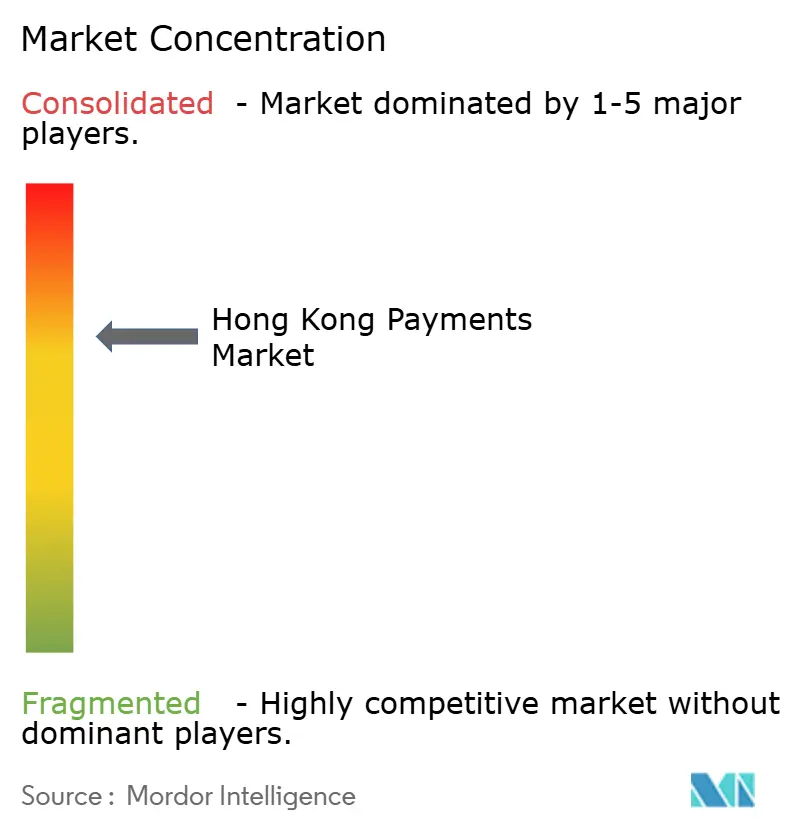
| Market Concentration | Medium |
Major Players *Disclaimer: Major Players sorted in no particular order Image © Mordor Intelligence. Reuse requires attribution under CC BY 4.0. | |
Hong Kong Payments Market Analysis by Mordor Intelligence
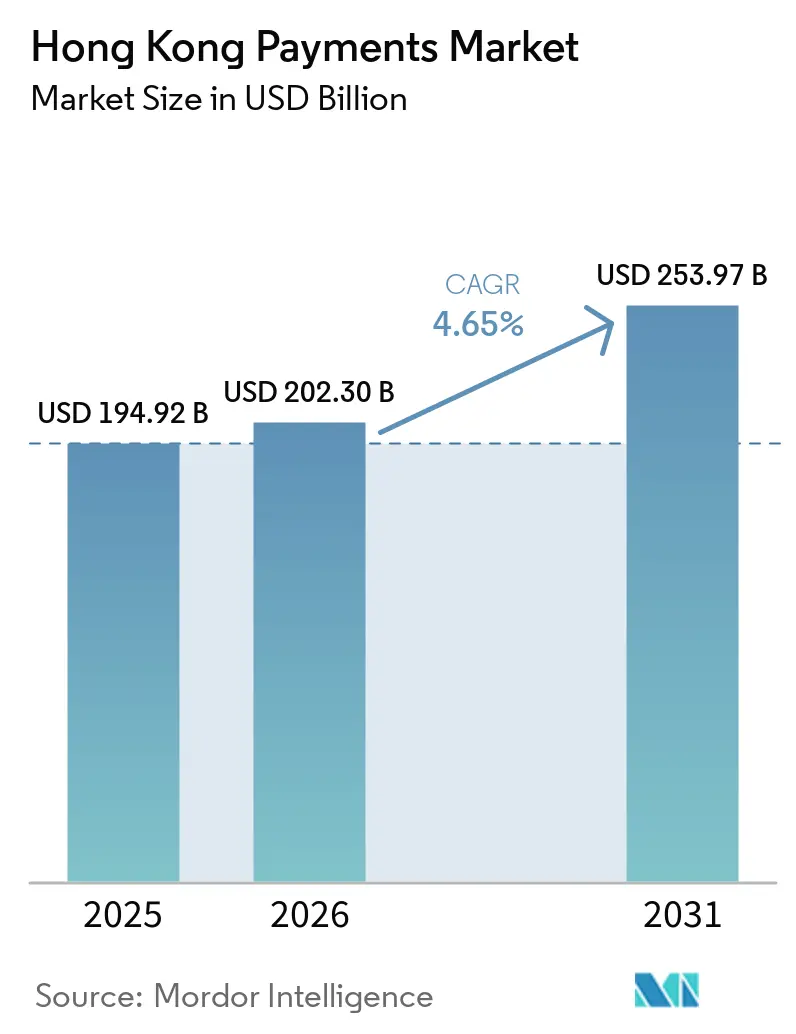
The Hong Kong Payments Market size is expected to increase from USD 194.92 billion in 2025 to USD 202.30 billion in 2026 and reach USD 253.97 billion by 2031, growing at a CAGR of 4.65% over 2026-2031. Strengthening real-time infrastructure through the Faster Payment System (FPS), surging cross-border wallet usage, and a rebound in tourism receipts are combining to sustain robust transaction value expansion in the Hong Kong payments market. Merchant appetite for unified QR acceptance and the growing profitability of virtual banks are stimulating competitive fee dynamics, while government pilots with the digital yuan position the city as a regional testbed for central-bank digital currency (CBDC) interoperability. Counterbalancing these positives, escalating cyber-fraud and persistently high interchange fees on international card rails are prompting service providers to funnel additional resources into security and merchant-acquiring innovation. Nevertheless, the underlying mix of stringent regulation, dense network effects, and geographic proximity to Mainland China reinforces long-term resilience for the Hong Kong payments market.
Key Report Takeaways
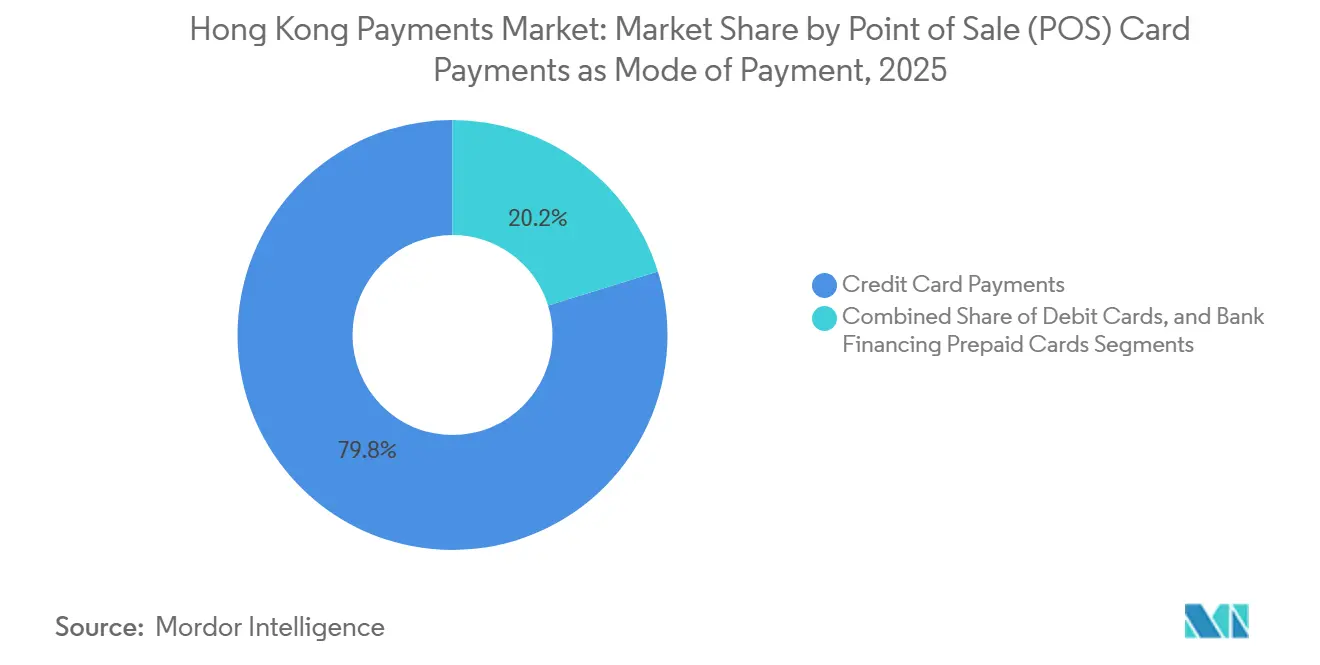
- By mode of payment, credit cards led with 79.77% share of the Point-of-Sale (POS) Card Payments segment of the Hong Kong payments market size in 2025, while Other Point-of-Sale (POS) category of the POS segment that includes Account-to-Account transfers are forecast to advance at a 7.18% CAGR through 2031.
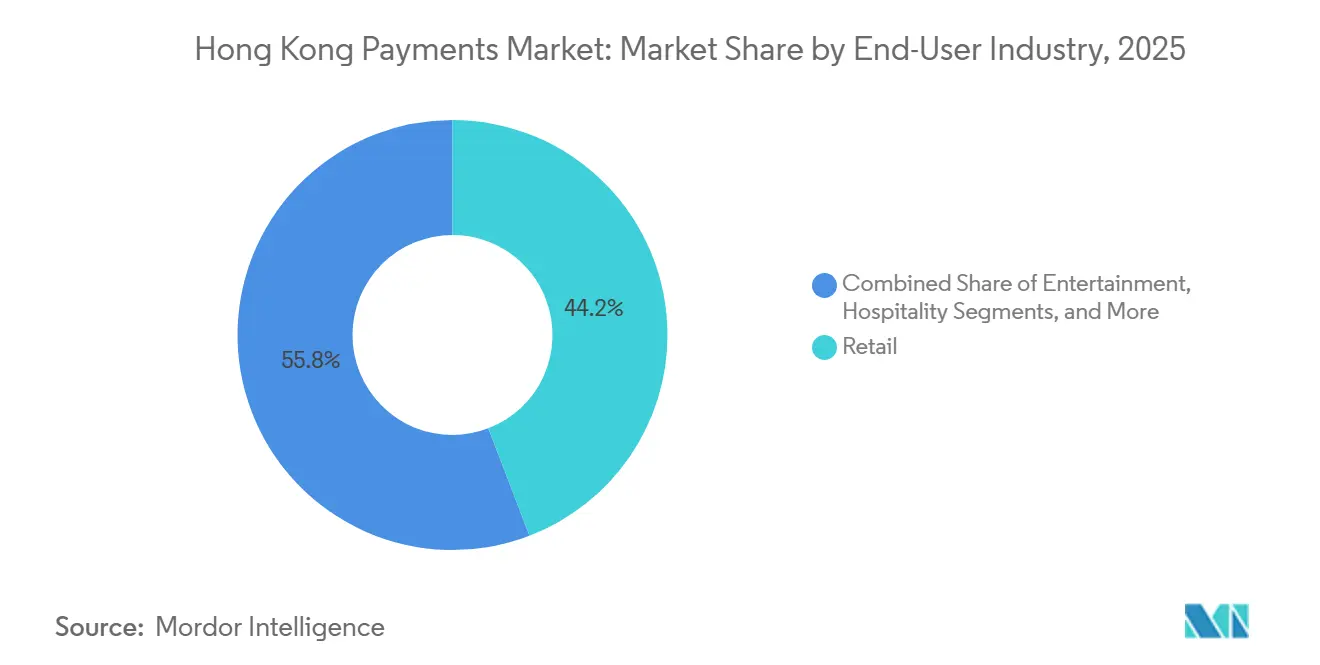
- By end-user industry, retail accounted for 44.17% share of the Hong Kong payments market size in 2025, whereas healthcare is projected to expand at a 5.79% CAGR between 2026-2031.
Note: Market size and forecast figures in this report are generated using Mordor Intelligence’s proprietary estimation framework, updated with the latest available data and insights as of 2026.
Hong Kong Payments Market Trends and Insights
Drivers Impact Analysis*
| Driver | (~) % Impact on CAGR Forecast | Geographic Relevance | Impact Timeline |
|---|---|---|---|
| Government-led Faster Payment System (FPS) enhancements | +1.2% | Hong Kong, with cross-border spillover to Mainland China | Medium term (2-4 years) |
| Rapid merchant adoption of QR-Code Unified Scheme | +0.8% | Hong Kong, with tourist acceptance benefits | Short term (≤ 2 years) |
| Cross-border e-CNY pilot integration with HK wallets | +0.7% | Hong Kong and Greater Bay Area | Medium term (2-4 years) |
| Rise of virtual banks targeting SME payment needs | +0.6% | Hong Kong, with potential regional expansion | Long term (≥ 4 years) |
| Growth of buy-now-pay-later (BNPL) embedded in wallets | +0.4% | Hong Kong, with cross-border e-commerce applications | Short term (≤ 2 years) |
| Shift of Mainland tourists to mobile wallets vs cash | +0.3% | Hong Kong, concentrated in retail and hospitality zones | Short term (≤ 2 years) |
| Source: Mordor Intelligence | |||
Government-led Faster Payment System Enhancements
Regular upgrades to FPS are catalyzing network effects in the Hong Kong payments market. Technical alignment with Mainland China’s Internet Banking Payment System, scheduled for mid-2025, will allow residents to move funds cross-border in real time using mobile numbers. Bilateral coordination completed in December 2024 already underpins multilateral QR linkages such as the PromptPay connection with Thailand, placing Hong Kong third worldwide for cross-border QR volumes in January 2024.[1] ISO 20022 migration and an Interbank Account Data Sharing platform launched in April 2025 extend real-time data utilities to participating banks, improving fraud analytics and onboarding speed.[2] Regulators insist that all enhancements meet strict resilience thresholds, ensuring that service uptime and liquidity management remain robust even as transaction velocity increases. Collectively, these factors elevate instant transfer adoption and widen revenue streams from value-added overlay services across the Hong Kong payments market.
Rapid Merchant Adoption of the Unified QR Code Scheme
A common QR standard is reshaping point-of-sale economics. Octopus integrated PayMe in December 2024, rolling out zero-fee acceptance across 27,000 taxis and converting cash-heavy routes to digital collection.[3] Alipay+ imported 14 foreign e-wallets in April 2024, letting visitors spend through home-country apps at the majority of outlets. Unified QR rails settle via FPS, giving merchants same-day liquidity and bypassing interchange fees that can top 1.5% on international cards. Small retailers particularly value the simplified hardware and the ability to toggle among wallets within a single code, driving swift penetration of cash-lite acceptance terminals. As participation grows, network externalities further entrench QR as a low-cost, high-reach front end in the Hong Kong payments market.
Cross-border e-CNY Pilot Integration with Hong Kong Wallets
Since May 2024, residents and tourists have been able to top up digital-yuan balances through FPS rails. Octopus extended the function to Tourist Mobile Octopus in February 2025; during Chinese New Year week, mainland visitors spent HKD 100 million using the feature, up 10% year over year. The pilot now covers healthcare vouchers redeemable in Nansha and Dongguan, reducing currency friction for elderly residents seeking cross-border medical services. Successful technical implementation illustrates CBDC-private wallet interoperability at commercial scale, reinforcing Hong Kong’s status as a laboratory for next-generation settlement. Banks and PSPs are already designing treasury tools and programmable payments tied to digital-yuan flows, broadening the addressable base of the Hong Kong payments market.
Rise of Virtual Banks Targeting SME Payment Needs
Virtual banks moved from scale to profitability when ZA Bank posted its first positive monthly net income in August 2024. These branch-less lenders bundle instant transfers, merchant acquiring, and BNPL credit within a single mobile interface, solving pain points for SMEs that previously juggled multiple providers. Fusion Bank, through WeBank technology, extended HKD 50 million in unsecured “GoGlobal” loans to GBA affiliates by end-2024. Integrated cash-flow analytics and straight-through settlement reduce working-capital gaps, while competitive fee structures intensify pricing pressure on legacy acquirers. As more SMEs migrate, virtual banks enlarge their share of transaction volumes in the Hong Kong payments market and reinforce digital-first behavior among suppliers and staff.
Restraints Impact Analysis*
| Restraint | (~) % Impact on CAGR Forecast | Geographic Relevance | Impact Timeline |
|---|---|---|---|
| High interchange fees on international card rails | -0.9% | Hong Kong, with spillover effects on cross-border commerce | Medium term (2-4 years) |
| Cyber-fraud surge undermining consumer trust | -1.1% | Hong Kong, with particular impact on elderly demographics | Short term (≤ 2 years) |
| Limited interoperability with Greater Bay Area wallets | -0.5% | Hong Kong and Greater Bay Area | Medium term (2-4 years) |
| Ageing population reluctant to adopt digital wallets | -0.3% | Hong Kong, concentrated in traditional retail sectors | Long term (≥ 4 years) |
| Source: Mordor Intelligence | |||
Cyber-fraud Surge Undermining Consumer Trust
Scam losses hit HKD 9 billion in 2023, equal to 0.3% of GDP, and phishing attacks on banks jumped 108% in 2024. Criminals now deploy AI-generated deepfakes, including a February 2024 video-conference spoof that siphoned HKD 200 million from a multinational. Surveys show 73% of local enterprises suffered cyber incidents in 2024, with 96% reporting phishing vectors. To stem damage, the Anti-Deception Alliance cut bank intercept times by 70%, but PSPs continue to raise security spend, squeezing operating margins. Persistent headlines risk nudging consumers back to cash, placing a drag on transaction growth in the Hong Kong payments market.
High Interchange Fees on International Card Rails
Unlike Australia or the EU, Hong Kong sets no interchange caps, leaving merchants to shoulder fees that often exceed 1.5% of ticket value. DBS polling in mid-2024 found that 31% of SMEs view long settlement cycles as a pain point tied to card acceptance. Some merchants restrict card usage or encourage alternative wallets, curbing revenue from higher-spending overseas customers. While American Express teamed with KPay in June 2024 to widen local acceptance, industry observers expect regulatory scrutiny if costs remain sticky. In the interim, expensive card rails weigh on overall margins, slightly tempering expansion of the Hong Kong payments market.
*Our forecasts treat driver/restraint impacts as directional, not additive. The impact forecasts reflect baseline growth, mix effects, and variable interactions.
Segment Analysis
By Mode of Payment: Credit Cards Dominate While A2A Gains Momentum
By Point-of-Sale (POS) Card Payments segment, credit cards generated 79.77% of the Hong Kong payments market share in 2025, underpinned by affluent consumer segments that prize rewards and installment flexibility. Other Point-of-Sale (POS) that includes Account-to-Account transfers, however, are projected to register a 7.18% CAGR to 2031, making them the fastest-expanding component of the Hong Kong payments market size. The rapid uptake stems from FPS’s 24/7 settlement, lower merchant fees, and straightforward onboarding for both individuals and corporates. Digital wallets straddle both rails, giving users a choice between stored value, linked debit, or FPS push-pay, thereby blurring historical mode distinctions and amplifying multi-rail transaction growth.
Debit cards hold steady due to payroll linkages and habitual ATM withdrawals, yet they increasingly serve as funding sources for wallets rather than direct point-of-sale instruments. Cash-on-delivery persists mainly for big-ticket e-commerce items where consumers want physical inspection before payment. Meanwhile, the September 2022 HKMA guidelines on BNPL transparency spurred platforms like livi PayLater to cap interest and embed credit checks, lifting consumer confidence. As integrated super-apps normalize cross-rail switching within a single checkout, the Hong Kong payments market gains both depth and diversity across payment modes.

By End-User Industry: Retail Leads While Healthcare Accelerates
Retail commanded 44.17% of the Hong Kong payments market size in 2025, buoyed by tourist inflows that spent HKD 100 million via Octopus during Lunar New Year 2025. Recovery in visitor arrivals compensates for lower per-capita spending, sustaining transaction frequency across department stores and duty-free outlets. Healthcare, on the other hand, is forecast to post a 5.79% CAGR, one of the quickest among verticals, following the March 2025 Hospital Authority fee reform that introduced tiered pricing and a HKD 10,000 annual cap on patient outlay. Hospitals and clinics now demand integrated bill-presentment, insurance adjudication, and cross-border voucher acceptance, opening white space for fintech-enabled healthcare PSPs.
Entertainment venues and hospitality providers leverage Alipay+ and WeChat Pay to cater to multi-wallet tourists, while professional-services firms embrace digital invoicing to expedite overseas receipts. Government agencies also digitize disbursements, though adoption trails the private sector due to legacy IT constraints. Over time, industry-specific wallet features such as medical installment plans and tax-deductible e-receipts will further segment solution design, yet all verticals collectively reinforce transaction velocity within the Hong Kong payments market.
Geography Analysis
Hong Kong’s compact urban footprint and Special Administrative Region status create payment flows that outsize its 1,114 km² land mass. FPS registered 14.95 million users by July 2024, double the working-age population, reflecting deep domestic penetration. At the same time, 85 million Hong Kong resident trips to Mainland China in the first ten months of 2024 underpin a steady back-and-forth corridor for remittances and consumer spend. The forthcoming mid-2025 FPS-IBPS bridge will allow instant renminbi transfers, a functionality absent in peer hubs like Singapore or Tokyo, strengthening the Hong Kong payments market’s cross-border appeal.
Mainland tourists increasingly tap wallets over cash; same-day visitor per-capita spend slid from HKD 2,400 in 2018 to HKD 1,300 in H1 2024, yet total electronic transactions rose thanks to user growth. Hong Kong’s linkage with Thailand’s PromptPay since December 2023 elevated the city to third globally for cross-border QR volume within a month. Such interconnections diversify corridor risk and embed the Hong Kong payments market inside a lattice of regional fast-payment systems.
Internally, Octopus boasts 98% household penetration and roughly 190,000 acceptance points, ensuring friction-less ubiquity even in wet-markets and minibuses. Virtual banks reach younger demographics: ZA Bank claims 25% Generation-Z penetration across its 800,000 customers. High smartphone density, mature 5G coverage, and bilingual interfaces further eliminate frictions that slow rollout in larger geographies. The result is a payments laboratory where new rails scale rapidly, reinforcing Hong Kong as a gateway node in wider Asia-Pacific commerce and cementing the geographic moat of the Hong Kong payments market.
Regulatory Landscape
Hong Kong payments are governed primarily under the Payment Systems and Stored Value Facilities Ordinance (PSSVFO), with the Hong Kong Monetary Authority (HKMA) overseeing designated retail payment systems and stored value facilities (SVF) operators. Regulatory attention has tightened around operational resilience and cyber risk for payment operators, including expectations that enhancements to real-time rails such as the Faster Payment System (FPS) maintain high availability and robust risk controls.
In 2026, critical-infrastructure cybersecurity obligations became more explicit for in-scope payment operators. The HKMA entered into an MoU (29 May 2026) with the Office of the Commissioner of Critical Infrastructure (Computer-system Security) to strengthen supervisory cooperation, and it followed with a Code of Practice (12 June 2026) under the Protection of Critical Infrastructures (Computer Systems) Ordinance for designated SVF licensees. Separately, government work to amend the Electronic Transactions Ordinance (Cap. 553) to adopt UNCITRAL MLETR, consulted in December 2025 with proposals for 2026, supports legally recognized digitization of B2B trade documents that can feed into payment and trade-finance workflows.
Value Chain Analysis
The Hong Kong payments value chain starts with funding sources (bank accounts, cards, and stored value), then moves through initiation layers (bank apps, wallets, QR acceptance, and online checkouts) into processing and clearing across rails such as FPS and card networks, before settling into beneficiary banks or SVF accounts. Governance and rule-setting sit with the HKMA for retail payment systems and SVF, while supporting enablers include identity and onboarding controls, fraud monitoring, and data infrastructure such as the Commercial Data Interchange (CDI), which links consented business data to financial services.
Downstream, merchant acquiring and acceptance are delivered by banks, payment gateways, and wallet ecosystems, with interoperability and data standards (for example, GS1 Hong Kong in trade-data contexts) acting as practical bottlenecks for SME digitization. The chain is increasingly linked to logistics and trade platforms where payment, data, and financing converge: in April 2025, the HKMA set up an Expert Panel for Project Cargox to digitize cargo data and integrate it with CDI by end-2025, and in November 2025, OCBC Hong Kong partnered with GS1 HK to launch a digital trade finance service for SMEs using ezTRADE data. On the digital-money side, the August 2025 stablecoin issuer regime and the HKMA Fintech Promotion Blueprint (February 2026) add regulated pathways for tokenisation and institutional digital money that can feed into payment acceptance and treasury workflows.
Competitive Landscape
Traditional majors such as HSBC and Bank of China (Hong Kong) still process the bulk of corporate volumes, but fee pressure and UX innovation are shifting transaction share toward fintechs. Eight licensed virtual banks exploit cloud-native cost structures; ZA Bank reached profitability in just five years, demonstrating viable economics at sub-HKD 1 billion revenue scale. Fintech-incumbent alliances crystallize this race: the March 2025 PingPong-Octopus deal opens Octopus’ 190,000 touchpoints to global merchants selling into Hong Kong, while leveraging PingPong’s cross-border e-commerce pipeline from China.
American Express’ June 2024 pact with KPay sought to offset lagging SME acceptance by tapping KPay’s point-of-sale footprint, yet interchange concerns still hamper card uptake. Meanwhile, the April 2025 Hong Kong Investment Corporation equity stake in WeLab underscores public-sector resolve to anchor advanced AI capability at home, with WeLab pledging to reskill all employees on AI tools by 2025. Regulatory policy continues to shape the field: HKMA’s October 2024 e-banking risk manual demands end-to-end encryption and continuous threat modeling, advantaging players already compliant with rigorous cybersecurity regimes.
Cross-border capabilities now define the moat. Providers integrating e-CNY, FPS, and third-country QR rails stand to capture accelerating tourist and SME corridors. Smaller PSPs specialize in niche verticals such as healthcare claims or logistics cash-on-delivery, carving defensible territory through domain expertise. Collectively, these dynamics render the Hong Kong payments market a moderately concentrated but fiercely innovative arena where scale economies coexist with specialization.
Hong Kong Payments Industry Leaders
-
The Bank of East Asia Limited (BEA)
-
Standard Chartered Bank (HK) Limited
-
The Hongkong and Shanghai Banking Corporation Limited
-
Bank of China (Hong Kong) Limited
-
Citibank (Hong Kong) Limited
- *Disclaimer: Major Players sorted in no particular order
Market Opportunities and Future Outlook
Cross-border real-time settlement and corridor expansion remain a core opportunity area, because they convert tourism and SME trade flows into lower-friction wallet, QR, and A2A volume. Market proof points in 2026 include Standard Chartered launching an FPS-based, real-time cross-border payment service in April 2026 for offshore financial institutions and paytech firms, and Payment Connect linking Hong Kong FPS with the Mainland Internet Banking Payment System (IBPS) for real-time, cross-boundary retail remittances. These efforts create room for PSPs and banks to package compliance, FX transparency, reconciliation, and merchant settlement into corridor-specific products, particularly where international card interchange costs remain a merchant pain point.
A second opportunity area is regulated digital money and tokenisation in mainstream settlement, grounded in HKMA programs and market infrastructure pilots rather than retail crypto use-cases. In June 2026, HKEX and the HKMA launched a joint pilot using e-HKD for advance margin payments in the After-Hours Trading derivatives market, and by 2026 the HKMA had shifted e-HKD prioritization toward wholesale payments, cross-border trade settlements, and the tokenisation ecosystem. This direction runs alongside the Fintech 2030 strategy (November 2025) and the Fintech Promotion Blueprint (February 2026). Digital trade finance is also moving deeper into payment-adjacent workflows, including HSBC launching TradeCash in June 2026 to digitize invoice-led working-capital drawdowns via HSBCnet, and the broader push to enable MLETR-aligned electronic trade documents that connect trade data to financing and payment execution.
Recent Industry Developments
- June 2026: HSBC launched TradeCash, a digital trade finance solution that enables customers to upload sales invoice data via HSBCnet to draw down financing digitally. The move strengthens invoice-to-liquidity workflows tied to payment and settlement cycles, reinforcing banks' role in embedded working-capital services for merchants and corporates operating in Hong Kong.
- June 2026: HKEX and HKMA launched a joint pilot using e-HKD for advance margin payments in the After-Hours Trading derivatives market. The initiative shows the push to tokenised and wholesale settlement mechanisms for market hours and beyond.
- May 2026: Standard Chartered supported SOLOWIN HOLDINGS in an institutional crypto asset custody offering in Hong Kong. The development expands regulated digital asset servicing and custody capabilities for institutions within the HK market.
Research Methodology Framework and Report Scope
Market Definition and Coverage
This market covers the value of payments made in Hong Kong across point-of-sale and online sale channels, measured by transaction value flowing through common instruments like cards, account-to-account transfers, and digital wallets.
Scope exclusions: It excludes adjacent financial services revenues (such as lending interest, insurance premiums, and pure brokerage fees) that are not payment transaction value.
Segmentation Overview
- By Mode of Payment
- Point of Sale
- Debit Card Payments
- Credit Card Payments
- Account-to-Account (A2A) Payments
- Digital Wallet
- Cash
- Other Point-of-Sale Payment Mode
- Online Sale
- Debit Card Payments
- Credit Card Payments
- Account-to-Account (A2A) Payments
- Digital Wallet
- Cash-on-Delivery
- Other Online Sales Payment Mode
- Point of Sale
- By End-User Industry
- Retail
- Entertainment
- Hospitality
- Healthcare
- Other End-User Industries
Data Sources, Market Sizing, and Validation
Desk Research
Desk work starts by aligning Hong Kong payment volumes and value series with public financial stability and payments system reporting. We rely on official and widely used sources such as Hong Kong Monetary Authority releases, BIS payment statistics, IMF data for macro indicators, World Bank indicators for digital access context, and UN Comtrade for trade signals that can support cross-border spending directionally.
Next, we bring in supporting evidence from annual reports and investor presentations of payment ecosystem participants, along with credible press and association publications on QR acceptance and merchant digitization. Where needed, we also use paid company financials and intelligence subscriptions, plus a news and financials subscription, to standardize company-level context and track notable events that can shift the payment mix. The desk sources listed here are illustrative only, and many other public documents were also used to collect data, validate assumptions, and clarify open questions.
Primary Interviews and Surveys
Primary work was used to validate instrument mix and channel behavior, especially where Hong Kong public statistics lag the market. We spoke with a balanced set of stakeholders such as merchants, payment facilitators, acquirers, fintech operators, and banking teams, and then checked assumptions on fees, adoption timing, and cross-border usage patterns against what respondents observe in day-to-day operations.
Distribution of primary research fieldwork respondents
| Company type | Respondent position |
|---|---|
| Top tier: 31% | CXOs: 14% |
| Mid tier: 53% | Functional/Unit leaders: 26% |
| Smaller Players: 16% | Managers: 60% |
Market-Sizing & Forecasting
Sizing starts from a top-down build where national payment system signals and Hong Kong payment instrument reporting are used to reconstruct total transaction value across POS and online sale channels. Once the total is formed, it is split by mode of payment using observed mix indicators (cards versus A2A versus wallets) and then cross checked against end use patterns where retail and travel linked spending typically shows clearer seasonality.
To keep totals realistic, we corroborate with selective bottom-up checks, such as sampled merchant acceptance patterns, channel checks on online share, and simple value logic using estimated transaction counts times typical ticket sizes in a few anchor categories. Key inputs include growth in card and wallet acceptance points, the share of real time transfers in everyday payments, cross border visitor spending recovery, e-commerce penetration, and changes in fraud and dispute friction that can slow adoption. Forecasts are generated using scenario analysis, pairing macro and travel scenarios with expert views on payment mix shifts, and then selecting the final path after consistency checks across variables. When bottom-up signals are missing for a niche mode, the gap is handled through conservative share carry-forward and then rebalanced to match the top-down total.
Data Validation & Update Cycle
Outputs are checked through multiple passes so outliers are caught early, and assumptions stay tied to observable signals. We compare modeled totals against independent indicators like major system trends, macro consumption direction, and channel shifts, and then investigate variances before final sign off.
The model is reviewed by another analyst for logic, year over year movement, and unit consistency, followed by a final pass close to publication so late breaking changes are reflected. Reports are refreshed annually, and interim updates are triggered when a material event changes payment behavior, regulation, or economic activity in a way that can shift transaction value meaningfully.
Mordor Intelligence's Hong Kong Payments Market Size Versus Other Published Estimates
Published numbers for Hong Kong payments do not always match because sources may count different flows and then report them under similar labels. Differences usually come from what is treated as a payment versus a financial service, how cross border activity is counted, and whether values are reported as total transaction value or as narrower processed volume.
Interchange, merchant discount fees, and gateway revenue are sometimes mixed into the same total in other publications, and that can inflate value if the reader expects pure transaction value. Cross border wallet spending and tourist driven POS value can also be timed differently by year, and currency conversion choices (spot versus average year rates) can add another layer of spread.
Benchmark comparison
| Source | Market Size | Gaps in Research Methodology |
|---|---|---|
| Mordor Intelligence | USD 154.44 B (2025) | |
| Industry Association A | USD 168.90 B (2025) | Often blends payment transaction value with selected related charges (for example, merchant service fees) and may not separate POS versus online consistently, which can push the total above a pure value of payments view. |
| Global Consultancy B | USD 142.30 B (2025) | May exclude parts of A2A and wallet based transfers that sit outside card network reporting, and it can lean on bank card spend as a proxy, which can understate markets with rising real time rails. |
Interchange and processing fee revenue sit outside Mordor Intelligence's scope for this market, which is why the benchmark in the table can be lower than estimates that mix value and revenue in one figure. At the same time, the spread against lower figures is often explained by whether A2A and wallet flows are fully captured and whether cross border timing is normalized. With clear definitions, repeatable inputs, and checks against independent signals, the estimate stays practical to replicate and easier for buyers to interpret year to year.
Key Questions Answered in the Report
How large is the Hong Kong payments market in 2026?
The Hong Kong payments market size is USD 202.3 billion in 2026 and is projected to reach USD 253.97 billion by 2031.
What is driving real-time Other Point -of Sale (POS) Segment growth?
FPS upgrades, lower merchant fees, and instant settlement underpin the 7.18% CAGR forecast for the Other Point -of Sale (POS) Segment that includes A2A transactions.
Which industry vertical is expanding fastest in electronic payments?
Hospitality and Travel leads with a 7.91% CAGR as fee reforms and cross-border voucher schemes digitize billing and ease transactions process
How are virtual banks affecting the competitive landscape?
Profit-making virtual banks bundle payments, lending, and BNPL, pressuring incumbent fee structures while servicing SME gaps.
What are the biggest risks facing digital payments in Hong Kong?
Cyber-fraud, especially AI-driven phishing and deepfakes, and high international card interchange fees remain key headwinds.