
Market Overview
| Study Period | 2020 - 2031 |
|---|---|
| Forecast Data Period | 2026 - 2031 |
| Base Year Market Size (2025) | USD 26.15 Billion |
| Market Size (2026) | USD 28.47 Billion |
| Market Size (2031) | USD 41.62 Billion |
| Growth Rate (2026 - 2031) | 7.89 % |
| Market Concentration | Medium |
Major Players *Disclaimer: Major Players sorted in no particular order Image © Mordor Intelligence. Reuse requires attribution under CC BY 4.0. | |
Hong Kong E-commerce Market Analysis by Mordor Intelligence
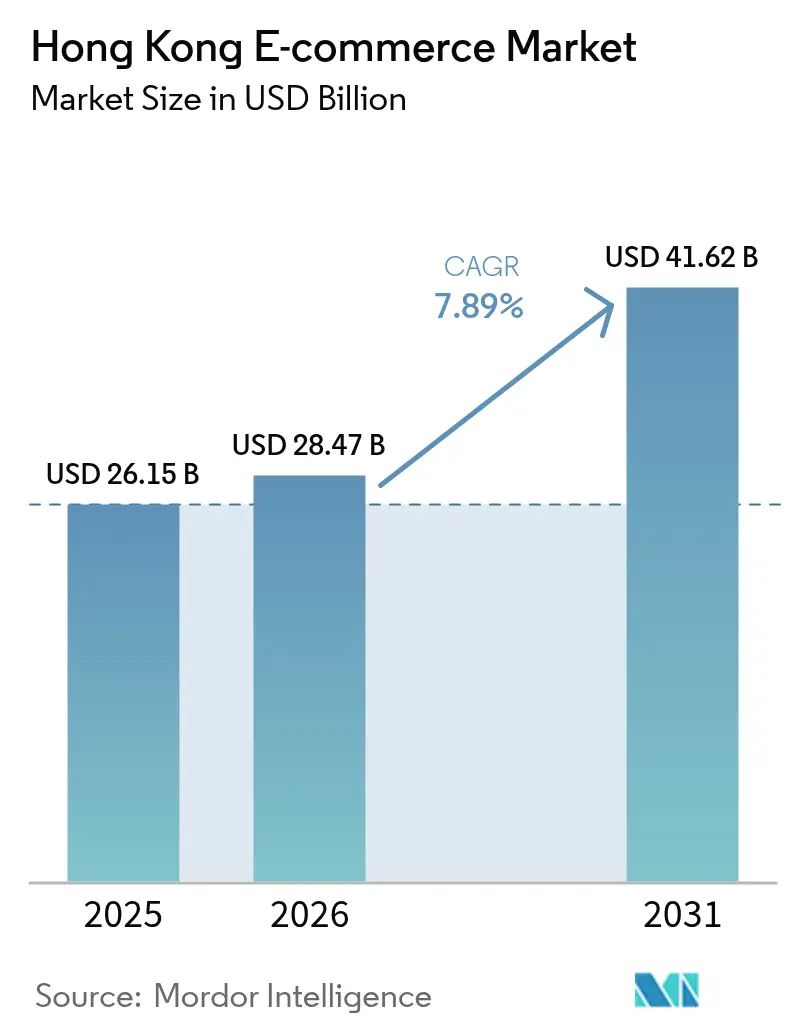
The Hong Kong e-commerce market size expanded from USD 26.15 billion in 2025 to USD 28.47 billion in 2026 and is projected to reach USD 41.62 billion by 2031, advancing at a 7.89% CAGR between 2026 and 2031. The territory’s one-click payments, 99% smartphone penetration, and positioning inside the Greater Bay Area logistics corridor keep demand for frictionless cross-border shopping elevated. Platforms differentiate through same-day delivery, live-stream checkouts and loyalty cashback instead of price alone, because customer acquisition costs climbed 22% year on year in 2025. Rapid digital-wallet adoption and government subsidies that reimbursed up to 75% of SME digitalization spend until mid-2026 further widened the online sales funnel. Competitive intensity remains high as mainland giants, homegrown champions and global entrants all chase Hong Kong’s affluent shoppers, while sky-high warehouse rents in Kwai Chung and Tsuen Wan compress fulfillment margins.
Key Report Takeaways
- By business model, business-to-consumer transactions held 78.92% of the Hong Kong e-commerce market share in 2025, whereas B2B procurement is growing fastest at an 8.03% CAGR through 2031.
- By product category, fashion and apparel led with 23.59% revenue share in 2025; food and beverages is forecast to expand at an 8.31% CAGR to 2031.
- By device type, smartphones commanded 69.67% of Hong Kong e-commerce market size in 2025 and are advancing at a 7.97% CAGR through 2031.
- By payment method, credit and debit cards retained 43.92% share of Hong Kong e-commerce market size in 2025, while digital wallets record the fastest projected CAGR at 8.28% through 2031.
Note: Market size and forecast figures in this report are generated using Mordor Intelligence’s proprietary estimation framework, updated with the latest available data and insights as of 2026.
Hong Kong E-commerce Market Trends and Insights
Drivers Impact Analysis*
| Driver | (~) % Impact on CAGR Forecast | Geographic Relevance | Impact Timeline |
|---|---|---|---|
| Growth of Mobile-First Shoppers Fueled by 5G Rollout and 99% Smartphone Penetration | +2.1% | Hong Kong SAR, Spillover to Greater Bay Area | Short Term (≤ 2 Years) |
| Accelerated Cross-Border Fulfillment via Greater Bay Area Logistics Corridors | +1.8% | Hong Kong SAR, Guangdong Province, Macao SAR | Medium Term (2-4 Years) |
| Government Digital Funding Schemes (D-Biz, E-Commerce Easy) Boosting SME Online Migration | +1.5% | Hong Kong SAR, Kowloon and New Territories SME Clusters | Short Term (≤ 2 Years) |
| High Credit Card and E-Wallet Usage Enabling Frictionless Checkout | +1.3% | Hong Kong SAR | Medium Term (2-4 Years) |
| Rising Affluence of Gen Z and Mainland Tourist Spend on Hong Kong Platforms | +1.0% | Hong Kong SAR, Mainland China Visitor Segments | Long Term (≥ 4 Years) |
| Live-Streaming and Social-Commerce Monetization Partnerships with KOLs | +0.9% | Hong Kong SAR, Cross-Border to Guangdong | Medium Term (2-4 Years) |
| Source: Mordor Intelligence | |||
Growth of Mobile-First Shoppers Fueled by 5G Rollout and 99% Smartphone Penetration
By late 2025 the territory’s four network operators had deployed more than 20,000 5G base stations, achieving greater than 90% coverage and sub-50 millisecond latency that supports augmented-reality try-ons and instant stock checks during checkout. Platforms embedded live-streaming inside their apps, and an academic survey found that 83.6% of consumers aged 18-30 completed fashion purchases exclusively on smartphones while desktop conversions fell below 12%. Brands optimizing vertical video, one-tap payments and biometric login capture disproportionate Gen Z wallet share. As data harvesting intensifies, compliance with the Personal Data (Privacy) Ordinance shapes UI design and consent flows.
Accelerated Cross-Border Fulfillment via Greater Bay Area Logistics Corridors
Customs streamlining in 2024-2025 cut parcel clearance between Hong Kong and Shenzhen from 48 hours to under six, enabling same-day delivery for bonded goods stored across the border.[1] JD.com’s 2024 purchase of Kai Bo illustrates how mainland platforms position Hong Kong warehouses as export gateways for Southeast Asia. Local sellers still face asymmetric barriers entering mainland marketplaces, making logistics integration a one-way competitive accelerant. The Trade Single Window, which digitized 95% of declarations by 2025, sustains speed advantages though dual certification for cosmetics and infant formula remains a friction point TSW.HK.
Government Digital Funding Schemes Boosting SME Online Migration
Between 2020 and 2025 the Innovation and Technology Bureau disbursed over HKD 5 billion (USD 641 million) to cover up to 75% of storefront, gateway and digital-ads spend for qualifying SMEs.[2] A Hong Kong Productivity Council review found funded merchants logged 34% higher online revenue growth than non-participants, but 28% later abandoned e-commerce once subsidies lapsed.[3] The programs sunset in mid-2026, placing sustained performance pressure on retailers now confronting higher paid-ads pricing and complex last-mile orchestration.
High Credit Card and E-Wallet Usage Enabling Frictionless Checkout
The Faster Payment System processed 4.2 billion transactions in 2025, allowing instant settlement across cards and wallets and eliminating multi-day clearing delays.[4] While cards maintained a 43.92% share, wallet transactions are climbing fastest as QR codes, BNPL installments and biometric authentication lower checkout friction for everyday purchases. Platforms that support multi-rail payments minimize abandonment during promotion spikes, yet must also meet two-factor mandates on orders above HKD 500 (USD 64).
Restraints Impact Analysis*
| Restraint | (~) % Impact on CAGR Forecast | Geographic Relevance | Impact Timeline |
|---|---|---|---|
| Sky-High Warehouse Rents and Last-Mile Labor Costs Compressing Margins | -1.4% | Hong Kong SAR, Kwai Chung and Tsuen Wan | Medium Term (2-4 Years) |
| Saturation of Marketplace Advertising Driving Customer Acquisition Costs | -1.1% | Hong Kong SAR | Short Term (≤ 2 Years) |
| Persistent Consumer Concerns over Product Authenticity on C2C Channels | -0.7% | Hong Kong SAR, Cross-Border C2C Platforms | Medium Term (2-4 Years) |
| Talent Shortage in Data and Growth-Hacking Roles for E-Commerce Operations | -0.5% | Hong Kong SAR | Long Term (≥ 4 Years) |
| Source: Mordor Intelligence | |||
Sky-High Warehouse Rents and Last-Mile Labor Costs Compressing Margins
Average warehouse rents in Kwai Chung and Tsuen Wan reached HKD 18 per square foot (USD 2.30) in 2025 after a 14% annual jump, ranking among the world’s steepest logistics overheads.[5] Platforms choosing local storage secure same-day delivery but sacrifice margin; shifting stock to Shenzhen cuts rent in half yet extends delivery windows to 24-48 hours, eroding competitiveness against HKTVmall’s local inventory. Rising minimum wages, coupled with courier shortages during Singles’ Day and Lunar New Year, pushed spot pay to HKD 80-100 an hour (USD 10.26-12.82), forcing experimentation with lockers and pickup points that only 25% of shoppers currently accept.
Saturation of Marketplace Advertising Driving Customer Acquisition Costs
Cost-per-click on Meta, Google and local sponsored listings climbed 22% in 2025 because nearly every Hong Kong e-commerce platform targets the same smartphone-savvy, urban demographic. KPMG benchmarking shows marketing expense swelling to 18-24% of revenue, roughly double the Southeast Asian median. As paid reach plateaus, platforms increasingly adopt marketing technology through owned content, live shows, KOL tie-ins, and gamified loyalty programs, while mainland players exploit WeChat Mini-Programs to sidestep bidding wars altogether.
*Our forecasts treat driver/restraint impacts as directional, not additive. The impact forecasts reflect baseline growth, mix effects, and variable interactions.
Segment Analysis
By Business Model: B2B Procurement Digitization Outpaces Retail Growth
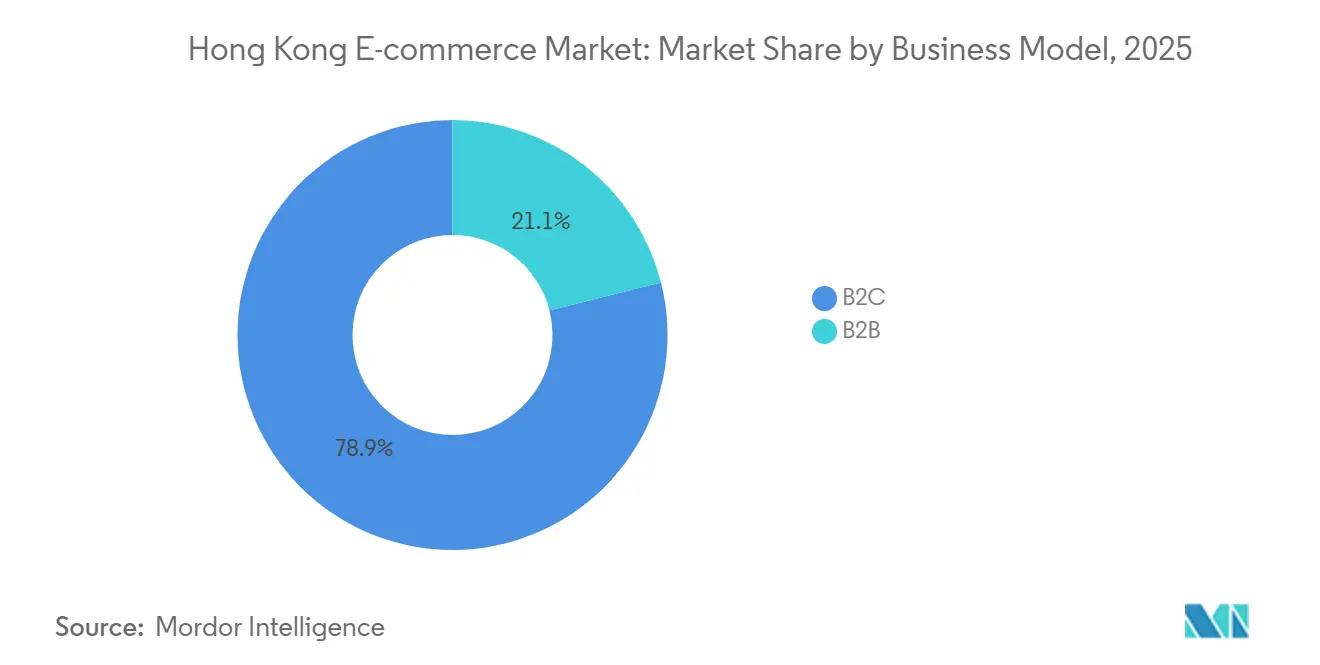
Business-to-consumer transactions captured 78.92% of Hong Kong e-commerce market share in 2025, underscoring the territory’s consumer-led DNA. Still, B2B platforms are forecast to expand at an 8.03% CAGR through 2031, nearly matching overall Hong Kong e-commerce market size growth and reflecting procurement digitalization across logistics, food-service and construction verticals. Lower customer-acquisition spend, larger basket sizes and early-payment discounts make B2B economics attractive, particularly for suppliers feeding Kowloon’s restaurant clusters where next-day replenishment beats traditional wet-market visits.
B2C momentum is slowing as urban penetration nears saturation, prompting retention tactics such as subscription clubs and AI-based personalization instead of raw user acquisition. A 2025 behavioral study recorded 37% higher price sensitivity online versus in-store, hinting that future B2C wins hinge on perceived value rather than speed alone. Platforms unable to bundle content, payments and logistics into sticky ecosystems risk wallet share erosion as shoppers chase promotions across multiple apps.
By Device Type: Smartphones Cement Transaction Dominance
Smartphones generated 69.67% of 2025 transaction value and are projected to rise at a 7.97% CAGR, preserving the largest slice of Hong Kong e-commerce market size this decade. AR try-ons, live-stream flash sales and thumb-friendly checkout make the handset the primary storefront for fashion, cosmetics and impulse categories. Desktop shopping lingers for research-heavy electronics or furniture orders, yet its share keeps sliding as mobile pages adopt vertical scrolling and expanded specs tabs.
Platforms that overlook mobile load-time, vertical video and one-tap biometric pay face immediate user churn. Other screens, smart TVs, voice assistants, remain niche because Cantonese voice commerce and local-language skills lag consumer expectations. Surveys show only 28% trust unmanned AI recommendations, so firms mix chatbots with live-agent escalation while gradually improving conversational accuracy.
By Payment Method: Digital Wallets Narrow The Card Lead
Credit and debit cards continued to hold 43.92% of transaction value in 2025, buoyed by reward points and longstanding merchant acceptance, yet digital wallets are scaling at an 8.28% CAGR through 2031. The Faster Payment System’s real-time rails, QR adoption and wallet-linked BNPL plans entice younger shoppers for purchases above HKD 1,000 (USD 128). Cards remain dominant for larger-ticket buys because airline-mile programs retain aspirational pull, but wallet share continues to rise in everyday categories where speed trumps perks.
BNPL adoption shows sharp generation gaps: 34% of 18-29-year-olds used installments in 2025 versus 11% of shoppers aged 40-plus. Bank transfers and cash on delivery are fading to single-digit relevance as two-factor mandates and fraud controls tighten. Merchants offering three or more payment types register higher conversion, and Buy-Now-Pay-Later schemes gain traction for mid-priced electronics. These options broaden the Hong Kong e-commerce market and mitigate single-provider risk. The Hong Kong e-commerce industry is therefore set to showcase one of Asia’s most plural payment portfolios by 2031.
By Product Category: Online Groceries Race Ahead of Fashion
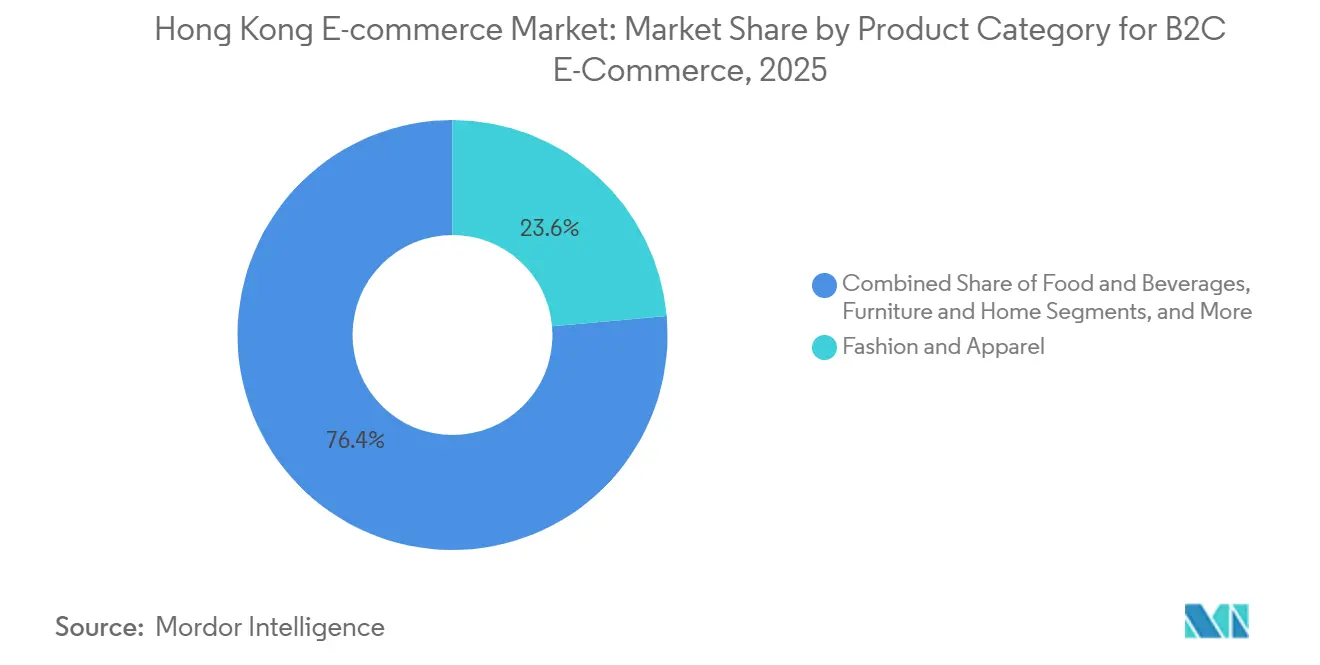
Fashion and apparel delivered a 23.59% revenue slice in 2025, making it the single biggest Hong Kong e-commerce market segment because cross-border Taobao listings dwarf local shop assortments. Yet food and beverages will post the fastest 8.31% CAGR into 2031, powered by on-demand grocery apps, restaurant aggregators and expatriate appetite for imported snacks. The city’s high-density living supports 30-minute delivery zones, and aging households prefer online grocery baskets over wet markets.
Beauty, consumer electronics and home furnishings contribute mid-single-digit shares. Beauty gains from live-stream tutorials and KOL product drops, with case studies showing eight-minute average view times. Electronics growth is softer because instant in-store pickup still satisfies tactile inspection needs, while heavy furniture lags under logistics costs and narrow high-rise corridors. AR room planners gradually erode this barrier, but conversion remains lower than light-weight categories.

Geography Analysis
Hong Kong operates simultaneously as a self-contained 7.5-million-resident market and as the southern anchor of the 86-million-person Greater Bay Area. Customs simplification cut parcel clearance below six hours, letting Shenzhen warehouses fulfill Hong Kong orders same day while using the city’s free-port status to re-export to Southeast Asia. The flow is asymmetric; mainland sellers enter Hong Kong with ease, yet local platforms struggle behind mainland firewalls.
Rule of law, IP safeguards, a freely convertible currency and bilingual skills let global brands pilot Asia-Pacific e-commerce strategies in Hong Kong before scaling regionally. The Trade Single Window, handling 95% of declarations electronically, accelerates cross-border shipping for Amazon and niche DTC labels. However, the city’s small population caps absolute Hong Kong e-commerce market size, prompting focus on high-margin verticals such as luxury beauty and premium electronics that offset warehouse rents.
Mainland tourist spending bounced back to pre-pandemic levels in 2025, accounting for 18% of total retail sales, with an increasing share transacted online via pre-order for hotel or cross-border delivery. Hence platforms must offer both Cantonese service and simplified-Chinese content plus Alipay and WeChat Pay integration. This hybrid B2C-cum-export profile distinguishes Hong Kong from Singapore, whose platforms serve domestic shoppers almost exclusively.
Regulatory Landscape
Hong Kong e-commerce runs under a well-established digital-trade legal framework led by the Electronic Transactions Ordinance (Cap. 553) for electronic records and signatures. In 2026, government work is underway to draft amendments that would incorporate concepts from the UNCITRAL Model Law on Electronic Transferable Records (MLETR) for digitizing B2B trade documents. Cross-border parcel flows are also governed by customs compliance requirements, including electronic import and export declarations lodged within 14 days, with the Customs and Excise Department applying risk-based controls and coordinating more closely with non-local cross-border e-commerce platforms to strengthen training on prohibited or controlled items.
On the payments side and in areas adjacent to digital-asset commerce, regulation is tightening. The Hong Kong Monetary Authority began supervising a regulatory regime for fiat-referenced stablecoin issuers from August 1, 2025, while the Securities and Futures Commission maintains licensing requirements for Virtual Asset Trading Platforms, with additional VA dealing and custodian licensing regimes moving forward after consultation conclusions published in December 2025. Consumer protection discussions also extend to e-commerce-adjacent prepaid models, with the Commerce and Economic Development Bureau running 2026 consultation work on statutory cooling-off periods and contract-duration limits for certain pre-paid consumer contracts in services such as beauty and fitness, sharpening scrutiny on selling practices and contract terms that can intersect with online-to-offline commerce.
Value Chain Analysis
Hong Kong e-commerce value creation begins with merchant sourcing, including local brands, cross-border sellers, and DTC operators. This is followed by storefront enablement through marketplaces and SaaS storefront builders, then payments, order management, and fulfillment. Payment orchestration benefits from widely used card acceptance and e-wallet rails, while cross-border trade digitization programs, including the Trade Single Window, reduce administrative friction for shipments moving through Hong Kong as a free-port gateway.
Fulfillment and distribution then determine both margins and service differentiation. Operators manage inventory positioning through Hong Kong warehouses versus Shenzhen or other Greater Bay Area bonded storage, plan line-haul into the territory, and compete on last-mile delivery via couriers, lockers, and pickup points. Ecosystem upgrades have been visible as well: Hong Kong International Airport commissioned its three-runway system in November 2024, lifting annual cargo capacity to 10 million tonnes, while logistics players have invested in security and automation, including Cainiao's Hong Kong Smart Freight Center achieving TAPA FSR A-level certification in July 2025 and integrating RFID technology to improve processing efficiency. Contract logistics, WMS providers, and customs brokerage complete the chain, with a planned mid-2026 batch rollout of Trade Single Window Phase 3 services strengthening document and clearance digitization for high-frequency e-commerce parcels.
Competitive Landscape
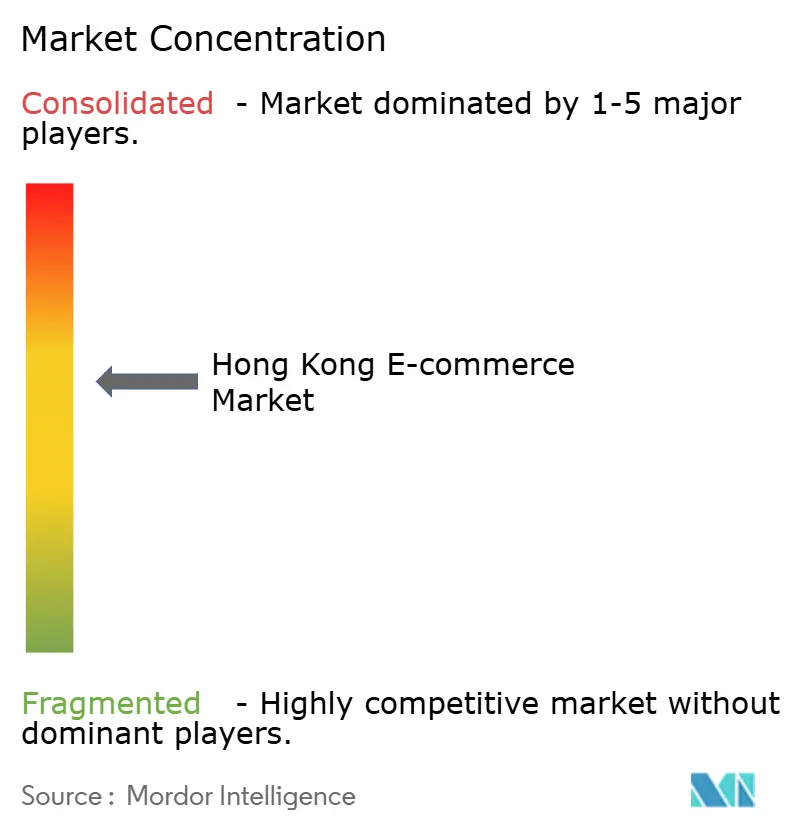
No single operator dominates the Hong Kong e-commerce market; HKTVmall leads local platforms with an estimated 12-15% of B2C revenue in 2025 while Taobao, Tmall and JD.com collectively control roughly 35-40% through cross-border sales. Amazon, Zalora, Ztore, Shopline-powered independents and niche C2C markets divide the remainder. Shoppers demonstrate fluid platform loyalty, chasing coupons and delivery promises rather than committing to one ecosystem.
Three strategic levers matter. First, inventory breadth: Taobao scales through long-tail listings and low prices, whereas HKTVmall curates trusted local brands to combat counterfeit fears. Second, fulfillment speed: HKTVmall’s Hong Kong warehouses enable same-day dispatch, but JD.com’s 2025 Kai Bo acquisition shaved its Shenzhen-to-Hong Kong transit to one day. Third, payment flexibility: all major sites accept cards, Alipay HK, WeChat Pay HK and Tap and Go, yet only some integrate BNPL.
White-space still exists. B2B procurement portals face minimal competition from entrenched wholesale channels, live-stream monetization remains nascent versus mainland standards, and bonded-warehouse logistics can further cut cost per parcel. New entrants such as Shopline and Boutir attract SMEs by charging lower commissions and granting storefront control, powering roughly 8-10% of merchant onboarding in 2025. Technology arms races continue, with Alibaba’s Cainiao filing blockchain provenance patents to verify product authenticity and HKTVmall rolling out AI sortation robots to trim last-mile cost.
Hong Kong E-commerce Industry Leaders
-
JD.com, Inc.
-
Alibaba Group Holding Limited
-
Hong Kong Technology Venture Company Limited (HKTVmall)
-
WeChat Pay Hong Kong Limited
-
Amazon.com, Inc.
- *Disclaimer: Major Players sorted in no particular order
Market Opportunities and Future Outlook
B2B digital trade documentation is a specific whitespace that ties to regulator and government actions rather than consumer adoption alone. The Commerce and Economic Development Bureau published a consultation paper in December 2025 on legislative amendments to the Electronic Transactions Ordinance (Cap. 553) to adopt MLETR-aligned standards for B2B electronic transferable records, with 2026 work focused on submitting legislative proposals to the Legislative Council. This supports demand for platforms and service providers that package compliant e-document workflows alongside cross-border logistics and trade finance, particularly as the Trade Single Window continues Phase 3 rollout in 2026 to replace legacy Government Electronic Trading Services.
Cross-boundary commerce enablement is also creating payments and data-linked opportunities. In March 2026, the Hong Kong Monetary Authority signed an MoU with the Shanghai Data Bureau and the National Technology Innovation Center for Blockchain under Project Ensemble to explore cross-boundary financial cooperation, including electronic bills of lading, which can help connect sellers, logistics operators, and financial institutions through interoperable trade instruments. SME onboarding remains a key competitive battleground: the Trade and Industry Department launched E-commerce Easy under the BUD Fund in July 2024 and expanded coverage to 10 ASEAN countries, helping Hong Kong merchants build outward cross-border sales capabilities and increasing demand for localized enablement stacks (storefronts, marketing tools, and fulfillment partners) that can operate across Hong Kong and regional routes.
Recent Industry Developments
- July 2026: JD.com bought the Silka Seaview Hotel in Kowloon for HKD 750 million (USD 95.6 million) to convert it into student housing in the second half of 2026. While not a pure retail asset, it points to deeper on-the-ground investment and ecosystem building by a major cross-border commerce player operating in Hong Kong.
- November 2025: WeChat Pay HK partnered with Thunes to expand cross-border money transfer capabilities. The broader payout reach and connectivity support e-commerce checkout and refunds tied to international sellers and cross-border shoppers using wallet-based rails.
- October 2024: Alibaba and JD.com announced increased investments to strengthen their Hong Kong service offerings, including delivery and return enhancements. The moves intensified competitive pressure on local platforms and raised the baseline for fulfillment and after-sales service in cross-border online shopping.
Research Methodology Framework and Report Scope
Market Definition and Coverage
For this report, the Hong Kong e-commerce market is defined as the value of goods and services purchased through online channels by consumers and businesses in Hong Kong, where ordering and payment are completed digitally and fulfillment can be online or offline.
Scope exclusions: We exclude informal social selling that is not trackable as online commerce, and we do not treat pure payment processing value as e-commerce revenue.
Segmentation Overview
- By Business Model
- B2B
- B2C
- By Device Type for B2C E-commerce
- Smartphone and Mobile
- Desktop and Laptop
- Other Device Types
- By Payment Method for B2C E-commerce
- Credit and Debit Cards
- Digital Wallets
- Buy Now Pay Later
- Other Payment Methods
- By Product Category for B2C E-commerce
- Beauty and Personal Care
- Hair Care
- Skin Care
- Cosmetics and Beauty
- Other Beauty and Personal Care Product Categories
- Consumer Electronics
- Mobile
- PC and Laptops
- Audio Devices
- Gaming Devices
- Other Consumer Electronics Product Categories
- Fashion and Apparel
- Clothing
- Footwear
- Fashion Accessories
- Other Fashion and Apparel Product Categories
- Food and Beverages
- Packaged Food
- Bakery and Confectionery
- Meat, Poultry, and Seafood
- Other Food and Beverages Product Categories
- Furniture and Home
- Home Furniture
- Office Furniture
- Outdoor Furniture
- Other Furniture and Home Product Categories
- Other Product Categories
- Beauty and Personal Care
Data Sources, Market Sizing, and Validation
Desk Research
Desk research started with public statistical series that show how online spending is behaving inside Hong Kong retail and services. We referenced sources such as the Hong Kong Census and Statistics Department releases on retail sales and online retail sales, the Census and Statistics Department Monthly Survey of Retail Sales PDFs, and Hong Kong Trade Development Council publications for trade and retail context.
To set realistic bounds and inputs, we also reviewed macro and digital indicators from sources such as the World Bank and the International Telecommunication Union, along with company filings, investor presentations, and reputable press coverage on local logistics, delivery expectations, and digital wallet adoption. Where needed, paid databases were used in a limited way for company financials and news screening, plus patent databases and contracts and tenders to validate investment signals. This list of desk research sources is illustrative only, and many other public documents and datasets were also used for data collection, validation, and clarifying assumptions.
Primary Interviews and Surveys
Primary interviews and surveys were used to pressure-test the desk assumptions on how online spending splits by business model, typical order frequency, delivery fees, and discounting behavior, since these can shift quickly in a small, open market like Hong Kong. We spoke with marketplace and brand-side teams, logistics and last-mile specialists, payment and checkout stakeholders, and category-focused sellers, and then we reconciled their inputs against observable retail and online sales signals.
Distribution of primary research fieldwork respondents
| Company type | Respondent position |
|---|---|
| Top tier: 39% | CXOs: 18% |
| Mid tier: 42% | Functional/Unit leaders: 22% |
| Smaller Players: 19% | Managers: 60% |
Market-Sizing & Forecasting
The core model is built using a top-down approach where official retail and online retail sales series are used to reconstruct the online commerce demand pool, and then it is adjusted with category and business-model splits that were validated in interviews. Since Hong Kong has high smartphone usage and fast delivery expectations, we also track supporting indicators such as online retail sales share of total retail sales, cross-border purchase propensity, digital wallet and BNPL usage in checkout, delivery fee levels, and promotion intensity that affects realized prices.
After that, selective bottom-up checks are used to keep the totals realistic. These include sampled GMV to revenue take-rate logic for marketplace-led commerce, plus spot checks using average order value and order frequency ranges by major categories. When seller disclosures are limited, gaps are handled by applying conservative adoption and conversion assumptions that are anchored to official series, and then updated only if multiple interviewees confirm a change.
For forecasting, we mainly apply scenario analysis supported by trend smoothing on the key drivers, because growth is sensitive to consumer sentiment swings and promotional cycles. The forward path is then re-checked with primary inputs on expected pricing and discount cadence, logistics capacity and service levels, and any planned changes in payment behavior that can raise or lower conversion rates.
Data Validation & Update Cycle
We run multi-step checks before finalizing numbers, including variance tests across time series, cross-checks against independent demand signals, and review of any sharp step changes that do not match retail or online sales direction. If a key input moves outside expected bounds, such as average order value shifts, unusually high discounting, or a sudden change in online sales share, we re-contact experts to confirm whether the move is structural or temporary.
Outputs are reviewed by another analyst for consistency of definitions, unit treatment, and currency assumptions, and then they are signed off after the model and narrative align. The report is refreshed annually, and interim updates are made when material events change pricing, logistics, or payment adoption, followed by a final pre-delivery pass so clients receive the latest view.
Mordor Intelligence's Hong Kong Ecommerce Market Sizing Compared With Other Published Estimates
Different published market sizes for Hong Kong e-commerce can vary even when the topic sounds identical, because the underlying measurement choices are not always the same. Common reasons include whether numbers reflect GMV or net revenue, how cross-border orders are treated, and how quickly price assumptions are refreshed when discounting patterns change.
In a refresh-led view, the timing of currency conversion, the way average order value is updated, and the validation checks used against official online retail sales trends can shift the final number by a noticeable margin. When those inputs are kept on older snapshots, it can pull estimates up or down without the reader noticing, and that is one practical spread driver in e-commerce sizing.
Benchmark comparison
| Source | Market Size | Gaps in Research Methodology |
|---|---|---|
| Mordor Intelligence | USD 26.15 B (2025) | |
| Industry Association A | USD 29.60 B (2025) | Often closer to a GMV-style view, which can keep shipping fees and platform-facilitated transactions inside the total, and it may use earlier-year FX timing that does not match the study year average. |
| Global Consultancy B | USD 23.90 B (2025) | May apply more conservative price and growth assumptions by holding average order value flat through promotion cycles, and may exclude parts of B2B online ordering that still qualify as e-commerce transactions. |
The table shows that the spread is mainly explained by what is counted as the transaction value and how quickly pricing assumptions get refreshed in a promotion-heavy market. By aligning FX timing to the study year and re-validating ASP and online sales share signals during updates, Mordor Intelligence keeps the estimate closer to what buyers actually paid through online channels in Hong Kong.
Key Questions Answered in the Report
How large is online retail spending in Hong Kong today?
Online retail reached USD 28.47 billion in 2026 and is on track to climb to USD 41.62 billion by 2031.
Which sales channel is expanding fastest in Hong Kong's digital commerce?
B2B procurement platforms are projected to grow at an 8.03% CAGR between 2026 and 2031, outpacing consumer channels.
Why do smartphones dominate transactions in the territory?
99% smartphone penetration coupled with 90% 5G coverage enables live-stream shopping and one-tap biometric payments that desktop sites cannot match.
What is the biggest cost pressure facing Hong Kong e-commerce operators?
Warehouse rents that averaged HKD 18 per square foot and courier wages that doubled during peak seasons squeezed fulfillment margins in 2025.
Which product category is set to grow fastest through 2031?
Online food and beverage sales are forecast to expand at an 8.31% CAGR, driven by on-demand grocery apps and dense delivery networks.
How concentrated is platform competition in Hong Kong?
The top five players control roughly half of total online sales, reflecting a moderate concentration that still leaves meaningful room for niche entrants.