Market Overview
| Study Period | 2019 - 2030 |
|---|---|
| Base Year For Estimation | 2024 |
| Forecast Data Period | 2025 - 2030 |
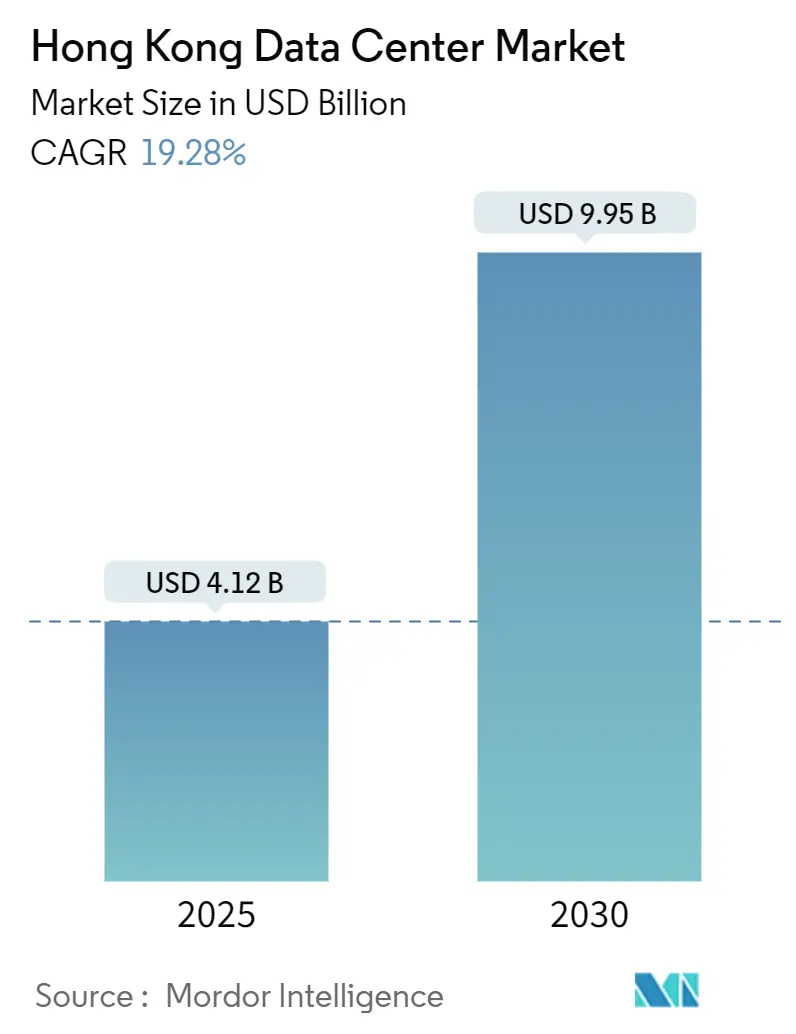
| Market Size (2025) | USD 4.12 Billion |
| Market Size (2030) | USD 9.95 Billion |
| Growth Rate (2025 - 2030) | 19.28% CAGR |
| Market Concentration | Medium |
Major Players
*Disclaimer: Major Players sorted in no particular order Image © Mordor Intelligence. Reuse requires attribution under CC BY 4.0. |
|
Hong Kong Data Center Market Analysis by Mordor Intelligence
The Hong Kong data center market size stood at USD 4.12 billion in 2025 and is forecast to expand to USD 9.95 billion by 2030, reflecting a 19.28% CAGR over the period. IT load capacity increase, from 1.09 GW to 1.36 GW at a 4.54% CAGR is projected over the forecast period. The market segment shares and estimates are calculated and reported in terms of MW. Revenue growth is running far ahead of the underlying IT load capacity increase indicating that operators are successfully capturing higher per-megawatt pricing through premium interconnection, latency-critical services, and sustained capacity scarcity. Demand is underpinned by Smart City Blueprint programs that accelerate enterprise cloud adoption, hyperscale build-outs that seek dual-jurisdiction reach into mainland China, and the city’s unmatched density of submarine-cable landings. Barriers to entry, including soaring land costs, multi-year power allocation cycles, and strict environmental limits, have reinforced incumbent pricing power while spurring investment in vertical construction, liquid cooling, and renewable energy sourcing to boost rack-level economics and sustainability credentials.
Key Report Takeaways
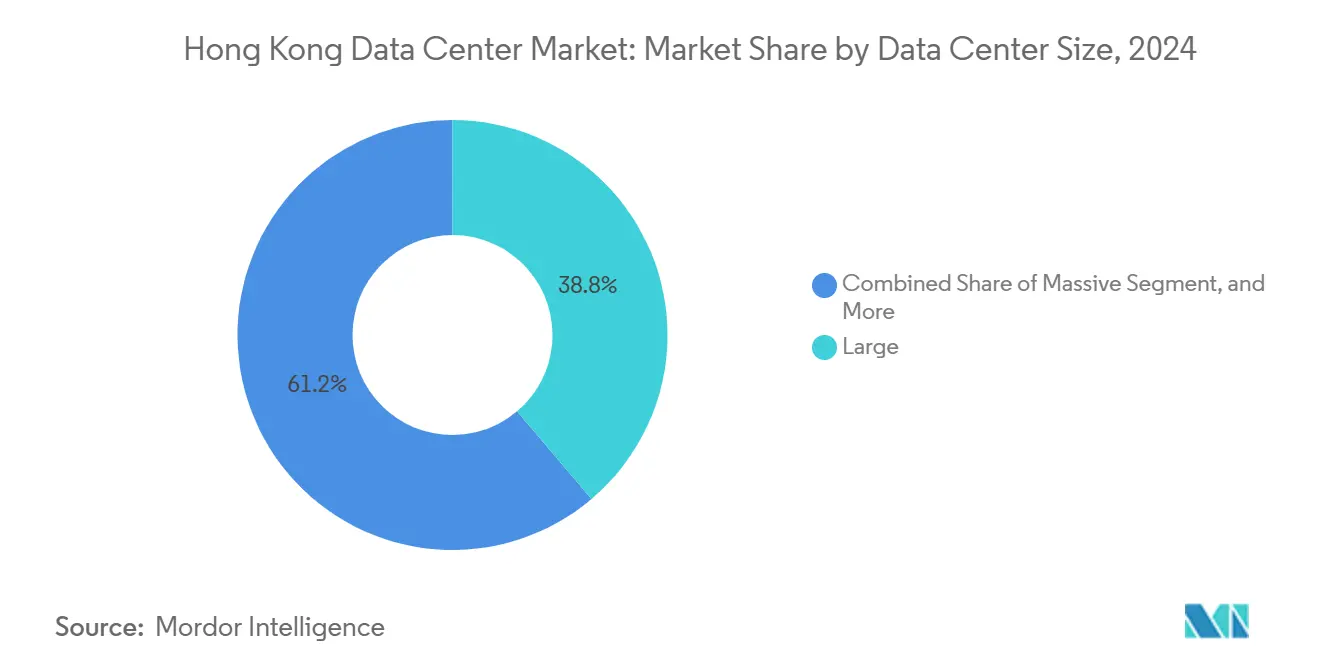
- By data center size, large facilities led with a 38.82% market share of the Hong Kong data center market in 2024, while medium-sized sites are projected to expand at a 6.50% CAGR through 2030.
- By tier type, tier 3 infrastructure accounted for 65.22% of the Hong Kong data center market's 2024 revenues, and tier 4 is expected to grow at the fastest rate, with a 4.02% CAGR through 2030.
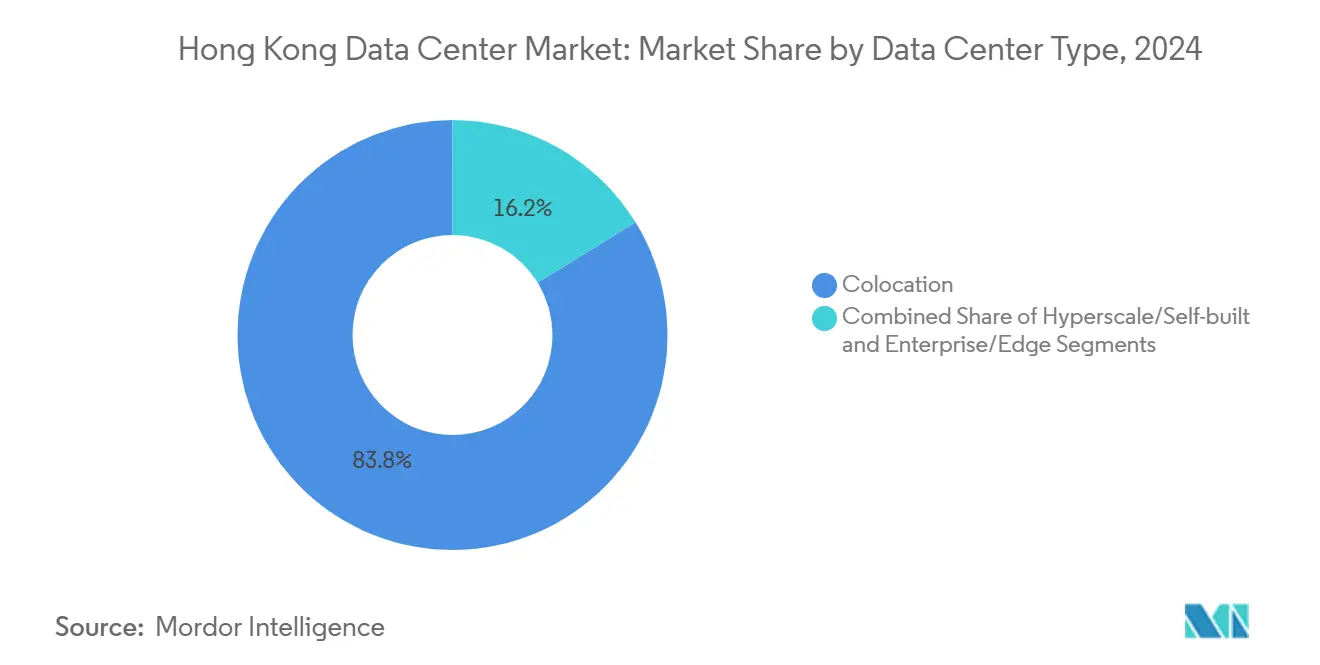
- By data center type, colocation services accounted for an 83.78% share of the Hong Kong data center market in 2024; hyperscale and self-build sites recorded the strongest growth trajectory at a 7.11% CAGR from 2024 to 2030.
- By end user, IT and telecom generated 42.50% of the 2024 demand for the Hong Kong data center market, while BFSI workloads are projected to advance at a 6.22% CAGR through 2030.
- By hotspot, Tseung Kwan O secured a 36.94% share of the Hong Kong data center market in 2024, whereas facilities in the rest of Hong Kong are rising at a 6.10% CAGR through 2030.
Hong Kong Data Center Market Trends and Insights
Drivers Impact Analysis
| Driver | (~) % Impact on CAGR Forecast | Geographic Relevance | Impact Timeline |
|---|---|---|---|
| Smart City Blueprint accelerates cloud adoption | +1.2% | Hong Kong, Greater Bay Area spillover | Medium term (2-4 years) |
| Increasing submarine-cable landings | +1.8% | Hong Kong, wider Asia-Pacific | Long term (≥ 4 years) |
| Hyperscale build-outs by global cloud providers | +2.1% | Hong Kong, Asia-Pacific hubs | Medium term (2-4 years) |
| Fintech and virtual-bank latency needs | +1.5% | Hong Kong, cross-border finance | Short term (≤ 2 years) |
| SME Digital-Transformation program | +0.8% | Hong Kong local | Short term (≤ 2 years) |
| Renewable-energy feed-in tariff | +0.6% | Hong Kong | Long term (≥ 4 years) |
| Source: Mordor Intelligence | |||
Understand The Key Trends Shaping This Market
Download PDF
Government Smart City Blueprint Accelerates Cloud Adoption
The Smart City Blueprint 2.0 has shifted enterprise strategies from on-premises to hybrid cloud architectures, driving up colocation and gateway demand as firms pursue state-mandated digital services.[1]Hannah Wang, “Hong Kong Needs More Cybersecurity Professionals as Threats Increase,” South China Morning Post, scmp.com Government procurement via GovCloud set security benchmarks that private companies now mirror, multiplying demand across finance, logistics, and manufacturing. The framework for cross-border data collaboration positions Hong Kong facilities as dual-jurisdiction nodes for the expansion of the Greater Bay Area, reducing compliance risk and encouraging multi-year contracts. Per-rack revenue density has risen because enterprises consolidate mission-critical loads in territory-based facilities that guarantee regulatory clarity. The program’s emphasis on IoT and digital mobility also fuels edge-computing requirements inside Hong Kong borders, giving operators scope to monetize micro-edge suites at premium price points.
Increasing Submarine-Cable Landings Elevate Connectivity
With 14 intra-Asian cables, 11 of which terminate inside commercial facilities, Hong Kong enjoys interconnection economics that its competitors cannot match. SUNeVision hosts nine of those landings, capturing inter-metro traffic and cross-connect fees that push per-megawatt revenues well beyond regional averages. Fresh trans-Pacific and intra-Asia Pacific routes have expanded international bandwidth, enabling differentiated services such as dedicated cloud connectivity and private WANs that command higher gross margins. Early-stage cable-landing investments secure first-mover rights to hyperscale capacity reservations, anchoring long-term wholesale deals. This infrastructure density also future-proofs Hong Kong for Belt and Road digital flows and reinforces customer stickiness by providing low-latency, multiple-route redundancy, which is unavailable elsewhere in the region.
Surge in Hyperscale Build-Outs by Global Cloud Providers
Global cloud majors are scaling their Hong Kong nodes to meet regional hybrid-enterprise demand, prioritizing sites that deliver concurrent reach into mainland China under the “One Country, Two Systems” framework.[2]CLP Power, “CLP Power Tariff Adjustment 2025,” clp.com.hk Microsoft’s partnership with AirTrunk for renewable energy certificates illustrates how access to green power influences location choice. Hyperscale clients sign decade-plus, high-density contracts, stabilizing operator cash flows but intensifying competition for scarce land and power slots. The rise of AI and HPC workloads is driving rack power upward, so operators investing in liquid cooling and densities of 100 kW or more gain a significant pricing edge. Facility retrofits to meet these specifications open additional revenue streams in power-usage effectiveness consulting and cooling-capacity leasing.
Robust Demand from Fintech and Virtual Banks for Low-Latency Hosting
Eight licensed virtual banks, plus a flourishing crypto-asset ecosystem, mandate sub-millisecond latency for transaction clearing, driving the take-up of tier 4 space and dedicated private-cloud pods. Real-time settlements across the Faster Payment System and digital-yuan pilots require compliance-grade, always-on infrastructure. Digital-asset custodians have increased demand for hardware-security modules and air-gapped vaults within high-security suites, driving up achievable revenue per square foot. The geographic clustering of fintech firms in Central and Admiralty translates into a preference for proximate facilities that provide sub-microsecond fiber loops to trading venues, reinforcing the pricing premium of data centers on Hong Kong Island.
Restraints Impact Analysis
| Restraint | (~) % Impact on CAGR Forecast | Geographic Relevance | Impact Timeline |
|---|---|---|---|
| Escalating real-estate prices | −1.8% | Industrial zones across Hong Kong | Long term (≥ 4 years) |
| Lengthy power-allocation approvals | −1.2% | Territory-wide | Medium term (2-4 years) |
| Shortage of skilled electrical engineers | −0.9% | Hong Kong, regional talent market | Medium term (2-4 years) |
| Cooling-water discharge limits | −0.7% | Tseung Kwan O Industrial Estate | Long term (≥ 4 years) |
| Source: Mordor Intelligence | |||
Escalating Real-Estate Prices Constrain Greenfield Expansion
Hong Kong’s land prices rank among the world’s highest, forcing operators toward vertical builds and ultra-high power densities that inflate capex and engineering complexity.[3]SUNeVision, “Risk Management and Internal Control,” sunevision.com Industrial plots in Tseung Kwan O command premium valuations; alternative districts face zoning hurdles, further tightening supply. Incumbents with legacy holdings enjoy a structural advantage, as illustrated by SUNeVision’s 1.2 million square feet of development pipeline. For new entrants, acquisition costs and requisite high utilization to break even elevate financial risk, encouraging market consolidation rather than fresh competition.
Lengthy Power-Allocation Approval Cycles Delay Projects
Securing grid capacity can be extended by four to five years, compared to under one year in peer markets. Sequential environmental, building, and utility reviews compound financing costs and expose planners to shifting technology requirements. Hyperscale clients accustomed to faster deployments elsewhere may reroute workloads if capacity timelines slip, so local players with entrenched regulatory relationships often outperform in terms of speed-to-market. Meanwhile, CLP’s 2025 tariff rises to 144.3 HK¢/kWh, but elongated approval periods limit operators’ ability to adjust project scale swiftly in response to price signals.
Segment Analysis
By Data Center Size: Consolidation Around Large-Scale Capacity
Large facilities, commanding 38.82% of 2024 revenue, continue to anchor the Hong Kong data center market as enterprises migrate to consolidated environments that yield economies in power, cooling, and carrier cross-connects. Medium-sized sites, however, post the quickest trajectory at 6.50% CAGR, meeting hybrid-cloud firms’ need for “right-sized” footprints with lower capital outlay. The Hong Kong data center market share for mega and massive campuses remains constrained by grid allocation bottlenecks; however, operators pursuing campus-style builds across adjacent lots effectively aggregate capacity to satisfy hyperscale reservations.
The shift to AI and machine-learning workloads favors large and mega designs capable of integrating liquid-cooling manifolds and 50–100 kW rack densities. Small facilities, often legacy telecom exchanges, cede market share as tenants opt for higher-tier environments that offer multi-cloud on-ramps and richer carrier fabrics. The aggregate Hong Kong data center market size for large facilities is projected to expand steadily; however, pricing power is likely to remain strongest in high-density halls where specialized infrastructure is scarce.
Note: Segment shares of all individual segments available upon report purchase
Get Detailed Market Forecasts at the Most Granular Levels
Download PDF
By Tier Type: Tier 3 Standardization, Tier 4 Upside
Tier 3 sites held a 65.22% revenue share in 2024, reflecting the enterprise's appetite for concurrently maintainable infrastructure without the full cost of fault-tolerant Tier 4 designs. The Hong Kong data center market size tied to tier 4 is gaining at a 4.02% CAGR as virtual banks, exchanges, and crypto-custody platforms pursue zero-downtime mandates. Tier 1–2 footprints continue to contract, pressured by customer preferences for higher availability and by rigid regulatory requirements in finance and healthcare.
Operators are investing in modular redundancy upgrades to elevate older halls from Tier 2 to Tier 3, thereby preserving asset value and extending lease terms. Tier 4 expansion is capital-intensive due to the need for duplicated feeds, chilled-water systems, and mechanical-electrical plumbing; however, operators can charge premium occupancy rates. Market differentiation increasingly hinges on live demonstration of fault-isolation testing that proves true Tier 4 performance.
By Data Center Type: Colocation Dominance Meets Hyperscale Momentum
Colocation delivered 83.78% of 2024 revenues as enterprises adopted shared infrastructure models to mitigate Hong Kong’s high real estate and power costs. Hyperscale and self-built footprints, however, are projected to show a 7.11% CAGR through 2030, as global cloud majors secure dedicated halls or entire buildings. Within colocation, wholesale cages for single-tenant use attract high-density AI and trading workloads, while retail colocation retains smaller racks for SMEs pursuing digital transformation.
Edge and enterprise micro-facilities occupy a niche role, typically located in buildings adjacent to CBDs to meet sub-millisecond latency targets for trading, streaming, or IoT aggregation. As hyperscale uptake rises, operators leverage surplus wholesale capacity to negotiate anchor-tenant deals that catalyze subsequent retail cross-connect demand, reinforcing the Hong Kong data center market’s interconnection flywheel.
Note: Segment shares of all individual segments available upon report purchase
Get Detailed Market Forecasts at the Most Granular Levels
Download PDF
By End User: Telecom Leadership, BFSI Surge
IT and telecom customers produced 42.50% of 2024 demand, drawn by Hong Kong’s exceptional cable-landing density and carrier-neutral exchange points. Banking, financial services, and insurance workloads are advancing at the fastest rate, with a 6.22% CAGR, driven by virtual bank licenses and stringent data residency rules. The e-commerce, media, and government sectors collectively contribute a growing tail of edge requirements as user experience imperatives and smart-city digitization increase local compute intensity.
BFSI tenants often require Tier 4 or ISO 27001 certified space with granular access controls, pushing revenue per rack above territory averages. Telecom and OTT platforms prioritize carrier-dense sites for peering, resulting in cross-connect revenue accounting for a significant share of total yield in telecom-heavy halls. The Hong Kong data center market share attributable to crypto-asset platforms is small but carries double-digit growth potential pending regulatory clarity, implying future upside for vault-grade secure rooms and cold-storage modules.
Geography Analysis
Tseung Kwan O commanded 36.94% of the 2024 market value, benefitting from government-preset land parcels, streamlined permitting, and adjacency to several cable landings. Capacity is tightening, so operators are scouting Tsuen Wan and Chai Wan, where industrial zoning still permits multi-story data-center retrofits at comparatively lower plot ratios. The Hong Kong data center market size outside Tseung Kwan O is growing at 6.10% CAGR, driven by diversification strategies that reduce single-district risk and meet downtown latency needs.
Chai Wan’s proximity to Central’s finance core is compelling for trading desks seeking microsecond round-trip latencies, while Tsuen Wan offers valuable grid headroom and truck access for large equipment delivery. Operators employing dark-fiber campus interlinks across multiple districts can offer logical “single site” redundancy, an increasingly attractive feature for regulators who require geographic diversity without cross-border data movement.
Hong Kong’s compact 1,106 km² footprint enables sub-5 ms connectivity between any two metropolitan points, an inherent advantage over sprawling peer cities. The Hong Kong data center market share clustered in Tseung Kwan O demonstrates how proactive zoning guides investment; however, operators are widening their footprints to hedge against local water-discharge caps and grid-feed constraints.
International enterprises prize the territory’s “One Country, Two Systems” legal framework, which permits simultaneous compliance with mainland China’s Cybersecurity Law and global data-privacy standards. This dual compatibility underpins long lease tenures for finance, e-commerce, and logistics players managing cross-border flows.
Sustainability directives are also shaping geographic selection. CLP’s feed-in tariff and the government’s 2050 carbon-neutral pledge incentivize retrofits that add rooftop PV and adopt fresh-air economization. Operators that can prove they are greener in their power procurement win tenant preference, especially among hyperscale buyers mandated to achieve 100% renewable electricity. Environmental and urban planning rules also encourage vertical campuses, which merge several towers via dedicated fiber trunks to overcome land scarcity while maintaining cross-site N+1 resilience.
Competitive Landscape
The Hong Kong data center market shows moderate concentration, led by SUNeVision, Equinix, Digital Realty, and a handful of regional specialists. SUNeVision leverages strategic land banks and nine cable-landing stations within its MEGA Campus, resulting in 41% net profit margins and approximately 15,000 active interconnections. Equinix benefits from a global IBX platform that secures multi-region commitments from hyperscale and enterprise clients; its Asia-Pacific revenue hit USD 500 million in Q3 2024, with Hong Kong contributing 3% of global turnover.[4]Equinix, “Equinix Reports Third-Quarter 2024 Results,” equinix.com
Technology agendas center on liquid-cooling retrofits and the integration of on-site renewable energy. Digital Realty reported 31% renewal spreads for deals exceeding 1 MW in Q3 2024, underscoring robust pricing in scale segments even before AI-led density surges. Operators such as AirTrunk have partnered with utilities to purchase renewable-energy certificates, locking in green power for hyperscale tenants like Microsoft.
Barriers to entry remain high due to 4-5 year project approvals, limited industrial land, and steep capex per megawatt. Consequently, smaller providers face pressure to consolidate or pivot toward specialized niches, such as high-security crypto-custody vaults and edge pods for IoT. White-space opportunity exists in GPU cluster colocation and managed AI-as-a-service, a field where incumbents with robust power reserves can command premium returns.
Hong Kong Data Center Industry Leaders
-
SUNeVision Holdings Limited
-
Equinix, Inc.
-
Goodman Group
-
NTT DATA Corporation
-
Towngas Telecommunications Company Limited
- *Disclaimer: Major Players sorted in no particular order
Need More Details on Market Players and Competitors?
Download PDF
Recent Industry Developments
- May 2025: NTT DATA announced land purchases across seven new markets to support nearly 1 GW of future capacity, although no Hong Kong parcels were included.
- February 2025: Equinix reported FY 2024 Asia-Pacific revenue of USD 500 million, with Hong Kong Dollar exposure accounting for 3% of global sales.
- January 2025: CLP Power implemented tariff adjustments effective January 1, 2025, with electricity rates increasing to 144.3 HK¢/kWh (USD 18.5¢/kWh), representing a modest 0.98% increase that affects operational costs for data center operators while maintaining Hong Kong's competitive position relative to other major Asia Pacific markets
- January 2025: NTT DATA disclosed total investments of USD 2.9 billion in 2024 across the North America, EMEA, and Asia Pacific regions, including the completion of a major 68.5-acre campus development in Johor Bahru, Malaysia, with approximately 290 MW of planned capacity, highlighting regional competitive dynamics that affect Hong Kong market positioning.
Hong Kong Data Center Market Report Scope
Chai Wan, Shatin, Tseun Wan, Tseung Kwan O are covered as segments by Hotspot. Large, Massive, Medium, Mega, Small are covered as segments by Data Center Size. Tier 1 and 2, Tier 3, Tier 4 are covered as segments by Tier Type. Non-Utilized, Utilized are covered as segments by Absorption.
By Data Center Size
| Large |
| Massive |
| Medium |
| Mega |
| Small |
By Tier Type
| Tier 1 and 2 |
| Tier 3 |
| Tier 4 |
By Data Center Type
| Hyperscale/Self-built | ||
| Enterprise/Edge | ||
| Colocation | Non-Utilized | |
| Utilized | Retail Colocation | |
| Wholesale Colocation | ||
By End User
| BFSI |
| IT and ITES |
| E-Commerce |
| Government |
| Manufacturing |
| Media and Entertainment |
| Telecom |
| Other End Users |
By Hotspot
| Tseung Kwan O |
| Tseun Wan |
| Chai Wan |
| Rest of Hong Kong |
| By Data Center Size | Large | ||
| Massive | |||
| Medium | |||
| Mega | |||
| Small | |||
| By Tier Type | Tier 1 and 2 | ||
| Tier 3 | |||
| Tier 4 | |||
| By Data Center Type | Hyperscale/Self-built | ||
| Enterprise/Edge | |||
| Colocation | Non-Utilized | ||
| Utilized | Retail Colocation | ||
| Wholesale Colocation | |||
| By End User | BFSI | ||
| IT and ITES | |||
| E-Commerce | |||
| Government | |||
| Manufacturing | |||
| Media and Entertainment | |||
| Telecom | |||
| Other End Users | |||
| By Hotspot | Tseung Kwan O | ||
| Tseun Wan | |||
| Chai Wan | |||
| Rest of Hong Kong | |||
Need A Different Region or Segment?
Customize Now
Market Definition
- IT LOAD CAPACITY - The IT load capacity or installed capacity, refers to the amount of energy consumed by servers and network equipments placed in a rack installed. It is measured in megawatt (MW).
- ABSORPTION RATE - It denotes the extend to which the data center capacity has been leased out. For instance, a 100 MW DC has leased out 75 MW, then absorption rate would be 75%. It is also referred as utilization rate and leased-out capacity.
- RAISED FLOOR SPACE - It is an elevated space build over the floor. This gap between the original floor and the elevated floor is used to accommodate wiring, cooling, and other data center equipment. This arrangement assist in having proper wiring and cooling infrastructure. It is measured in square feet (ft^2).
- DATA CENTER SIZE - Data Center Size is segmented based on the raised floor space allocated to the data center facilities. Mega DC - # of Racks must be more than 9000 or RFS (raised floor space) must be more than 225001 Sq. ft; Massive DC - # of Racks must be in between 9000 and 3001 or RFS must be in between 225000 Sq. ft and 75001 Sq. ft; Large DC - # of Racks must be in between 3000 and 801 or RFS must be in between 75000 Sq. ft and 20001 Sq. ft; Medium DC # of Racks must be in between 800 and 201 or RFS must be in between 20000 Sq. ft and 5001 Sq. ft; Small DC - # of Racks must be less than 200 or RFS must be less than 5000 Sq. ft.
- TIER TYPE - According to Uptime Institute the data centers are classified into four tiers based on the proficiencies of redundant equipment of the data center infrastructure. In this segment the data center are segmented as Tier 1,Tier 2, Tier 3 and Tier 4.
- COLOCATION TYPE - The segment is segregated into 3 categories namely Retail, Wholesale and Hyperscale Colocation service. The categorization is done based on the amount of IT load leased out to potential customers. Retail colocation service has leased capacity less than 250 kW; Wholesale colocation services has leased capacity between 251 kW and 4 MW and Hyperscale colocation services has leased capacity more than 4 MW.
- END CONSUMERS - The Data Center Market operates on a B2B basis. BFSI, Government, Cloud Operators, Media and Entertainment, E-Commerce, Telecom and Manufacturing are the major end-consumers in the market studied. The scope only includes colocation service operators catering to the increasing digitalization of the end-user industries.
| Keyword | Definition |
|---|---|
| Rack Unit | Generally referred as U or RU, it is the unit of measurement for the server unit housed in the racks in the data center. 1U is equal to 1.75 inches. |
| Rack Density | It defines the amount of power consumed by the equipment and server housed in a rack. It is measured in kilowatt (kW). This factor plays a critical role in data center design and, cooling and power planning. |
| IT Load Capacity | The IT load capacity or installed capacity, refers to the amount of energy consumed by servers and network equipment placed in a rack installed. It is measured in megawatt (MW). |
| Absorption Rate | It denotes how much of the data center capacity has been leased out. For instance, if a 100 MW DC has leased out 75 MW, then the absorption rate would be 75%. It is also referred to as utilization rate and leased-out capacity. |
| Raised Floor Space | It is an elevated space built over the floor. This gap between the original floor and the elevated floor is used to accommodate wiring, cooling, and other data center equipment. This arrangement assists in having proper wiring and cooling infrastructure. It is measured in square feet/meter. |
| Computer Room Air Conditioner (CRAC) | It is a device used to monitor and maintain the temperature, air circulation, and humidity inside the server room in the data center. |
| Aisle | It is the open space between the rows of racks. This open space is critical for maintaining the optimal temperature (20-25 °C) in the server room. There are primarily two aisles inside the server room, a hot aisle and a cold aisle. |
| Cold Aisle | It is the aisle wherein the front of the rack faces the aisle. Here, chilled air is directed into the aisle so that it can enter the front of the racks and maintain the temperature. |
| Hot Aisle | It is the aisle where the back of the racks faces the aisle. Here, the heat dissipated from the equipment’s in the rack is directed to the outlet vent of the CRAC. |
| Critical Load | It includes the servers and other computer equipment whose uptime is critical for data center operation. |
| Power Usage Effectiveness (PUE) | It is a metric which defines the efficiency of a data center. It is calculated by: (𝑇𝑜𝑡𝑎𝑙 𝐷𝑎𝑡𝑎 𝐶𝑒𝑛𝑡𝑒𝑟 𝐸𝑛𝑒𝑟𝑔𝑦 𝐶𝑜𝑛𝑠𝑢𝑚𝑝𝑡𝑖𝑜𝑛)/(𝑇𝑜𝑡𝑎𝑙 𝐼𝑇 𝐸𝑞𝑢𝑖𝑝𝑚𝑒𝑛𝑡 𝐸𝑛𝑒𝑟𝑔𝑦 𝐶𝑜𝑛𝑠𝑢𝑚𝑝𝑡𝑖𝑜𝑛). Further, a data center with a PUE of 1.2-1.5 is considered highly efficient, whereas, a data center with a PUE >2 is considered highly inefficient. |
| Redundancy | It is defined as a system design wherein additional component (UPS, generators, CRAC) is added so that in case of power outage, equipment failure, the IT equipment should not be affected. |
| Uninterruptible Power Supply (UPS) | It is a device that is connected in series with the utility power supply, storing energy in batteries such that the supply from UPS is continuous to IT equipment even during utility power is snapped. The UPS primarily supports the IT equipment only. |
| Generators | Just like UPS, generators are placed in the data center to ensure an uninterrupted power supply, avoiding downtime. Data center facilities have diesel generators and commonly, 48-hour diesel is stored in the facility to prevent disruption. |
| N | It denotes the tools and equipment required for a data center to function at full load. Only "N" indicates that there is no backup to the equipment in the event of any failure. |
| N+1 | Referred to as 'Need plus one', it denotes the additional equipment setup available to avoid downtime in case of failure. A data center is considered N+1 when there is one additional unit for every 4 components. For instance, if a data center has 4 UPS systems, then for to achieve N+1, an additional UPS system would be required. |
| 2N | It refers to fully redundant design wherein two independent power distribution system is deployed. Therefore, in the event of a complete failure of one distribution system, the other system will still supply power to the data center. |
| In-Row Cooling | It is the cooling design system installed between racks in a row where it draws warm air from the hot aisle and supplies cool air to the cold aisle, thereby maintaining the temperature. |
| Tier 1 | Tier classification determines the preparedness of a data center facility to sustain data center operation. A data center is classified as Tier 1 data center when it has a non-redundant (N) power component (UPS, generators), cooling components, and power distribution system (from utility power grids). The Tier 1 data center has an uptime of 99.67% and an annual downtime of <28.8 hours. |
| Tier 2 | A data center is classified as Tier 2 data center when it has a redundant power and cooling components (N+1) and a single non-redundant distribution system. Redundant components include extra generators, UPS, chillers, heat rejection equipment, and fuel tanks. The Tier 2 data center has an uptime of 99.74% and an annual downtime of <22 hours. |
| Tier 3 | A data center having redundant power and cooling components and multiple power distribution systems is referred to as a Tier 3 data center. The facility is resistant to planned (facility maintenance) and unplanned (power outage, cooling failure) disruption. The Tier 3 data center has an uptime of 99.98% and an annual downtime of <1.6 hours. |
| Tier 4 | It is the most tolerant type of data center. A Tier 4 data center has multiple, independent redundant power and cooling components and multiple power distribution paths. All IT equipment are dual powered, making them fault tolerant in case of any disruption, thereby ensuring interrupted operation. The Tier 4 data center has an uptime of 99.74% and an annual downtime of <26.3 minutes. |
| Small Data Center | Data center that has floor space area of ≤ 5,000 Sq. ft or the number of racks that can be installed is ≤ 200 is classified as a small data center. |
| Medium Data Center | Data center which has floor space area between 5,001-20,000 Sq. ft, or the number of racks that can be installed is between 201-800, is classified as a medium data center. |
| Large Data Center | Data center which has floor space area between 20,001-75,000 Sq. ft, or the number of racks that can be installed is between 801-3,000, is classified as a large data center. |
| Massive Data Center | Data center which has floor space area between 75,001-225,000 Sq. ft, or the number of racks that can be installed is between 3001-9,000, is classified as a massive data center. |
| Mega Data Center | Data center that has a floor space area of ≥ 225,001 Sq. ft or the number of racks that can be installed is ≥ 9001 is classified as a mega data center. |
| Retail Colocation | It refers to those customers who have a capacity requirement of 250 kW or less. These services are majorly opted by small and medium enterprises (SMEs). |
| Wholesale Colocation | It refers to those customers who have a capacity requirement between 250 kW to 4 MW. These services are majorly opted by medium to large enterprises. |
| Hyperscale Colocation | It refers to those customers who have a capacity requirement greater than 4 MW. The hyperscale demand primarily originates from large-scale cloud players, IT companies, BFSI, and OTT players (like Netflix, Hulu, and HBO+). |
| Mobile Data Speed | It is the mobile internet speed a user experiences via their smartphones. This speed is primarily dependent on the carrier technology being used in the smartphone. The carrier technologies available in the market are 2G, 3G, 4G, and 5G, where 2G provides the slowest speed while 5G is the fastest. |
| Fiber Connectivity Network | It is a network of optical fiber cables deployed across the country, connecting rural and urban regions with high-speed internet connection. It is measured in kilometer (km). |
| Data Traffic per Smartphone | It is a measure of average data consumption by a smartphone user in a month. It is measured in gigabyte (GB). |
| Broadband Data Speed | It is the internet speed that is supplied over the fixed cable connection. Commonly, copper cable and optic fiber cable are used in both residential and commercial use. Here, optic cable fiber provides faster internet speed than copper cable. |
| Submarine Cable | A submarine cable is a fiber optic cable laid down at two or more landing points. Through this cable, communication and internet connectivity between countries across the globe is established. These cables can transmit 100-200 terabits per second (Tbps) from one point to another. |
| Carbon Footprint | It is the measure of carbon dioxide generated during the regular operation of a data center. Since, coal, and oil & gas are the primary source of power generation, consumption of this power contributes to carbon emissions. Data center operators are incorporating renewable energy sources to curb the carbon footprint emerging in their facilities. |
Need More Details on Market Definition?
Ask a Question
Research Methodology
Mordor Intelligence follows a four-step methodology in all our reports.
- Step-1: Identify Key Variables: In order to build a robust forecasting methodology, the variables and factors identified in Step-1 are tested against available historical market numbers. Through an iterative process, the variables required for market forecast are set and the model is built on the basis of these variables.
- Step-2: Build a Market Model: Market-size estimations for the forecast years are in nominal terms. Inflation is not a part of the pricing, and the average selling price (ASP) is kept constant throughout the forecast period for each country.
- Step-3: Validate and Finalize: In this important step, all market numbers, variables and analyst calls are validated through an extensive network of primary research experts from the market studied. The respondents are selected across levels and functions to generate a holistic picture of the market studied.
- Step-4: Research Outputs: Syndicated Reports, Custom Consulting Assignments, Databases & Subscription Platforms

Get More Details On Research Methodology
Download PDF


