
Homeopathy Product Market Size and Share
Market Overview
| Study Period | 2020 - 2031 |
|---|---|
| Market Size (2026) | USD 13.02 Billion |
| Market Size (2031) | USD 16.65 Billion |
| Growth Rate (2026 - 2031) | 5.04 % |
| Fastest Growing Market | Asia Pacific |
| Largest Market | Europe |
| Market Concentration | Medium |
Major Players *Disclaimer: Major Players sorted in no particular order Image © Mordor Intelligence. Reuse requires attribution under CC BY 4.0. | |
Homeopathy Product Market Analysis by Mordor Intelligence
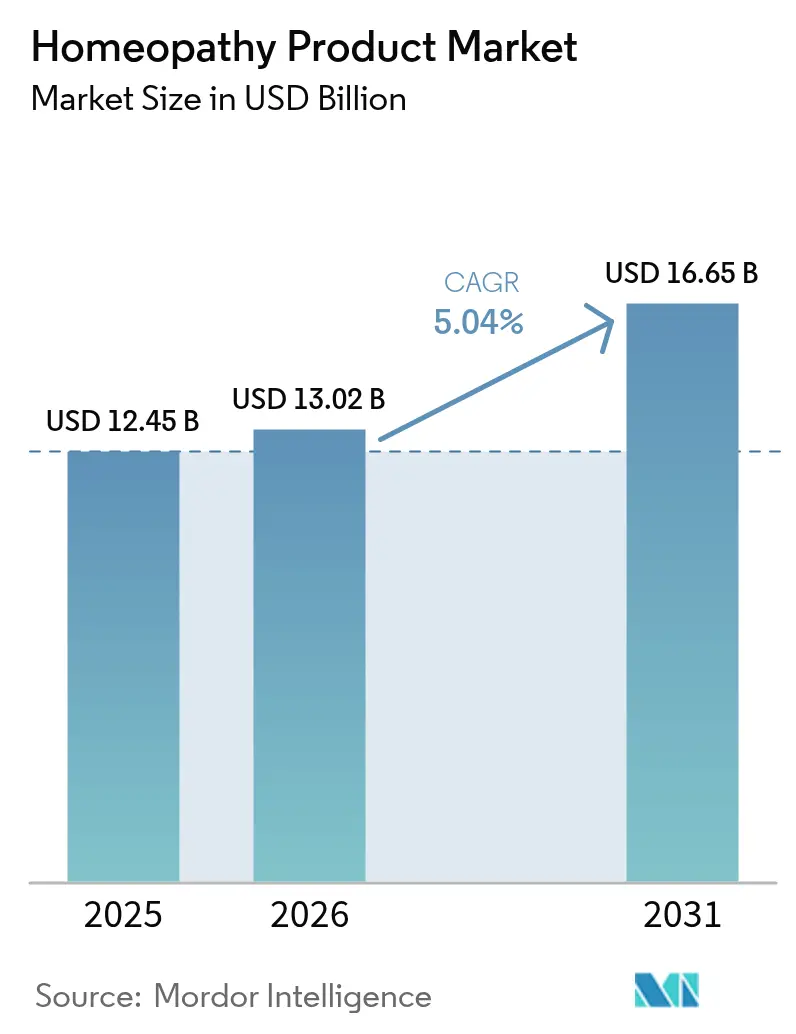
The Homeopathy Product Market size was valued at USD 12.45 billion in 2025 and is estimated to grow from USD 13.02 billion in 2026 to reach USD 16.65 billion by 2031, at a CAGR of 5.04% during the forecast period (2026-2031).
Demand is propelled by aging populations seeking gentler chronic-disease options, rising regulatory recognition in India, Canada, and parts of Europe, and e-commerce models that bypass skeptical pharmacy gatekeepers. OTC dominance masks fast growth in self-care combination remedies, while drops and tinctures gain favor for faster absorption. Competitive intensity remains moderate; regional leaders Boiron, Heel, and Schwabe defend share as digital-native entrants deploy direct-to-consumer subscriptions that cut margins yet deepen loyalty. Regulatory fragmentation poses downside risks, but the WHO’s Traditional Medicine Strategy and India’s National Commission for Homoeopathy Act offer durable upside for resource-constrained health systems.
Key Report Takeaways
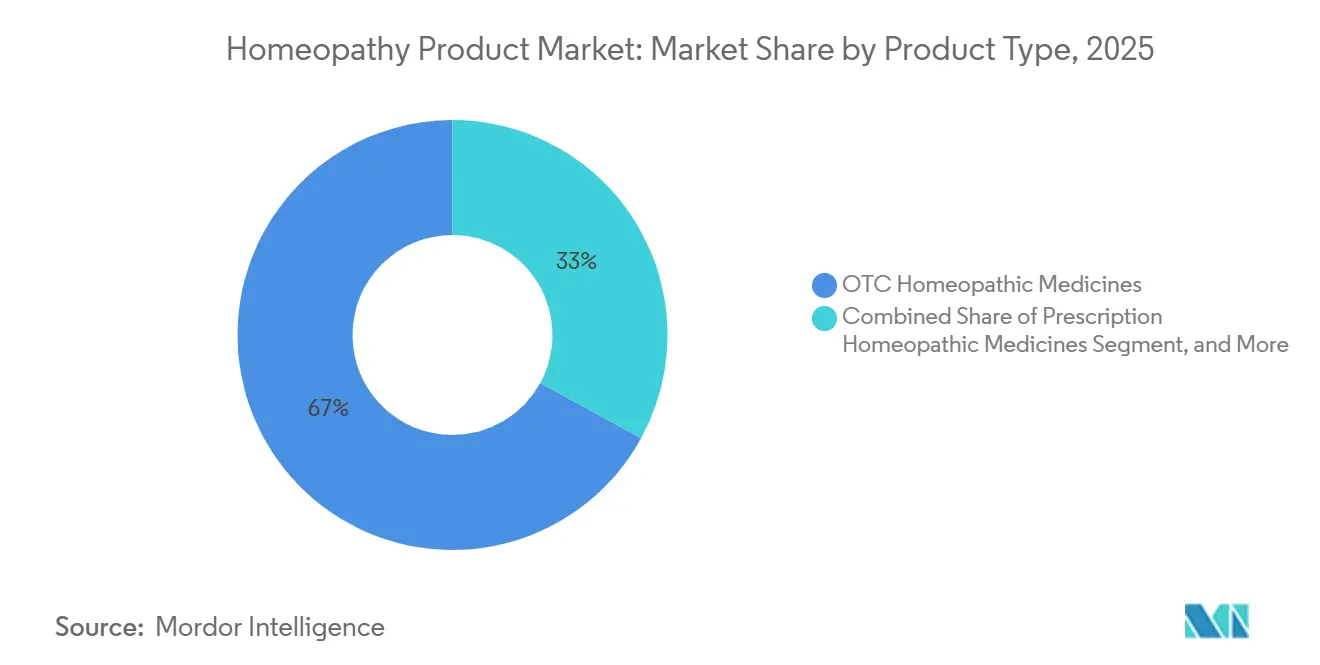
- By product type, over-the-counter homeopathic medicines led with 67.02% revenue share in 2025, and self-care combination remedies are advancing at a 6.85% CAGR through 2031.
- By source, plant-based sources commanded 60.34% of the homeopathy product market share in 2025, and animal-based formulations are projected to expand at a 9.33% CAGR through 2031.
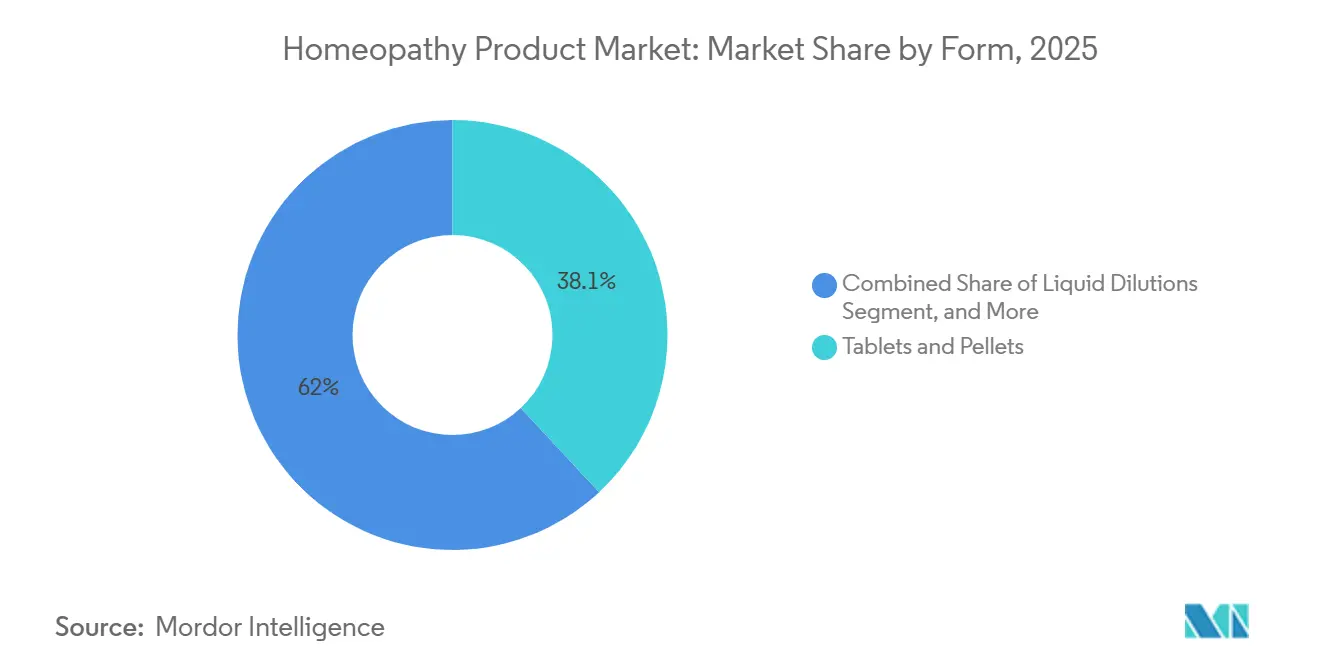
- By form, tablets & pellets commanded 38.05% of the homeopathy product market share in 2025, drops and tinctures are set to grow at a 10.93% CAGR, outpacing all other dosage forms.
- By distribution channel, retail pharmacies held a 46.28% share in 2025, while homeopathic clinics are growing at an 8.93% CAGR.
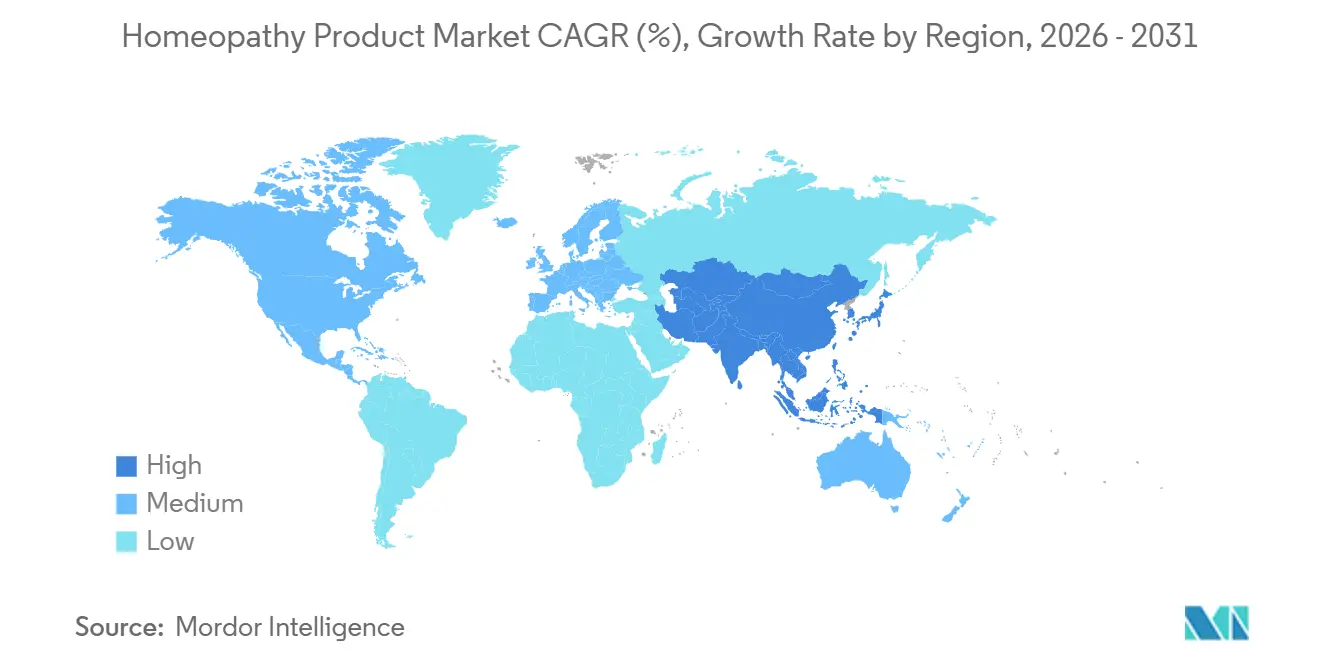
- By geography, North America accounted for 37.78% of the homeopathy product market size in 2025; Asia-Pacific is forecast to be the fastest region at a 7.03% CAGR.
Note: Market size and forecast figures in this report are generated using Mordor Intelligence’s proprietary estimation framework, updated with the latest available data and insights as of 2026.
Market Trends and Insights
Drivers Impact Analysis of Homeopathy Product Market*
| Driver | (~) % Impact on CAGR Forecast | Geographic Relevance | Impact Timeline |
|---|---|---|---|
| Consumer shift toward natural and holistic medicine | +1.2% | Global with strength in North America, Europe, India | Medium term (2-4 years) |
| Self-care and preventive health adoption | +0.9% | Global, urban Asia-Pacific and North America | Short term (≤ 2 years) |
| Aging population and chronic disease prevalence | +0.8% | North America, Europe, Japan, China | Long term (≥ 4 years) |
| Regulatory recognition and healthcare integration | +0.7% | India, Brazil, select EU markets | Medium term (2-4 years) |
| E-commerce and digital distribution expansion | +0.6% | Global led by North America and Asia-Pacific | Short term (≤ 2 years) |
| Personalized formulation and combination remedies | +0.5% | North America, Europe, Australia | Medium term (2-4 years) |
| Source: Mordor Intelligence | |||
Consumer Shift Toward Natural and Holistic Medicine
Escalating preference for plant-based and mineral-derived remedies is reshaping portfolios as 80% of surveyed consumers express interest in natural health products, yet familiarity with homeopathy lingers at 60%. Boots’ June 2025 release of 300 wellness SKUs, including homeopathic lines, signals mainstream confidence in category growth.[1] Millennials and Gen Z emphasize transparency and sustainability, prompting brands to spotlight botanical sourcing. Retail shelf gains coexist with knowledge gaps around potentization, inviting scrutiny over efficacy claims. Firms investing in omnichannel education capture outsized share as they translate curiosity into repeat purchase.
Self-Care and Preventive Health Adoption
Combination OTC remedies, expanding at a 6.85% CAGR, illustrate consumer demand for simplified multi-symptom control. Boiron’s Oscillococcinum and Hyland’s Cold’n Cough target flu-like syndromes without consultation, a habit reinforced by pandemic-era telehealth autonomy. Classical practitioners caution that a one-size-fits-all approach dilutes an individualized philosophy. Manufacturers straddle this divide through tiered portfolios that place single remedies in clinic channels and blends in mass retail.
Aging Population and Chronic Disease Prevalence
Geriatric cohorts gravitate to gentler modalities for arthritis, diabetes, and allergies, elevating drops and tinctures that enable precise dosing. India’s 300,000 registered homeopaths often serve as frontline providers in rural areas where allopathic care is scarce.[2] Western insurers mostly exclude coverage, constraining uptake among cost-sensitive seniors, though Germany maintains high familiarity despite funding debates. Long-run growth hinges on longitudinal evidence demonstrating the cost-effectiveness of the approach over polypharmacy.
Regulatory Recognition and Healthcare Integration
India’s National Commission for Homoeopathy Act and the WHO 2025-2034 strategy embed the modality in public health, spurring procurement and insurance pilots. Brazil’s ANVISA code supplies similar clarity. Countervailing forces include Canada’s 2025 front-of-pack disclaimer rule that may cool demand.[3] The net effect remains positive as emerging-market tailwinds outweigh headwinds, though global rollouts must navigate disparate labelling and reimbursement regimes.
Restraints Impact Analysis of Homeopathy Product Market*
| Restraint | (~) % Impact on CAGR Forecast | Geographic Relevance | Impact Timeline |
|---|---|---|---|
| Limited clinical evidence and scientific skepticism | -0.6% | Global, most acute in North America and Western Europe | Medium term (2-4 years) |
| Regulatory fragmentation and reimbursement rollbacks | -0.4% | Europe (France, Germany), North America (Canada, US) | Short term (≤ 2 years) |
| High upfront capital cost for mid-size clinics | -0.3% | Asia-Pacific, Latin America, emerging markets | Medium term (2-4 years) |
| Shortage of qualified practitioners and technicians | -0.2% | North America, Europe, select Asia-Pacific markets | Long term (≥ 4 years) |
| Source: Mordor Intelligence | |||
Limited Clinical Evidence and Scientific Skepticism
The absence of large-scale placebo-controlled trials limits hospital and insurer adoption. FDA’s 2022 risk-based guidance sidelines efficacy considerations, focusing on safety while maintaining a watchlist. Canada’s 2025 disclaimer mandate codifies doubt on retail shelves, and advocacy groups challenge the policy in court. Heel undertakes the rare rigorous program yet faces methodology critiques. Without compelling data, many brands stay confined to OTC aisles and practitioner scripts.
Regulatory Fragmentation and Reimbursement Rollbacks
France halted reimbursement in 2021, shrinking Boiron’s domestic revenue base, while Germany debates statutory coverage, creating uncertainty. The UK ended NHS funding in 2017. Such moves push firms toward self-pay retail where volumes persist but margins narrow. Emerging markets like India and Brazil grant opposite momentum through supportive acts and clear product codes, though average unit prices are lower. Global players juggle premium branding for Western consumers and mass-value SKUs for Asia and Latin America.
*Our forecasts treat driver/restraint impacts as directional, not additive. The impact forecasts reflect baseline growth, mix effects, and variable interactions.
Homeopathy Product Market Segment Analysis
By Product Type:
OTC Leadership and Combination-Remedy MomentumOver-the-counter medicines accounted for 67.02% of the homeopathic product market share in 2025. The segment thrives on mass distribution through Walgreens, Walmart and Boots, reinforced by Hyland’s 2025 rollout into 7,400 new U.S. outlets. OTC expansion aligns with digital education campaigns that deepen shopper confidence and raise basket sizes.
Self-care combination remedies underpin forecast acceleration, advancing at 6.85% CAGR as time-pressed consumers embrace multi-symptom relief. Boiron devoted USD 6.6 million to pediatric cold-and-flu advertising, lifting U.S. channel sales 11.4% year on year. Prescription lines persist in Germany and India where practitioner ecosystems remain influential, but their contribution to the homeopathy product market size shrinks as reimbursement wanes.

By Source:
Plant Dominance and Emerging Animal-Derived NichePlant-based inputs accounted for 60.34% of the value in 2025, thanks to familiarity with Arnica, Belladonna, and Chamomilla. Sustainability narratives and clean-label cues reinforce share across Europe and North America. Mineral remedies maintain a stable demand through practitioner prescriptions.
Animal-based nosodes and sarcodes, though a minority today, are projected to grow at a 9.33% CAGR. Brands like Dr. Reckeweg educate clinicians on chronic-disease protocols, widening acceptance. Ethical sourcing and EU traceability rules introduce cost and reputational hurdles that could moderate growth but have not yet derailed momentum.
By Form:
Liquid Formats Accelerate on BioavailabilityTablets and pellets accounted for 38.05% of 2025 revenue, favored for their portability and long shelf life. Nonetheless, drops and tinctures will outpace all other forms with a 10.93% CAGR, expanding their share of the homeopathy market. Caregivers value rapid absorption and adjustable dosage, key for pediatric and geriatric segments.
Canada’s March 2026 GMP upgrade for liquids raises compliance costs, likely consolidating share among capitalized manufacturers. Hyland’s leverages subscription logistics to sell higher-priced tinctures, offsetting tighter margins in retail tablets.
By Distribution Channel:
Retail Scale Versus Clinic PersonalizationRetail pharmacies retained a 46.28% share in 2025, driven by strong foot traffic and impulse buys, with Boots’ 300-SKU wellness push emblematic of banner confidence. Yet homeopathic clinics are forecast to grow 8.93% CAGR, bolstered by India’s 215 colleges pumping new practitioners into tier-2 and tier-3 cities.
Hybrid models integrate teleconsults and e-commerce fulfilment, blending personalized care with delivery convenience. Direct-to-consumer websites now account for a double-digit share in the United States as subscription economics defeat shelf-space fees.
Geography Analysis
North America Homeopathy Product Market
North America led 2025 revenue at 37.78%, anchored by mature OTC channels and digital subscriptions. United States retailers stock broad assortments, while Canada balances opportunity with a 2025 disclaimer that could mute growth. Mexico remains nascent but benefits from rising wellness spend.
Europe Homeopathy Product Market
Europe shows mixed prospects. Germany’s population familiarity of 95.1% sustains baseline demand despite the coverage debate, and France’s reimbursement cut forces a retail pivot for Boiron. Spain, Italy, and Eastern Europe offer mid-single-digit growth under lighter regulation. Weleda’s Cell Longevity debut in prestige boutiques illustrates premium repositioning.
APAC Homeopathy Product Market
Asia-Pacific is set to climb at 7.03% CAGR, the highest regional rate. India dominates with 300,000 practitioners and INR 3,050 crore federal backing. China sees cautious interest beyond TCM, while Australia’s strict TGA oversight supports premium pricing. Southeast Asian markets open white-space through smartphone-driven telehealth adoption.
Regulatory Landscape
Regulation remains fragmented across major markets, shaping labeling, claims, and manufacturing compliance for homeopathic products. In the United States, the FDA continues to treat homeopathic drug products as drugs and applies a risk-based enforcement approach under its 2022 guidance, emphasizing safety and quality controls rather than a premarket efficacy review; in June 2026, Senators Mike Lee and Tommy Tuberville introduced the Homeopathic Drug Product Safety, Quality, and Transparency Act to create a clearer FDA framework for homeopathic products, highlighting active policy debate on how the category is treated.
In Europe, homeopathic medicinal products operate under Directive 2001/83/EC, which supports simplified registration pathways, with coordination supported through bodies such as the Heads of Medicines Agencies (HMA) Homeopathic Medicinal Products Working Group and EMA guidance on pharmacovigilance and EudraVigilance access. The United Kingdom continues to manage market access via MHRA schemes (Simplified Registration Scheme and National Rules Scheme), and in April 2025 the MHRA updated the National Rules Scheme and labeling guidance for manufacturers and suppliers; the Windsor Framework implementation also affects how authorizations apply across the UK. Across jurisdictions, GMP/CGMP expectations and pharmacopoeial alignment (for example, European Pharmacopoeia standards where applicable) remain central to product quality and cross-border supply continuity.
Competitive Landscape
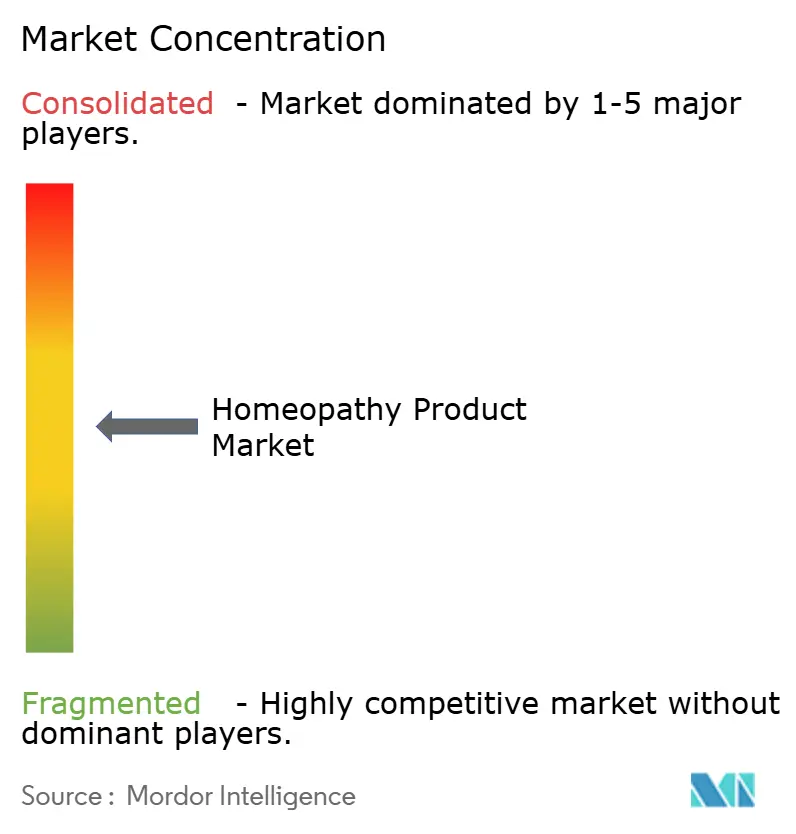
Market structure is moderately concentrated. Boiron, Heel, and Schwabe retain regional strongholds but face fragmentation from India’s multi-hundred-player ecosystem. Digital disruptors raise the bar; Hyland’s USD 40 million funding scaled its Subscribe & Save engine and delivered 15% customer savings, improving stickiness. Weleda’s science-adjacent Cell Longevity line taps affluent wellness seekers.
Clinical validation remains a weak flank; Heel’s Traumeel studies help hospital acceptance yet confront methodological critiques. Tightening GMP rules in Canada and anticipated copycats in Europe signal impending consolidation favoring well-capitalized manufacturers with ISO certifications such as SBL. Blockchain provenance pilots aim to combat the proliferation of counterfeits in open e-commerce channels.
Homeopathy Product Industry Leaders
-
A Nelson & Co Ltd.
-
Biologische Heilmittel Heel GmbH
-
Boiron
-
Dr. Willmar Schwabe GmbH
-
SBL World Pharmaceuticals
- *Disclaimer: Major Players sorted in no particular order
Homeopathy Product Market Companies Covered in this Report
- A. Nelson & Co. Ltd
- Adonis Laboratories Pvt. Ltd
- Ainsworths Ltd
- Allen Homeopathy
- Archibel SA (RadarOpus)
- Bhandari Homoeopathic Laboratories
- Biologische Heilmittel Heel
- Boericke & Tafel
- Boiron
- Dr. Willmar Schwabe GmbH
- Hahnemann Laboratories Inc.
- Homeocan Inc.
- Hyland’s (Standard Homeopathic)
- Mediral International
- Pekana Naturheilmittel
- Sanat Products Ltd.
- SBL World Pharmaceuticals
- Similia Research Laboratories
- Weleda
Market Opportunities and Future Outlook
Quality-led differentiation and export readiness are expanding whitespace for manufacturers that can document robust controls across raw materials and dosage forms, particularly liquids. India provides a concrete anchor: the Bureau of Indian Standards (BIS) enforced new mandatory quality standards for homeopathic medicine manufacturing effective April 30, 2026, covering areas such as raw materials, mother tinctures, and lactose, and in February 2026 Adven Biotech reported obtaining NABL certification for its quality control laboratories. These steps raise the bar for compliant suppliers and support premiumization and institutional acceptance in channels that prioritize verifiable quality, including clinic networks and regulated retail.
Digital and professional-channel enablement is another near-term avenue, especially where homeopathic clinics and practitioner ecosystems influence purchasing. In July 2026, Bhargava Phytolab launched a Direct to Doctor (D2D) digital platform aimed at verified homeopathic practitioners, signaling investment in practitioner-facing distribution and engagement rather than purely consumer-led e-commerce. At the same time, policy changes in high-scrutiny markets can affect how brands structure portfolios and claims: the June 2026 US Senate bill proposing an FDA approval framework brings renewed attention to standard-setting, while companies operating in Europe and North America continue to balance homeopathic lines with adjacent wellness categories (dietary supplements, probiotics, microbiome-oriented products) to fit retailer requirements and consumer expectations amid skepticism and reimbursement constraints.
Recent Industry Developments in Homeopathy Product Market
- June 2026: Boiron USA partnered with former MLS player Sebastien Le Toux to promote its Arnicare brand around performance recovery during the FIFA World Cup 2026. The collaboration supports mass-market awareness for topical homeopathic products in North America and ties brand visibility to a major global event.
- February 2026: The US FDA issued a warning letter to A. Nelson & Co. Ltd. following a September 2025 inspection of its London, UK facility, citing CGMP violations including inadequate microbial testing and unsupported shelf-life extensions. The action elevates compliance risk for imported homeopathic medicines and can prompt remediation costs, supply disruption, and channel scrutiny.
- August 2024: Boiron USA confirmed a new logistics center in Newtown Square, Pennsylvania, to streamline warehousing and nationwide delivery. The facility strengthens fulfillment capability for retail and direct-to-consumer shipments, supporting faster replenishment and broader distribution coverage.
Homeopathy Product Market Report Scope and Research Methodology
Market Definition and Coverage
This market covers sales of homeopathy products that are bought and used for homeopathic care, across retail and professional channels, and counted in value terms in USD at the point of sale.
Scope exclusions: We exclude non-homeopathic supplements, general herbal OTC products, and clinical services or consultations when they are billed separately from product sales.
Segments Covered in This Report
- By Product Type
- OTC Homeopathic Medicines
- Prescription Homeopathic Medicines
- Self-care Combination Remedies
- By Source
- Plant-based
- Mineral-based
- Animal-based
- Biochemic
- By Form
- Liquid Dilutions
- Tablets & Pellets
- Drops & Tinctures
- Ointments & Creams
- Powders
- By Distribution Channel
- Retail Pharmacies
- Homeopathic Clinics
- Other Distribution Channels
- By Geography
- North America
- United States
- Canada
- Mexico
- Europe
- Germany
- United Kingdom
- France
- Italy
- Spain
- Rest of Europe
- Asia-Pacific
- China
- Japan
- India
- Australia
- South Korea
- Rest of Asia-Pacific
- Middle East & Africa
- GCC
- South Africa
- Rest of Middle East & Africa
- South America
- Brazil
- Argentina
- Rest of South America
- North America
Data Sources, Market Sizing, and Validation
Desk Research
Desk work starts by mapping where demand shows up in public data and how products are classified in each region. We rely on sources such as World Health Organization publications on traditional and complementary medicine, national health ministry and regulator releases where homeopathic products are registered, and national statistics offices for population and health spending indicators.
Trade and availability signals are then checked using sources such as UN Comtrade, customs tariff schedules and import export summaries, and selected peer reviewed journals that discuss usage, preference, and treatment patterns. We also review company annual reports, investor presentations, and credible press coverage to confirm product priorities and channel expansion, and we use paid subscriptions for company financials and intelligence plus patent databases to validate innovation and brand pipeline activity. The sources listed here are illustrative only, and many other public references were also used to collect data, validate assumptions, and clarify open questions.
Primary Interviews and Surveys
Primary work was used to sanity check the demand pool and pricing logic by speaking with distributors, retail channel stakeholders, and product managers, followed by a cross check with practitioners and healthcare adjacent respondents. Coverage was balanced across APAC, EMEA, and the Americas so regional differences in regulation, consumer preference, and product mix could be reflected in the final model.
Distribution of primary research fieldwork respondents
| Company type | Respondent position | Region |
|---|---|---|
| Top tier: 37% | CXOs: 13% | APAC: 50% |
| Mid tier: 43% | Functional/Unit leaders: 41% | EMEA: 31% |
| Smaller Players: 20% | Managers: 46% | Americas: 19% |
Market-Sizing & Forecasting
Sizing was built using top-down and bottom-up logic in a practical order. The top-down approach used region level demand pool reconstruction, where population, consumer health spend direction, homeopathy adoption indicators, and channel availability were translated into product demand, then adjusted for price bands and mix by formulation.
To keep totals realistic, selective bottom-up checks were added using sampled price points for common formats (such as tinctures, dilutions, tablets, and topical forms), combined with channel splits and indicative volume movement discussed in interviews. When data was thin for a country or a niche application, the gap was handled by using a closest comparable market with a clear adjustment for regulation intensity, affordability, and retail reach, and then the estimate was revisited with expert feedback.
For forecasting, we used scenario analysis supported by trend inputs that could be tracked each year, including changes in product registrations, consumer preference shifts toward alternative care, expansion of pharmacy and e-commerce reach, inflation linked price progression, and regional policy signals affecting labeling and sale. Assumptions were kept simple so they can be re-run quickly as new signals come in.
Data Validation & Update Cycle
Outputs were checked against independent signals like trade movement direction, country level health spending trends, and reported channel expansion, and then any large variances were reviewed before sign off. If a number looked out of line, we traced it back to the specific input (price, mix, adoption, or channel share), and we either corrected it or re-contacted sources for clarification.
Each report is refreshed annually, and interim updates are done when a material event can change demand or pricing assumptions, such as policy shifts or major distribution changes. Before delivery, the latest public releases are reviewed again so clients receive an updated view rather than an older snapshot.
Mordor Intelligence's Homeopathy Product Market Size Compared Against Other Published Estimates
Published market sizes for homeopathy products do not always match because the scope and the year used as the anchor point can be different, even when the category name looks the same. Differences also come from how pricing is treated, how fast growth is assumed, and whether the model is validated with on-the-ground checks.
The main gap drivers in this market are whether adjacent alternative remedies are mixed into the total, whether value is counted at manufacturer level or retail level, and how product forms are grouped when converting volumes into revenue. Another common spread comes from aggressive long-range CAGR assumptions that do not stay consistent with registration trends, channel constraints, and country level affordability, which is why we keep forecast steps tied to observable indicators and then re-check them with practitioners and channel respondents.
Benchmark comparison
| Source | Market Size | Gaps in Research Methodology |
|---|---|---|
| Mordor Intelligence | USD 13.02 B (2026) | |
| Global Consultancy A | USD 11.97 B (2025) | Uses a different base year and applies a faster long-range growth curve, and the public summary does not clearly show if values are taken at retail pricing or closer to manufacturer realizations by region. |
| Industry Publisher B | USD 14.99 B (2024) | Anchors the model earlier and appears to apply stronger price and volume expansion assumptions over the horizon, with limited clarity on how product form mix and channel level pricing are normalized across countries. |
The spread is mainly explained by the anchor year plus how pricing and product mix are standardized before projecting forward, and these differences compound quickly in long forecasts. When revenue is counted only for homeopathy products sold through tracked channels and prices are normalized by formulation and region before the forecast is extended, the totals stay closer to observable demand signals, which is why the 2026 anchor differs here for Mordor Intelligence.
Key Questions Answered in the Report
How large will the homeopathy product market be by 2031?
It is projected to reach USD 16.65 billion by 2031 at a 5.04% CAGR.
Which product type is growing fastest?
Drops and tinctures are forecast to expand at 10.93% CAGR on bioavailability advantages.
Why is Asia-Pacific considered the most attractive region?
India’s practitioner density, supportive regulation and rising disposable incomes push the region toward a 7.03% CAGR.
What is driving OTC dominance?
Retail accessibility and consumer comfort with self-medication keep OTC products at 67.02% market share in 2025.
How are companies addressing evidence gaps?
Leaders like Heel invest in clinical trials, while others focus on consumer education and regulatory compliance to build credibility.