
Home Infusion Market Size and Share
Market Overview
| Study Period | 2020 - 2031 |
|---|---|
| Market Size (2026) | USD 27.58 Billion |
| Market Size (2031) | USD 37.12 Billion |
| Growth Rate (2026 - 2031) | 6.12 % |
| Fastest Growing Market | Asia Pacific |
| Largest Market | North America |
| Market Concentration | Medium |
Major Players *Disclaimer: Major Players sorted in no particular order Image © Mordor Intelligence. Reuse requires attribution under CC BY 4.0. | |
Home Infusion Market Analysis by Mordor Intelligence
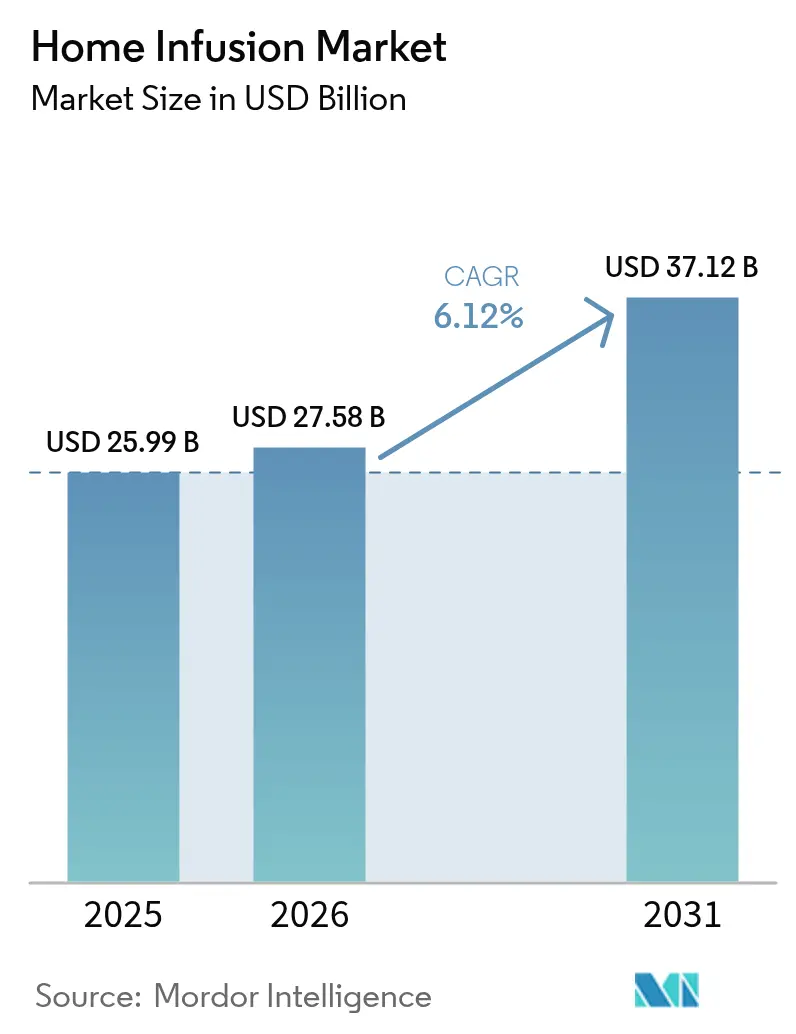
The home infusion market size in 2026 is estimated at USD 27.58 billion, growing from 2025 value of USD 25.99 billion with 2031 projections showing USD 37.12 billion, growing at 6.12% CAGR over 2026-2031. Demand growth is rooted in the migration of complex care from hospitals to residences, a shift encouraged by the Medicare home-infusion benefit and similar payer reforms that now reimburse professional services, equipment, and supplies delivered at home. Portable pump innovations, artificial‐intelligence monitoring, and expanding biologics pipelines further widen clinical indications that can be managed outside institutional settings. North America remains the revenue anchor on the strength of mature reimbursement structures and national provider networks; Asia-Pacific, however, outpaces every other region as healthcare infrastructure investments and rapid population aging converge. Market fragmentation persists, with more than 800 independent operators creating consolidation opportunities that private equity firms pursue to secure scale advantages in nursing coverage, supply purchase, and technology deployment. Nevertheless, recurring revenue profiles and strong clinical outcomes sustain aggressive capital allocation by large strategics and financial sponsors alike.
Key Report Takeaways
- By product, infusion pumps held 49.60% of the home infusion market share in 2025, while portable pumps are projected to expand at an 10.7% CAGR through 2031.
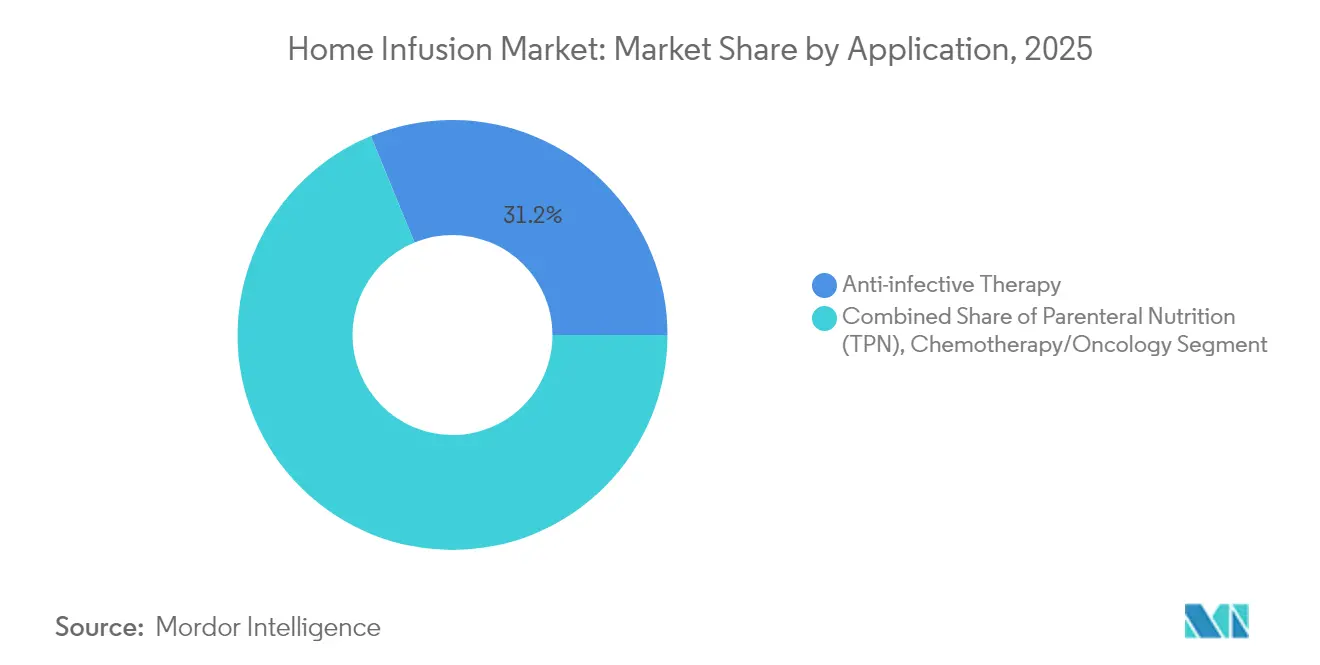
- By application, anti-infective therapy led with 31.20% revenue share in 2025; chemotherapy infusion is poised to grow at a 10.12% CAGR to 2031.
- By end user, home-care settings commanded 61.80% of the home infusion market size in 2025, whereas ambulatory infusion centers are forecast to rise at a 9.41% CAGR over the same period.
- By geography, North America accounted for 51.85% of the home infusion market size in 2025, and Asia-Pacific is set to post the highest regional CAGR at 8.74% between 2026 and 2031.
Note: Market size and forecast figures in this report are generated using Mordor Intelligence’s proprietary estimation framework, updated with the latest available data and insights as of 2026.
Market Trends and Insights
Drivers Impact Analysis of Home Infusion Market*
| Driver | (~) % Impact on CAGR Forecast | Geographic Relevance | Impact Timeline |
|---|---|---|---|
| Aging population and chronic-disease burden | +1.80% | Global; highest in Asia-Pacific and North America | Long term (≥ 4 years) |
| Uptake of home care to cut hospital costs | +1.50% | North America & Europe; spreading to Asia-Pacific | Medium term (2-4 years) |
| Expansion of Medicare home-infusion benefit | +1.20% | United States; spillover to Canada | Short term (≤ 2 years) |
| Growth of subcutaneous biologics suited for ambulatory pumps | +0.90% | Global; strongest in developed markets | Medium term (2-4 years) |
| AI-driven remote pump monitoring and predictive maintenance | +0.60% | North America & Europe first, Asia-Pacific next | Long term (≥ 4 years) |
| Private-equity funding surge for ambulatory infusion centers | +0.40% | North America; selective EU markets | Short term (≤ 2 years) |
| Source: Mordor Intelligence | |||
Aging Population and Chronic-Disease Burden Population
Aging reshapes care-delivery priorities, with the United Nations projecting the global 65-plus cohort to reach 1.6 billion by 2050. Two-thirds of these seniors will live in Asia, intensifying demand for chronic-disease therapies that can be administered outside hospitals. In Europe, new cancer cases climbed to 3.2 million in 2022, while treatment spending doubled to EUR 146 billion in 2023. The clinical load drives sustained uptake of portable and elastomeric pumps that support immunotherapy, parenteral nutrition, and long-term antibiotic regimens. Stakeholders view precise home delivery as a counterbalance to hospital bed shortages and budget pressures, solidifying the growth outlook for the home infusion market.
Uptake of Home Care to Cut Hospital Costs
Payers increasingly reward home-based delivery because it trims facility overhead, shortens inpatient stays, and improves patient satisfaction. The 2025 home health update raised Medicare reimbursement for home health agencies by 2.7%, reinforcing the economics of shifting infusion services away from hospitals. COVID-19 accelerated this migration, and specialty infusion expenditures grew 38% in 2023, a trend projected to continue as high-cost cell and gene therapies enter commercial rollout[1]. Private-equity investment mirrors these incentives; Court Square Capital Partners’ stake in Soleo Health underlines financial confidence in scalable home infusion platforms. As health systems rationalize site-of-care mix, infusion providers that demonstrate outcomes equivalence at lower total cost gain preferred-network status.
Expansion Of Medicare Home-Infusion Benefit
Since January 2021, Medicare has reimbursed professional services, equipment, and supplies for qualifying drugs delivered at home. Policy refinements in 2025 set an IVIG rate of USD 431.83, establishing predictable economics for specialty immunology therapies. The benefit’s structure obliges suppliers to meet quality metrics, prompting investment in trained nursing staff, smart pumps, and electronic documentation. Commercial payers and state Medicaid programs typically align with Medicare precedent, producing a multiplier effect that broadens addressable volumes for accredited providers. Consequently, the home infusion market gains a powerful reimbursement backbone that supports scale expansion.
Private-Equity Funding Surge for Ambulatory Infusion Centers
Financial sponsors view infusion centers as infrastructure-light assets with predictable cash flows. Growth equity fuels greenfield builds and tuck-in acquisitions that broaden payer contracts and therapy portfolios. The strategy is most visible in the United States, where roll-up platforms assemble regional networks to capture specialty biologic volumes. Select European markets show similar traction as payer reforms reward nonhospital settings. Capital inflows shorten technology adoption cycles and raise competitive stakes, propelling the home infusion market toward modernization.
Restraints Impact Table of Home Infusion Market*
| Restraint | (~) % Impact on CAGR Forecast | Geographic Relevance | Impact Timeline |
|---|---|---|---|
| High acquisition and maintenance cost of infusion pumps | -0.80% | Global; acute in price-sensitive emerging markets | Medium term (2-4 years) |
| Device-related adverse events and recalls | -0.60% | Global; regulatory focus in North America, Europe | Short term (≤ 2 years) |
| Home-care nursing shortages constraining capacity | -1.10% | North America & Europe; visible in Asia-Pacific | Long term (≥ 4 years) |
| Fragmented payer rules delaying reimbursement | -0.70% | United States; variable in EU | Medium term (2-4 years) |
| Source: Mordor Intelligence | |||
High Acquisition and Maintenance Cost of Infusion Pumps
Advanced pumps blend mechanical precision with complex software, raising up-front capital needs and ongoing service fees. Smaller operators struggle to fund the latest smart models, encouraging partnership with third-party engineering firms such as Prescott’s, which Morgan Stanley Capital Partners acquired to improve device uptime across provider sites. Regulatory demands for cybersecurity patches and firmware validation add recurring expense that only scaled enterprises can absorb readily. Consequently, cost hurdles slow technology, refresh rates in emerging markets and intensify consolidation pressure in mature geographies.
Device-related Adverse Events and Recalls
Product recalls jeopardize clinician confidence and impose logistics costs. In April 2025 the FDA warned ICU Medical for software modifications made without proper 510(k) clearance, signaling strict oversight of post-market changes that might affect pump performance. Providers must allocate resources to track serial numbers, retrain staff, and swap devices to comply with corrective actions, all of which eat into operating margins. Negative publicity can also disrupt payer relationships, temporarily dampen equipment demand, and restrain the home infusion market.
*Our forecasts treat driver/restraint impacts as directional, not additive. The impact forecasts reflect baseline growth, mix effects, and variable interactions.
Home Infusion Market Segment Analysis
By Product:
Pumps Drive Adoption Across Delivery ModesInfusion pumps captured 49.60% of 2025 revenue, cementing their role as the backbone of home dosing accuracy. Portable models, favored for their compact designs and intuitive interfaces, are projected to log an 10.7% CAGR to 2031. The home infusion market size for portable pumps is therefore set to expand far faster than legacy large-volume models, which still serve patients discharged with high-flow hydration or nutrition needs. Elastomeric pumps, which operate without external power, earn physician support in outpatient antimicrobial therapy thanks to proven cost savings of EUR 4,031 per episode when refill programs are deployed. Smart connectivity functions further differentiate premium units by enabling clinicians to adjust parameters remotely and create audit trails that satisfy payer audits. Consumables such as IV sets and antimicrobial filters ride the installed-base wave, yielding recurring revenue streams that buttress manufacturers' financial models.
Growth momentum ripples across adjunct categories as well. Patient-controlled analgesia units improve post-operative recovery at home by aligning opioid dosing with real-time pain scores, thereby reducing hospital readmissions. Insulin patch pumps combine continuous glucose sensing with closed-loop algorithms; early data show improved glycemic control yet adoption lags due to device cost and patient-training requirements. Software updates remain a regulatory flashpoint: the April 2025 FDA warning to ICU Medical exemplifies the compliance expectations that manufacturers must meet when enhancing user interfaces or wireless protocols. Overall, product innovation anchors revenue growth, reinforcing the competitive weight of firms that can integrate electromechanical reliability with cloud analytics.


By Application:
Anti-Infective Leads, Oncology AcceleratesAnti-infective therapy continues to hold 31.20% of total revenue as outpatient parenteral antimicrobial therapy programs become standard in tertiary-care discharge pathways. The home infusion market share for anti-infectives reflects stable demand for long-tail regimens treating osteomyelitis, endocarditis, and resistant urinary tract infections. Adoption is most pronounced in North America and Europe, where antibiotic stewardship protocols support in-home monitoring via telehealth consultations. Concurrently, chemotherapy infusion stands out as the fastest-expanding indication, projected to grow 10.12% annually through 2031. Subcutaneous monoclonal antibodies and targeted therapies that require monthly or quarterly dosing align perfectly with patient desires to avoid hospital settings; Eisai’s LEQEMBI illustrates this paradigm shift.
Parenteral nutrition remains essential for short-bowel syndrome and cancer cachexia, while hydration therapy is gaining ground for chronic heart-failure and geriatric dehydration management. Pain and analgesia segments profit from on-demand dosing pumps that reduce systemic opioid exposure. Endocrinology applications such as continuous insulin infusion are pinpointed as an under-penetrated frontier: only a fraction of eligible diabetics use pumps despite documented HbA1c improvements. Specialty biologics for primary immunodeficiencies and rare diseases augment the long-tail revenue profile, commanding premium pricing that offsets their low patient numbers. Because each indication imposes unique stability, sterility, and monitoring parameters, providers specializing in complex therapies often secure durable network partnerships.
By End User:
Home Dominance, Center MomentumHome settings contributed 61.80% of 2025 revenue, underscoring enduring patient preference for familiar surroundings and caregiver support. The home infusion market size linked to home environments draws power from reimbursement parity with hospital outpatient departments and from positive patient outcomes tracked through electronic symptom diaries. Ambulatory infusion centers, though still smaller in absolute terms, are on course for a 9.41% CAGR. They appeal to oncologists and rheumatologists who seek controlled clinical environments without the overhead of inpatient facilities. FDA approvals for over 30 cell and gene therapies amplify demand for centers equipped with negative-pressure rooms and advanced handling protocols, stimulating facility upgrades across metropolitan corridors.
Hospital outpatient departments retain relevance for high-acuity patients needing immediate crash-cart backup or radiologic surveillance. Specialty pharmacies continue integrating infusion bays to capture vertical value in dispensing high-cost biologics. Option Care Health, which operates 177 US locations, demonstrates how geographic breadth underpins service-level guarantees and results in 16.3% revenue growth during Q1 2025. Private equity consolidation of mid-sized centers accelerates network density, raising payer negotiating leverage and fostering standardized clinical protocols. Providers collectively advance toward hybrid care models, assigning each therapy to the most cost-effective, patient-appropriate venue.

Geography Analysis
North America Home Infusion Market
North America commands 51.85% of global revenue, powered by Medicare’s robust home infusion benefit and a dense web of accredited suppliers. The United States alone could redirect up to USD 265 billion of facility spend to home settings by 2025, according to policy analysts, giving the home infusion market size unparalleled expansion leeway. Canada’s provincial systems adopt similar care-migration strategies, while Mexico’s private insurers introduce bundled home-infusion packages to court its growing middle class. Device manufacturers prioritize UL-listed products and cybersecurity features to align with stringent FDA and Health Canada requirements, which in turn nurture clinician confidence.
APAC Home Infusion Market
Asia-Pacific exhibits the fastest regional CAGR at 8.74% through 2031. Rapid population aging, rising chronic-disease prevalence, and infrastructure investments under the Asian Infrastructure Investment Bank's health strategy form a potent triad of growth drivers. China’s Healthy China 2030 policy elevates home-based chronic-care modalities, creating an addressable market that attracts both local pump makers and multinationals. Japan, already a super-aged society, expands its long-term insurance program to subsidize infusion equipment rentals, while South Korea pioneers AI-enabled pump oversight through nationwide 5G networks. In South and Southeast Asia, pharmaceutical production clusters in India and Singapore localize supply chains, trimming import duties and shortening lead times.
Europe Home Infusion Market
Europe presents heterogeneity in reimbursement but benefits from the European Medicines Agency’s centralized drug approvals. Germany and France implement national home-infusion formularies under social-insurance umbrellas; the United Kingdom’s National Health Service pilots “out-of-hospital chemotherapy” that leverages local nursing agencies. Southern and Eastern European countries lag due to budget constraints, though EU regional funds occasionally subsidize digital-health adoption.
MEA and South America Home Infusion Market
The Middle East and Africa remain nascent yet promising. Gulf Cooperation Council nations, led by Saudi Arabia and the United Arab Emirates, invest in smart-hospital and home-care ecosystems powered by high broadband penetration. Sub-Saharan Africa sees sporadic pilot programs for HIV and tuberculosis home therapy, but infrastructure deficits and reimbursement gaps limit scale. In South America, Brazil and Argentina spearhead adoption, driven by demographic shifts and expanding private insurance. Currency volatility, however, raises equipment prices, necessitating creative financing solutions such as vendor leasing and outcome-based contracts.

Regulatory Landscape
Regulation for home infusion is shaped by medical device controls on pumps and payer rules governing in-home professional services. In the United States, infusion pumps (including Alternate Controller Enabled pumps under 21 CFR 880.5730) are generally Class II devices subject to special controls, and connected pumps face heightened scrutiny for cybersecurity documentation under section 524B of the FD&C Act. FDA oversight also extends to post-market software changes, highlighted by the April 2025 FDA warning to ICU Medical regarding software modifications made without proper 510(k) clearance.
Quality management and conformity assessment requirements continue to converge across major markets. The FDA issued a final rule in February 2024 to harmonize its device Quality System Regulation with ISO 13485:2016, with the aligned framework taking effect on February 2, 2026. The European Union continues implementing Regulation (EU) 2017/745 (MDR) for device safety and conformity assessment (in force in 2026). On the services side, CMS sets Medicare conditions and payment structures that influence which infusion therapies qualify for home administration, and accrediting organizations for home infusion therapy must maintain standards that meet or exceed applicable Medicare requirements as determined by CMS.
Value Chain Analysis
The home infusion value chain spans (1) drug and biologics manufacturers supplying specialty therapies, (2) device OEMs and component suppliers providing infusion pumps, IV administration sets, and accessories, (3) specialty pharmacies and home infusion providers that compound, dispense, and coordinate care, (4) nursing and clinical support networks that deliver in-home administration and monitoring, and (5) cold-chain and last-mile logistics partners that distribute temperature-sensitive medications and disposables to patients. Reimbursement architecture, particularly CMS home infusion therapy payment rules for qualifying drugs that require an external infusion pump, shapes how providers bundle professional services, equipment rental, and supplies into commercially viable care episodes.
Key friction points center on supply continuity and cost volatility for disposable components and device maintenance. Industry sources describe persistent inflationary pressure, manufacturing delays, and raw material constraints (including silicone and petrochemical-derived inputs) that can tighten availability of high-turn consumables, while transportation disruptions amplify lead-time variability. Consolidation also influences upstream bargaining and inventory resilience; for example, ICU Medicals July 2024 acquisition of Smiths Medical broadened infusion therapy portfolio depth and can change sourcing leverage, standardization of pump fleets, and service coverage across provider networks.
Competitive Landscape
The home infusion market features more than 800 independent companies, reflecting a historically low barrier to entry for licensed pharmacies and nursing agencies. Market leaders leverage vertical integration, owning compounding pharmacies, logistics fleets, and nursing pools to protect margins against reimbursement compression. Technology differentiation also secures competitive moats; BrightSpring Health Services lifted infusion and specialty prescriptions by 22% between December 2023 and December 2024 by integrating e-prescribing, telepharmacy, and AI-based therapy monitoring[3].
Private equity sponsors accelerate consolidation, executing roll-up strategies that aggregate regional players into national or multi-state platforms. These investors inject capital for pump fleet upgrades, cybersecurity hardening, and payer-contract analytics, thereby raising operational sophistication. Device manufacturers such as Becton Dickinson, which announced a corporate separation to sharpen its focus on medication delivery and advanced monitoring, hedge against pump commoditization by bundling software services and analytics dashboards.
Emerging disruptors include specialty pharmacies integrating infusion suites to capture high-margin orphan-drug revenues and med-tech startups offering predictive maintenance for pumps. Competitive intensity remains high but tilts toward scaled entities that can weather regulatory scrutiny, nursing shortages, and cybersecurity demands.
Home Infusion Industry Leaders
-
Option Care Health
-
Coram CVS Health
-
Baxter International
-
Fresenius Kabi
-
ICU Medical
- *Disclaimer: Major Players sorted in no particular order

Home Infusion Market Companies Covered in this Report
- Baxter
- B. Braun
- Fresenius
- ICU Medical
- Smiths Group
- Option Care Health
- Coram CVS Health
- UnitedHealth/Optum Infusion
- Terumo Corp.
- Medtronic
- Moog Medical
- Nipro Corp.
- Beckton Dickinson
- CareFusion (BD)
- Apria Healthcare
- Aveanna Healthcare
- InfuSystem Holdings
- KabaFusion
Market Opportunities and Future Outlook
Opportunities cluster around supply-chain resiliency, compliant digitalization of home infusion workflows, and scaling higher-acuity therapies outside institutional sites of care. In the United States, the Medicare home infusion therapy benefit continues to expand the reimbursed service footprint for in-home administration of qualifying drugs and biologicals that require an external infusion pump, creating whitespace for providers that can reliably staff nursing visits and document quality metrics. On the technology side, demand for connected pumps and remote monitoring supports investments in cybersecurity-by-design and validated software change control, aligning with the FDAs tighter posture on post-market modifications and its incorporation of ISO 13485:2016 into the QMSR that takes effect in February 2026.
Capacity investments in adjacent inputs and distribution are also opening room for more dependable in-home therapy execution. In July 2026, Otsuka ICU Medical LLC announced an over USD 500 million expansion of IV solutions manufacturing in the United States, including a new facility and upgrades in Austin, Texas, which is intended to increase domestic output for foundational infusion supplies and non-DEHP innovation. On the distribution side, Cencoras November 2025 plan for a USD 1 billion investment through 2030, including a new distribution center in Fontana, California (targeted operational timing fall 2026), signals continued buildout of US pharma logistics capacity that supports specialty therapy availability and replenishment cadence for home infusion providers.
Recent Industry Developments in Home Infusion Market
- April 2026: Coram CVS Specialty Infusion Services transitioned to recyclable and compostable packaging for temperature-sensitive medications at pharmacies in Mendota Heights, Minnesota, Malvern, Pennsylvania, and San Diego. The shift reduces dependence on legacy EPS materials and changes cold-chain fulfillment operations that affect cost-to-serve and patient delivery experience.
- August 2025: Option Care Health formed a strategic relationship with Quince Therapeutics to support administration of Quince's lead asset, eDSP, through specialty infusion services. The agreement expands Option Care Healths therapy services footprint for emerging specialty programs and reinforces the role of national home infusion networks in clinical trial to commercialization pathways.
- January 2024: Option Care Health announced a multi-year partnership with Palantir Technologies to deploy Palantirs Artificial Intelligence Platform across nurse scheduling, patient onboarding, and supply chain execution. The initiative formalizes enterprise-level digital workflow optimization, addressing nursing capacity constraints while improving coordination of pumps, supplies, and medication deliveries.
Home Infusion Market Report Scope and Research Methodology
Market Definition and Coverage
For this study, the market covers the revenue linked to infusion therapies delivered in a patient residence, where prescription drugs or biologics are administered mainly through IV or subcutaneous routes, along with the related equipment and support services needed to complete the home episode of care.
Scope exclusions: Infusion or parenteral therapies given in hospitals, physician office suites, and ambulatory infusion centers are excluded.
Segments Covered in This Report
- By Product
- Infusion Pumps
- Large-volume pumps
- Syringe pumps
- Elastomeric pumps
- Insulin pumps
- Patient-controlled analgesia (PCA) pumps
- IV Administration Sets
- Accessories & Disposables
- Infusion Pumps
- By Application
- Anti-infective Therapy
- Parenteral Nutrition (TPN)
- Chemotherapy/Oncology
- Hydration Therapy
- Pain & Analgesia Management
- Endocrinology
- Other Applications
- By End User
- Home-care Settings
- Ambulatory Infusion Centers
- Hospital Out-patient Departments
- Specialty Pharmacies
- By Geography
- North America
- United States
- Canada
- Mexico
- Europe
- Germany
- United Kingdom
- France
- Italy
- Spain
- Rest of Europe
- Asia Pacific
- China
- Japan
- India
- South Korea
- Australia
- Rest of Asia Pacific
- Middle East and Africa
- GCC
- South Africa
- Rest of Middle East and Africa
- South America
- Brazil
- Argentina
- Rest of South America
- North America
Data Sources, Market Sizing, and Validation
Desk Research
Desk work starts by aligning basic definitions, care setting boundaries, and the main demand signals that can be tracked consistently over time. We refer to public health statistics and utilization indicators from sources such as the US CDC, the US Centers for Medicare and Medicaid Services, the US FDA, and the OECD, and we also review peer reviewed clinical literature to understand which therapies are increasingly shifting to the home.
To keep the model practical, we also collect secondary inputs from company filings and investor presentations, payer and provider publications, and reputable press coverage of home based care. Where needed, a paid subscription for company financials and intelligence, along with a patent database, is used to confirm product pipelines and approximate revenue exposure to home infusion workflows. These desk sources are illustrative, and we use additional public references to collect data, validate assumptions, and clarify open questions.
Primary Interviews and Surveys
Primary work is used to test the desk assumptions against how the home infusion market operates across regions, especially around what is billed as drug value versus services and supplies. We speak with therapy providers, distributors, device and consumables participants, and clinical stakeholders, and then we validate the split between home episodes and non home settings across APAC, EMEA, and the Americas.
Distribution of primary research fieldwork respondents
| Company type | Respondent position | Region |
|---|---|---|
| Top tier: 33% | CXOs: 17% | APAC: 43% |
| Mid tier: 48% | Functional/Unit leaders: 34% | EMEA: 32% |
| Smaller Players: 19% | Managers: 49% | Americas: 25% |
Market-Sizing & Forecasting
Sizing is built using a top down approach where therapy volumes and home care utilization signals are converted into a value pool by applying realistic pricing and mix assumptions, and then checked against selective bottom up roll ups. The bottom up work is used as a sense check through sampled provider revenue ranges, consumables intensity per episode, and a few channel checks on pump and disposables demand.
Key inputs include the share of infusion eligible therapies handled at home, growth in chronic disease treatment volumes that commonly require infusion, reimbursement and payer coverage shifts, average therapy duration and visit frequency, and the equipment and disposables attach rate per patient episode. When a country has limited disclosure, we handle gaps by using proxy indicators such as healthcare spend patterns, home healthcare penetration, and comparable therapy mix from similar markets, before adjusting through expert feedback.
For forecasting, we rely on multivariate regression combined with scenario analysis so the model can reflect changes in home care adoption, treatment mix, and pricing pressure without forcing one linear trend. The final path is chosen after reconciling physician preference, payer policy direction, and capacity readiness discussed in interviews, which helps keep the yearly curve realistic.
Data Validation & Update Cycle
Outputs are validated through multiple checks so any unusual jumps are explained before sign off. We compare totals against independent signals such as home healthcare utilization trends, therapy class growth, and device and disposables demand patterns, and then we review currency conversions and inflation assumptions to keep values consistent across regions.
A second analyst review is completed to challenge key inputs, and re contacts are triggered when variance is material or when a scope boundary is unclear in one geography. The report is refreshed annually, and interim updates are made when material events occur, such as reimbursement changes or major shifts in home care delivery. Before delivery, a final pass is done so clients receive the latest updated view.
Mordor Intelligence's Home Infusion Market Size Compared With Other Published Estimates
Published market values for home infusion can look far apart, even when the topic name is the same, because the boundaries are not always consistent. The biggest differences usually come from what is counted as home, whether drug value is included, and how service fees, supplies, and device rentals are treated in the final total.
By tracking setting of care rules and refreshing the inclusion logic each update, Mordor Intelligence counts only home based infusion episodes (including drugs or biologics, pumps, disposables, and support fees) and avoids mixing in hospital, physician office, or ambulatory infusion center activity, which is a common reason totals inflate or deflate across publishers.
Benchmark comparison
| Source | Market Size | Gaps in Research Methodology |
|---|---|---|
| Mordor Intelligence | USD 27.58 B (2026) | |
| Industry Research Publisher A | USD 38.66 B (2024) | Uses a different base year and does not clearly separate the home setting from adjacent infusion sites in the public summary, which can expand the demand pool beyond home episodes. |
| Market Research Publisher B | USD 38.63 B (2024) | Includes broad product and service buckets by application and reports a longer horizon, and the public scope does not specify exclusions for non home infusion centers, which can lift the starting value. |
The spread in the table is mainly explained by care setting boundaries and year choice, and then by whether drug value and service components are bundled the same way. When the scope is kept tight to the home episode and the price and mix assumptions are checked with practitioners, the final number becomes easier to trace back to a repeatable set of inputs.
Key Questions Answered in the Report
What is the current value of the home infusion market?
The home infusion market is valued at USD 27.58 billion in 2026 and is projected to reach USD 37.12 billion by 2031.
Which product category generates the highest revenue?
Infusion pumps hold the largest share at 49.60% of 2025 revenue, with portable pumps expected to post the fastest 10.7% CAGR through 2031.
Which clinical application is growing the quickest?
Chemotherapy infusion is the fastest-expanding application, advancing at a 10.12% CAGR from 2026 to 2031 as oncology care shifts to outpatient and home settings.
How significant is home-care as an end-user segment?
Home-care settings account for 61.80% of 2025 revenue, reflecting both patient preference and payer incentives that reward care delivered outside hospitals.
Which region is forecast to grow the most rapidly?
Asia-Pacific is set to register the highest regional growth, increasing at a 8.74% CAGR between 2026 and 2031 due to rapid population aging and infrastructure investment.