
Technology, Media and Telecom
5th MayAccelerating Additive Manufacturing Adoption in India
3 Min Read

The Home Entertainment Product Market Report is Segmented by Product (Audio Products, Video Products, and Gaming Consoles), Connectivity Technology (Wired, and Wireless), Distribution Channel (Offline, and Online), and Geography. The Market Forecasts are Provided in Terms of Value (USD).
Market Overview
| Study Period | 2020 - 2031 |
|---|---|
| Market Size (2026) | USD 339.16 Billion |
| Market Size (2031) | USD 431.36 Billion |
| Growth Rate (2026 - 2031) | 4.93 % CAGR |
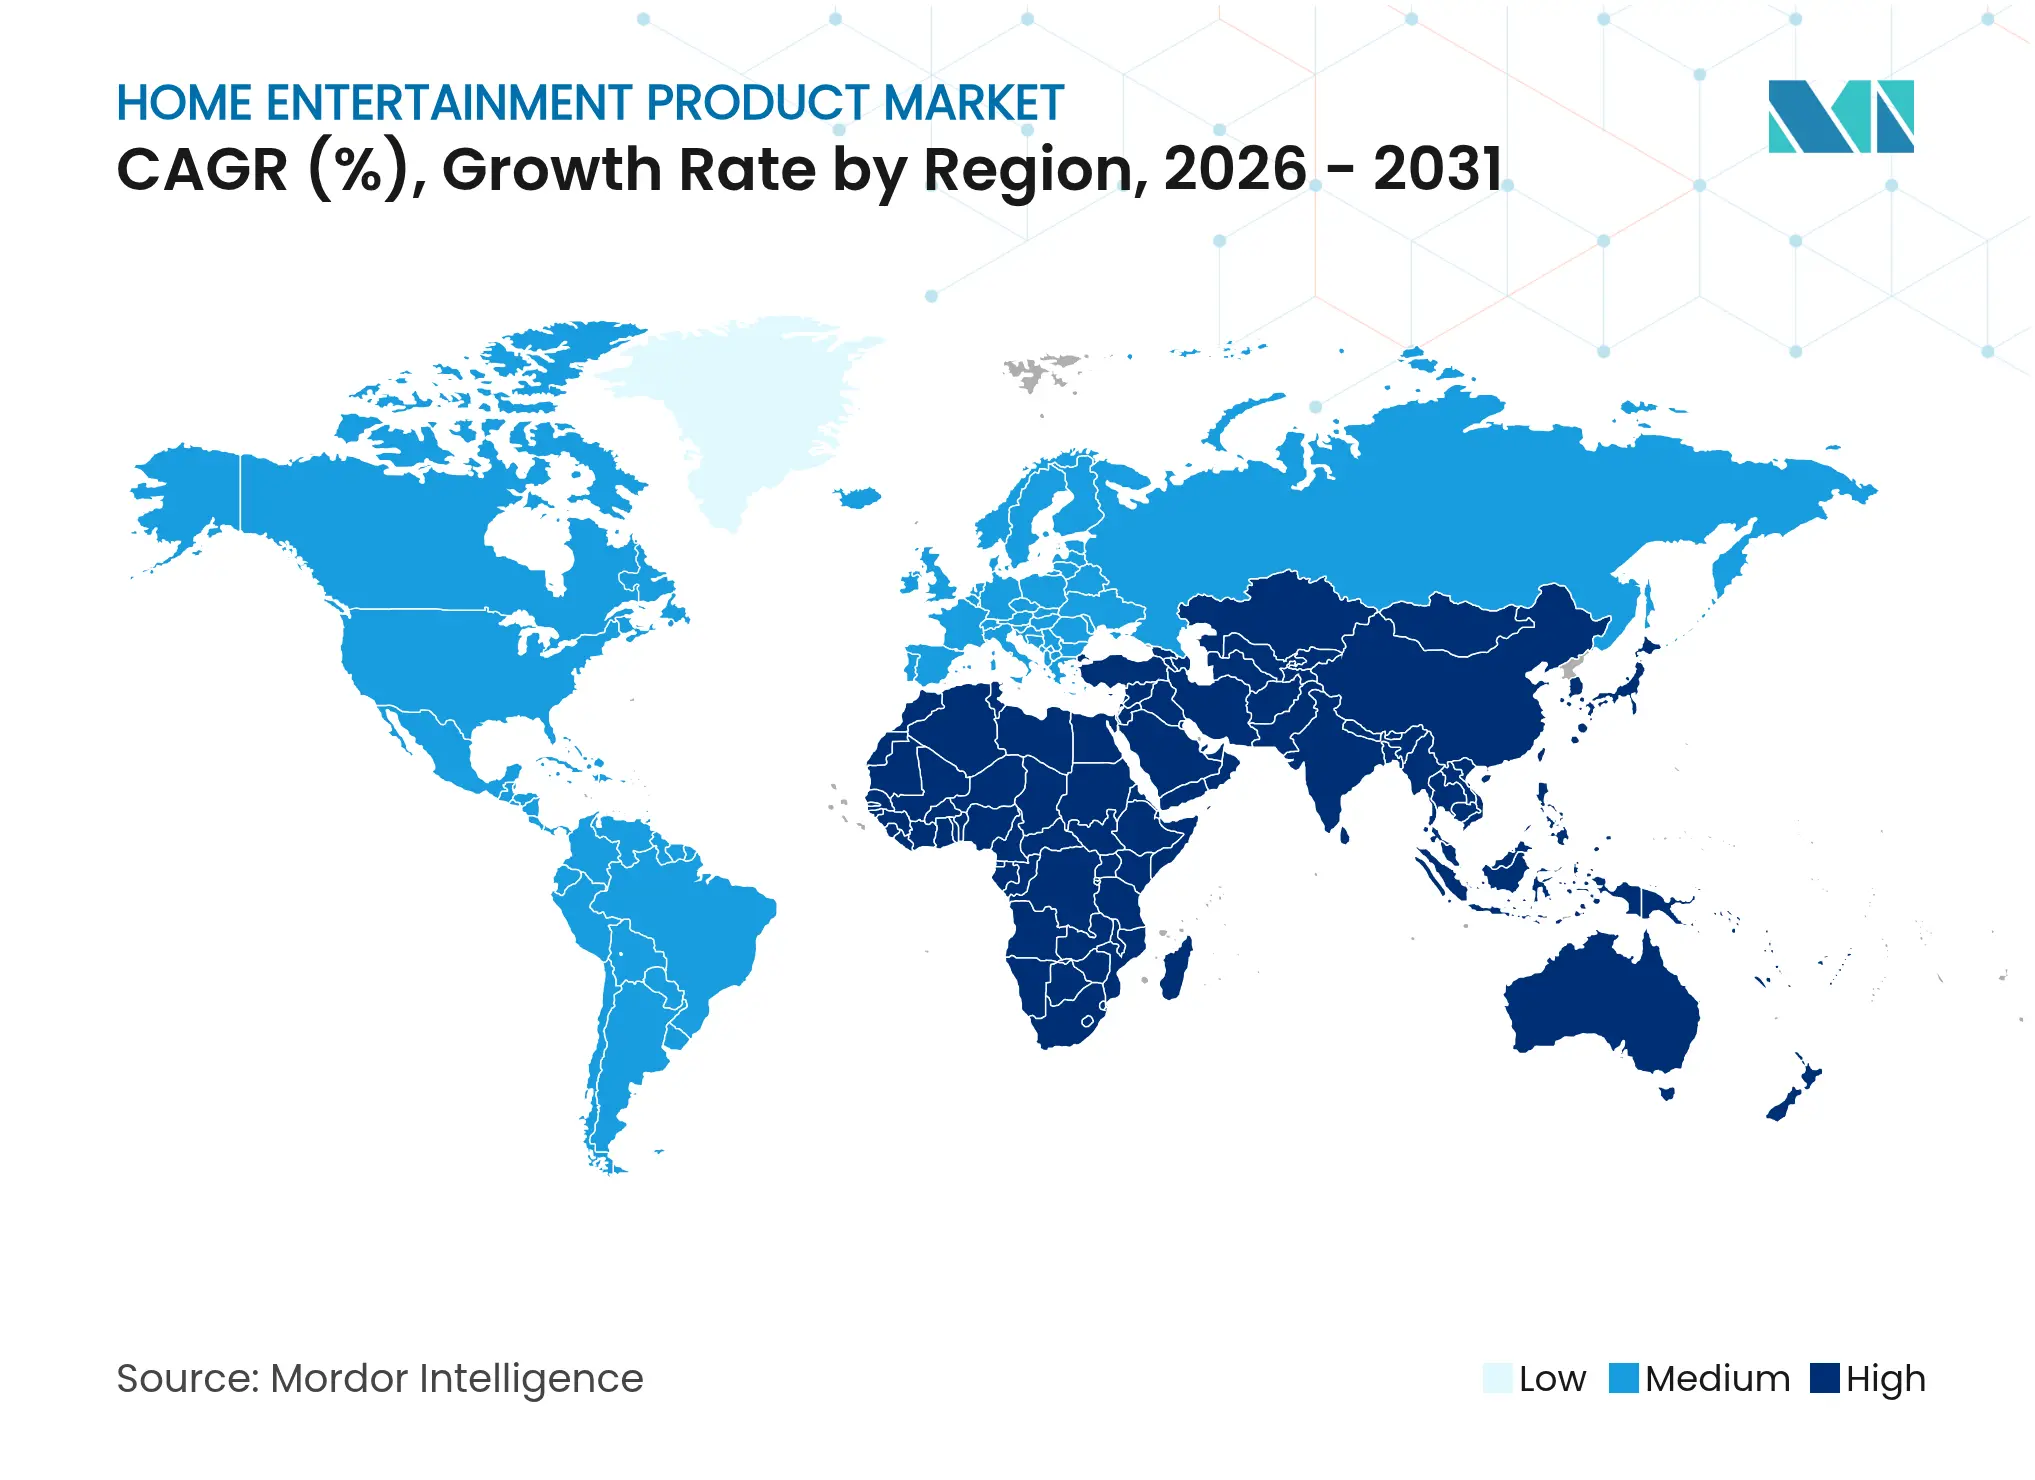
| Fastest Growing Market | Middle East and Africa |
| Largest Market | Asia Pacific |
| Market Concentration | Medium |
Major Players *Disclaimer: Major Players sorted in no particular order. Image © Mordor Intelligence. Reuse requires attribution under CC BY 4.0. |
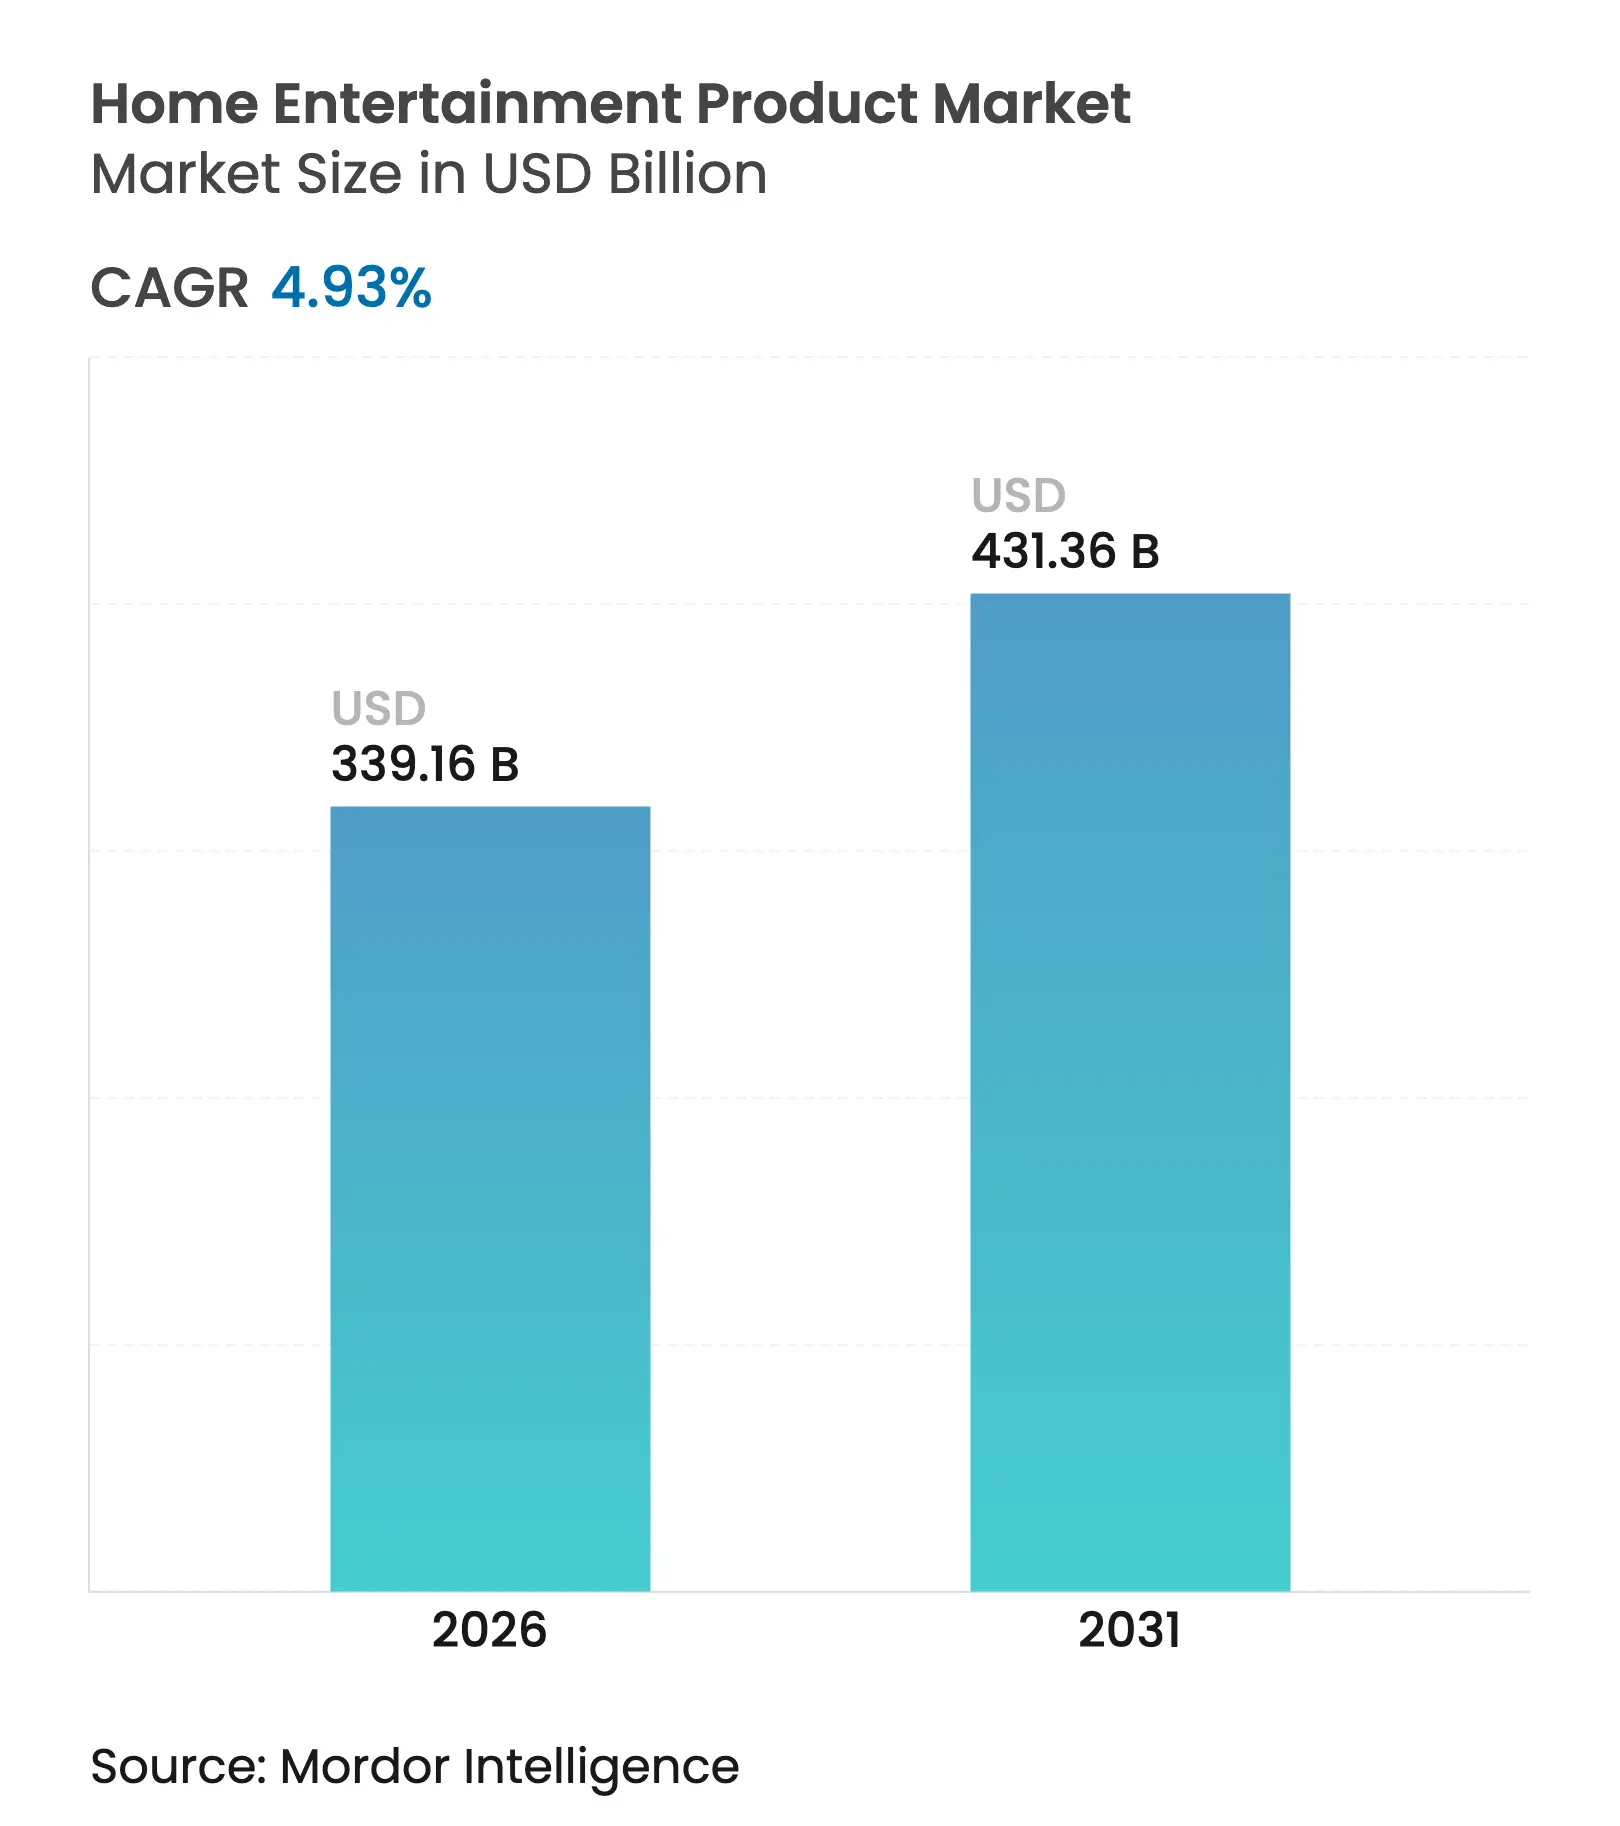

The home entertainment product market size is expected to grow from USD 323.22 billion in 2025 to USD 339.16 billion in 2026 and is forecast to reach USD 431.36 billion by 2031 at 4.93% CAGR over 2026-2031. Appetite for large screens, spatial audio, and connected gaming is lifting average selling prices, so value growth continues even while unit growth slows amid lingering chip shortages and freight cost volatility. Premium televisions, soundbars, and consoles now launch as gateways to bundled subscriptions and targeted advertising, tying hardware profits to recurring digital revenue streams. As software design becomes as critical as panel brightness, intuitive interfaces help brands hold viewers inside proprietary ecosystems where in-app spending can compound. Regulations that reward energy-efficient components, wider broadband coverage in emerging economies, and an accelerating shift from ownership to access-based consumption all reinforce demand, positioning the home entertainment product / device market for durable expansion through 2030.
Key Report Takeaways
Note: Market size and forecast figures in this report are generated using Mordor Intelligence's proprietary estimation framework, updated with the latest available data and insights as of 2026.
Drivers Impact Analysis
| Driver | (~) % Impact on CAGR Forecast | Geographic Relevance | Impact Timeline |
|---|---|---|---|
Proliferation of Smart-Home Ecosystems | +1.2% | North America and Europe, urban APAC | Medium term (3-4 yrs) |
Declining ASP of 4K/OLED TVs | +0.8% | Asia-Pacific, global spillover | Short term (≤ 2 yrs) |
Content-Streaming Boom | +1.3% | Global, strongest in Europe | Medium term (3-4 yrs) |
Cloud and Subscription Gaming | +0.9% | Asia-Pacific and North America | Long term (≥ 5 yrs) |
Rising Disposable Incomes in MEA | +0.7% | Middle East and Africa | Medium term (3-4 yrs) |
Omni-Channel Fulfilment | +0.4% | Global | Short term (≤ 2 yrs) |
| Source: Mordor Intelligence | |||
Proliferation of Smart-Home Ecosystems in North America
Hands-free voice assistants now ship pre-installed on almost every new television, streaming box, and sound system in the United States, making the living room screen the command center of connected households. Amazon reports that millions of Fire TV users send smart-home instructions each month, proving that tight ecosystem integration deepens engagement and data capture. Purchase decisions increasingly hinge on platform compatibility rather than raw display metrics, so smaller manufacturers license big-tech operating systems to stay relevant. Research budgets are shifting toward conversational AI refinement and privacy controls because a single voice-assistant glitch can prompt mass abandonment of rival platforms. The driver, therefore, widens the home entertainment product market by elevating software quality to parity with panel technology while simultaneously raising the switching costs for consumers.
Declining ASP of 4K/OLED TVs in Asia
Yields at new OLED fabs in China and Vietnam climbed into the high-80% range during 2024, pushing retail prices down by more than one-fifth across Southeast Asia.[1] Cheaper entry points drew middle-income families into the premium display tier without cannibalizing early demand for emerging micro-LED prototypes. To shore up margins, Japanese brands launched cloud-based picture-calibration services that unlock advanced features for a monthly fee, migrating profit from the one-time sale to recurring payments. Early adoption rates indicate buyers value on-demand upgrades that extend product relevance, suggesting hardware longevity and software monetization can coexist. The trend expands the home entertainment product market by lowering cost barriers while creating fresh annuity streams.
Content-Streaming Boom Elevating Media-Player Demand in Europe
Streaming hours in France, Italy, and Spain rose again in 2024, prompting a double-digit jump in media-player shipments as households sought smoother interfaces for a growing library of local originals.[2] Investment in European-language content hit EUR 8.7 billion (USD 9.6 billion) in 2024, fulfilling cultural-quota rules and differentiating platforms. More than half of recent media-player buyers selected models that bundled region-exclusive apps, so catalog depth now outweighs entry price in purchase criteria. Device makers are partnering with studios early in the development cycle to ensure exclusives run flawlessly at launch, and firmware schedules increasingly coincide with new-season premieres rather than chipset release dates. As a result, content alliances-rather than silicon roadmaps alone-are shaping the next wave of product differentiation inside the home entertainment product market.
Cloud and Subscription Gaming Fueling Console Uptake Among Gen-Z in Asia
Telcos in South Korea, Singapore, and India deployed low-latency cloud-gaming nodes in 2024, enabling console vendors to pitch entry models as access points to vast cloud libraries instead of high-powered local machines. Microsoft confirmed that a sizeable share of new Xbox activations in these countries arrived through bundled subscription passes, showing that predictable monthly fees unlock large youth segments. Hardware margins narrowed, yet lifetime value climbed as players bought cosmetic upgrades and season passes within cloud titles. Latency improvements, therefore, do more than enhance gameplay; they rewire economic incentives across the console sub-segment, adding fresh users to the broader home entertainment product market.
Restraints Impact Analysis
| Restraint | (~) % Impact on CAGR Forecast | Geographic Relevance | Impact Timeline |
|---|---|---|---|
Saturated TV Households | -1.1% | North America, Western Europe, Japan | Medium term (3-4 yrs) |
Semiconductor Shortages | -0.7% | Global | Short term (≤ 2 yrs) |
EU E-waste Regulations | -0.3% | Europe, potential global spillover | Long term (≥ 5 yrs) |
Health Concerns | -0.2% | Global | Long term (≥ 5 yrs) |
| Source: Mordor Intelligence | |||
Saturated TV Households Slow Replacement Cycles
Living rooms in North America already average more than one television per household, stretching replacement intervals beyond seven years by 2024. Manufacturers redirected launch budgets toward Latin America and Southeast Asia, where first-time buyers drive quicker unit expansion. California energy-efficiency regulations gently nudge owners to retire older plasma sets earlier, but the pull-forward effect is limited. Brands now balance multiple realities: showcasing micro-LED flagships to entice affluent enthusiasts, while introducing rugged smart TVs that tolerate voltage fluctuation in rural India. The restraint tempers growth in the home entertainment product market until new value-added services persuade owners to upgrade sooner.
Semiconductor Shortages and Freight Spikes Inflate Costs
Persistent tightness at 14 nm and below kept lead times above 20 weeks for Wi-Fi and display controllers through most of 2024. To preserve allocation, vendors trimmed global lineups by nearly one-quarter, funneling scarce parts into fast-moving models and accepting feature gaps on low-volume variants. Container freight costs, although off their 2022 highs, still sit above historical ranges and have encouraged final-assembly moves to Mexico and Eastern Europe. The inventory discipline freed working capital for software upgrades and marketing tests, but limited entry-level availability, delaying adoption in some price-sensitive segments of the home entertainment product market.
By Product: Shifting Revenue Mix Toward Consoles and Smart Audio
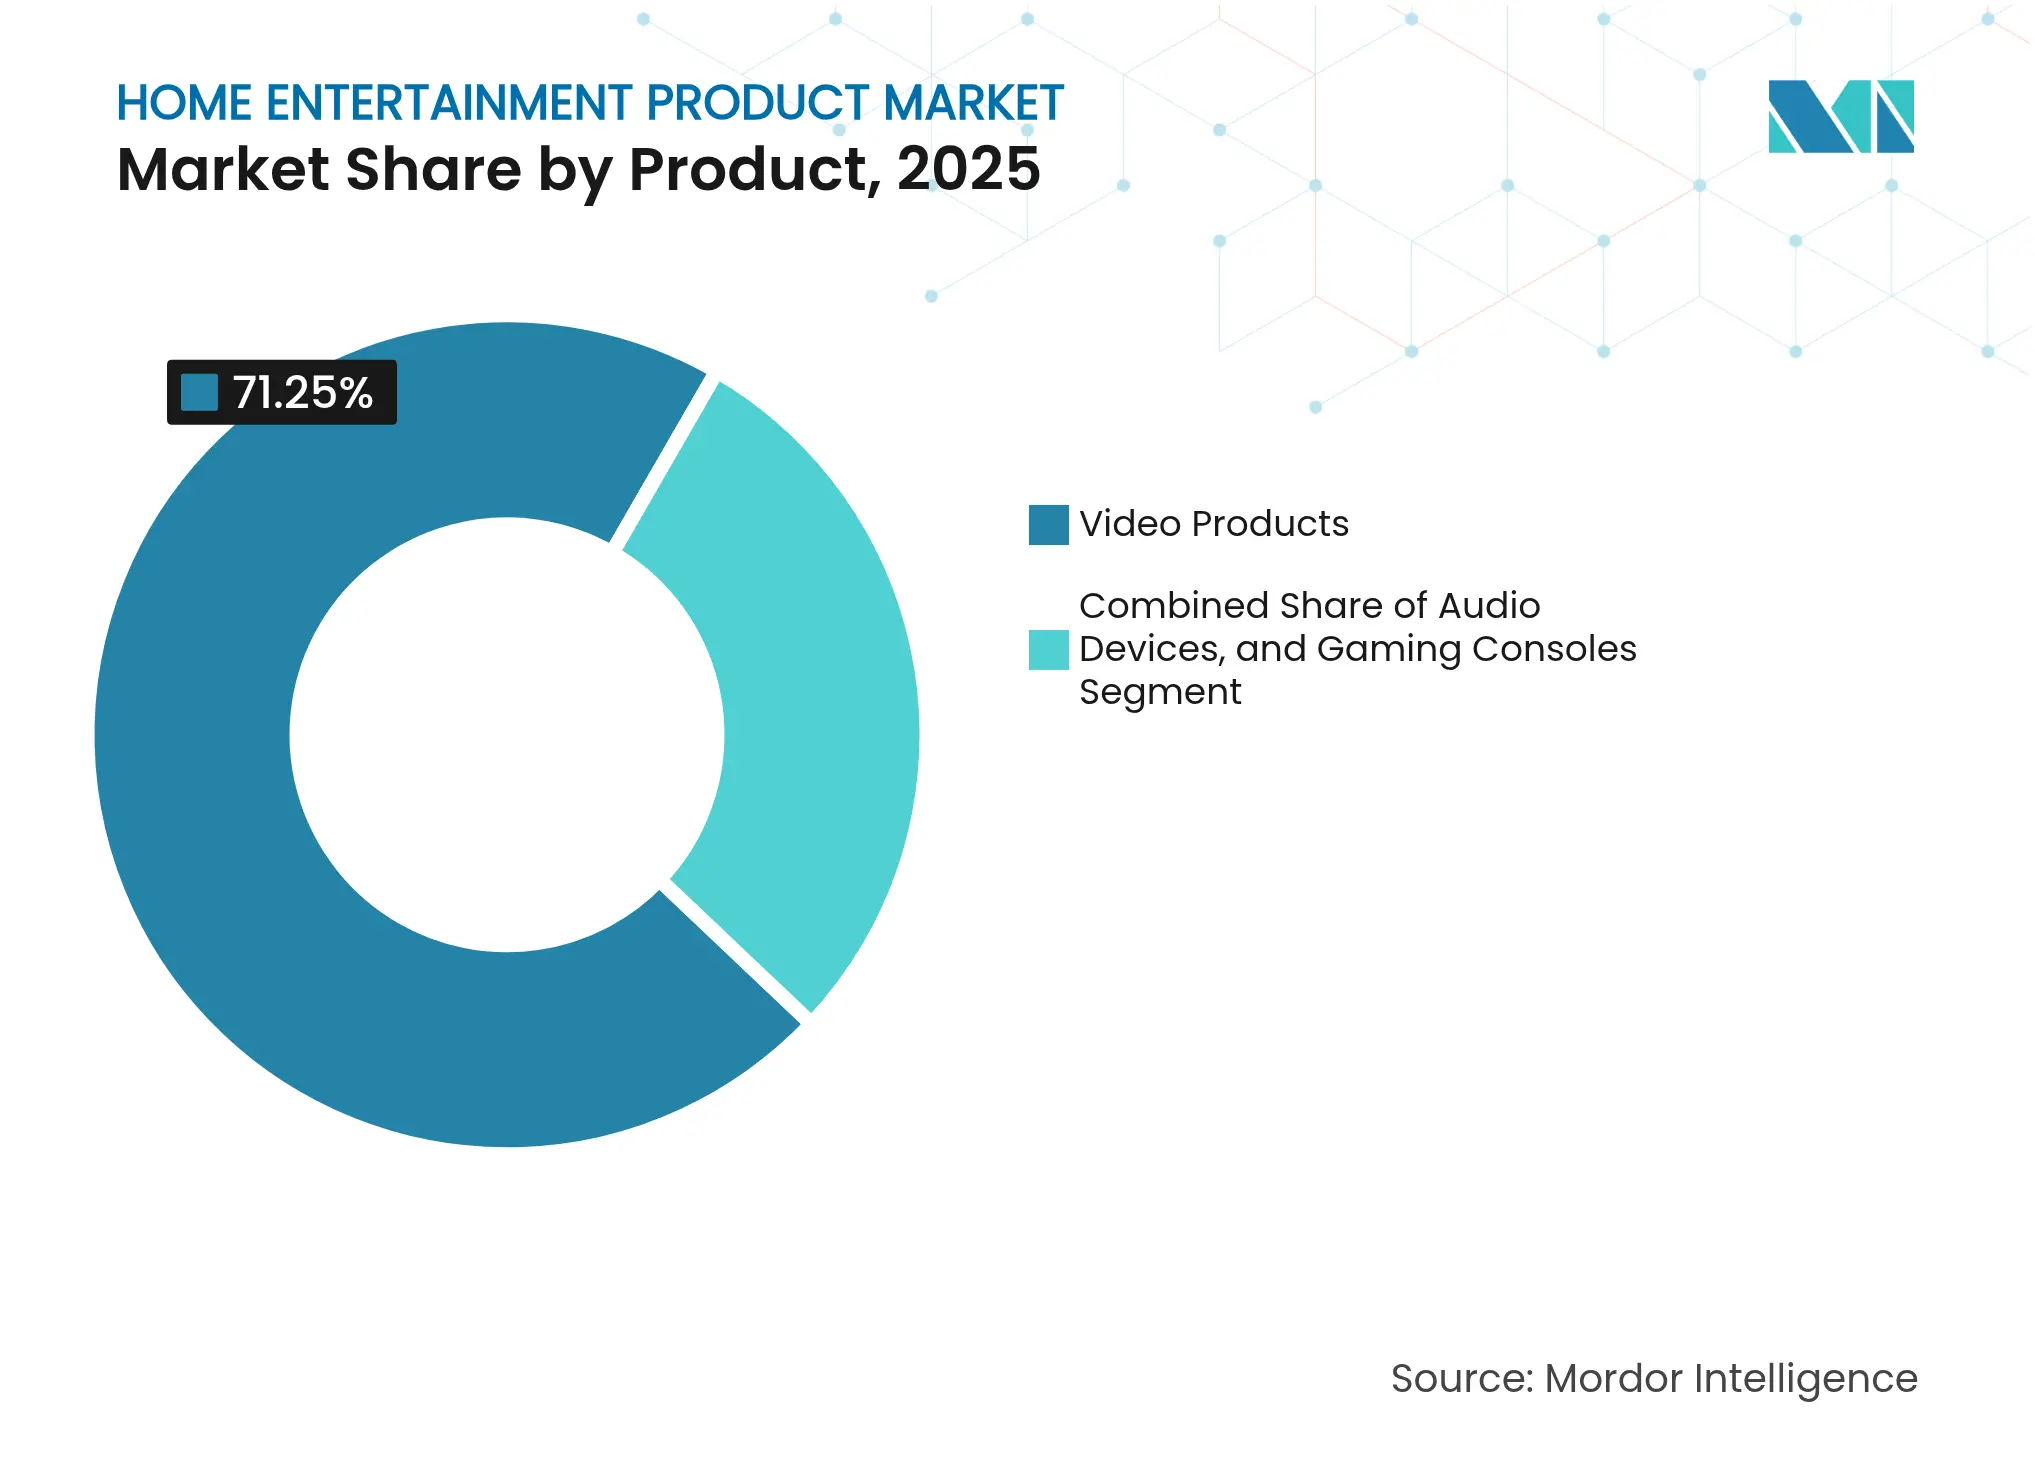
Video products dominated the home entertainment product market with a 71.25% share in 2025, yet consoles are on pace for a 6.62% CAGR to 2031, helped by cloud-gaming subscriptions that spread costs over manageable monthly fees. This pivot broadens the home entertainment product market size because it recruits gamers who once stayed on mobile titles alone. Televisions retain central relevance, though they are increasingly valued for app stores and advertising slots rather than isolated picture quality. Networked audio gained momentum as over 60% of premium soundbars released in 2024 embedded far-field microphones that double as smart-home hubs. Headphone revenue outpaced unit growth thanks to active noise cancellation and biometric sensors, signaling sustained premiumization. Laser-driven projectors lengthen lamp life to 20,000 hours, converting a niche into a credible living-room alternative. Accessory makers selling light kits that sync with on-screen action report rising attach rates, showing how immersive ecosystems are reshaping purchasing priorities. Conventional non-smart televisions retreated further as multiple global brands confirmed end-of-life plans before 2026, reinforcing that connectivity is now mandatory across the home entertainment product market.
A second layer of dynamics revolves around value migration. Bundled content passes and firmware-locked features allow brands to harvest revenue well after the initial sale, reducing sensitivity to hardware margin compression. Projectors and micro-LED prototypes attract cinephile households willing to spend on dedicated rooms, widening the premium tail. Meanwhile, entry-level smart TVs move steadily down the price curve, particularly in Asia-Pacific, where local contract manufacturers introduce panel sizes tailored to small apartments. As subscription services proliferate, device makers increasingly optimize user interfaces for cross-promotion, bringing user-experience teams into hardware roadmaps. The cumulative effect is an ecosystem where hardware replacement cycles lengthen yet average revenue per user rises, supporting sustainable growth in the home entertainment product market.
Note: Segment shares of all individual segments available upon report purchase
By Connectivity Technology: Wireless Advances Narrow Performance Gaps
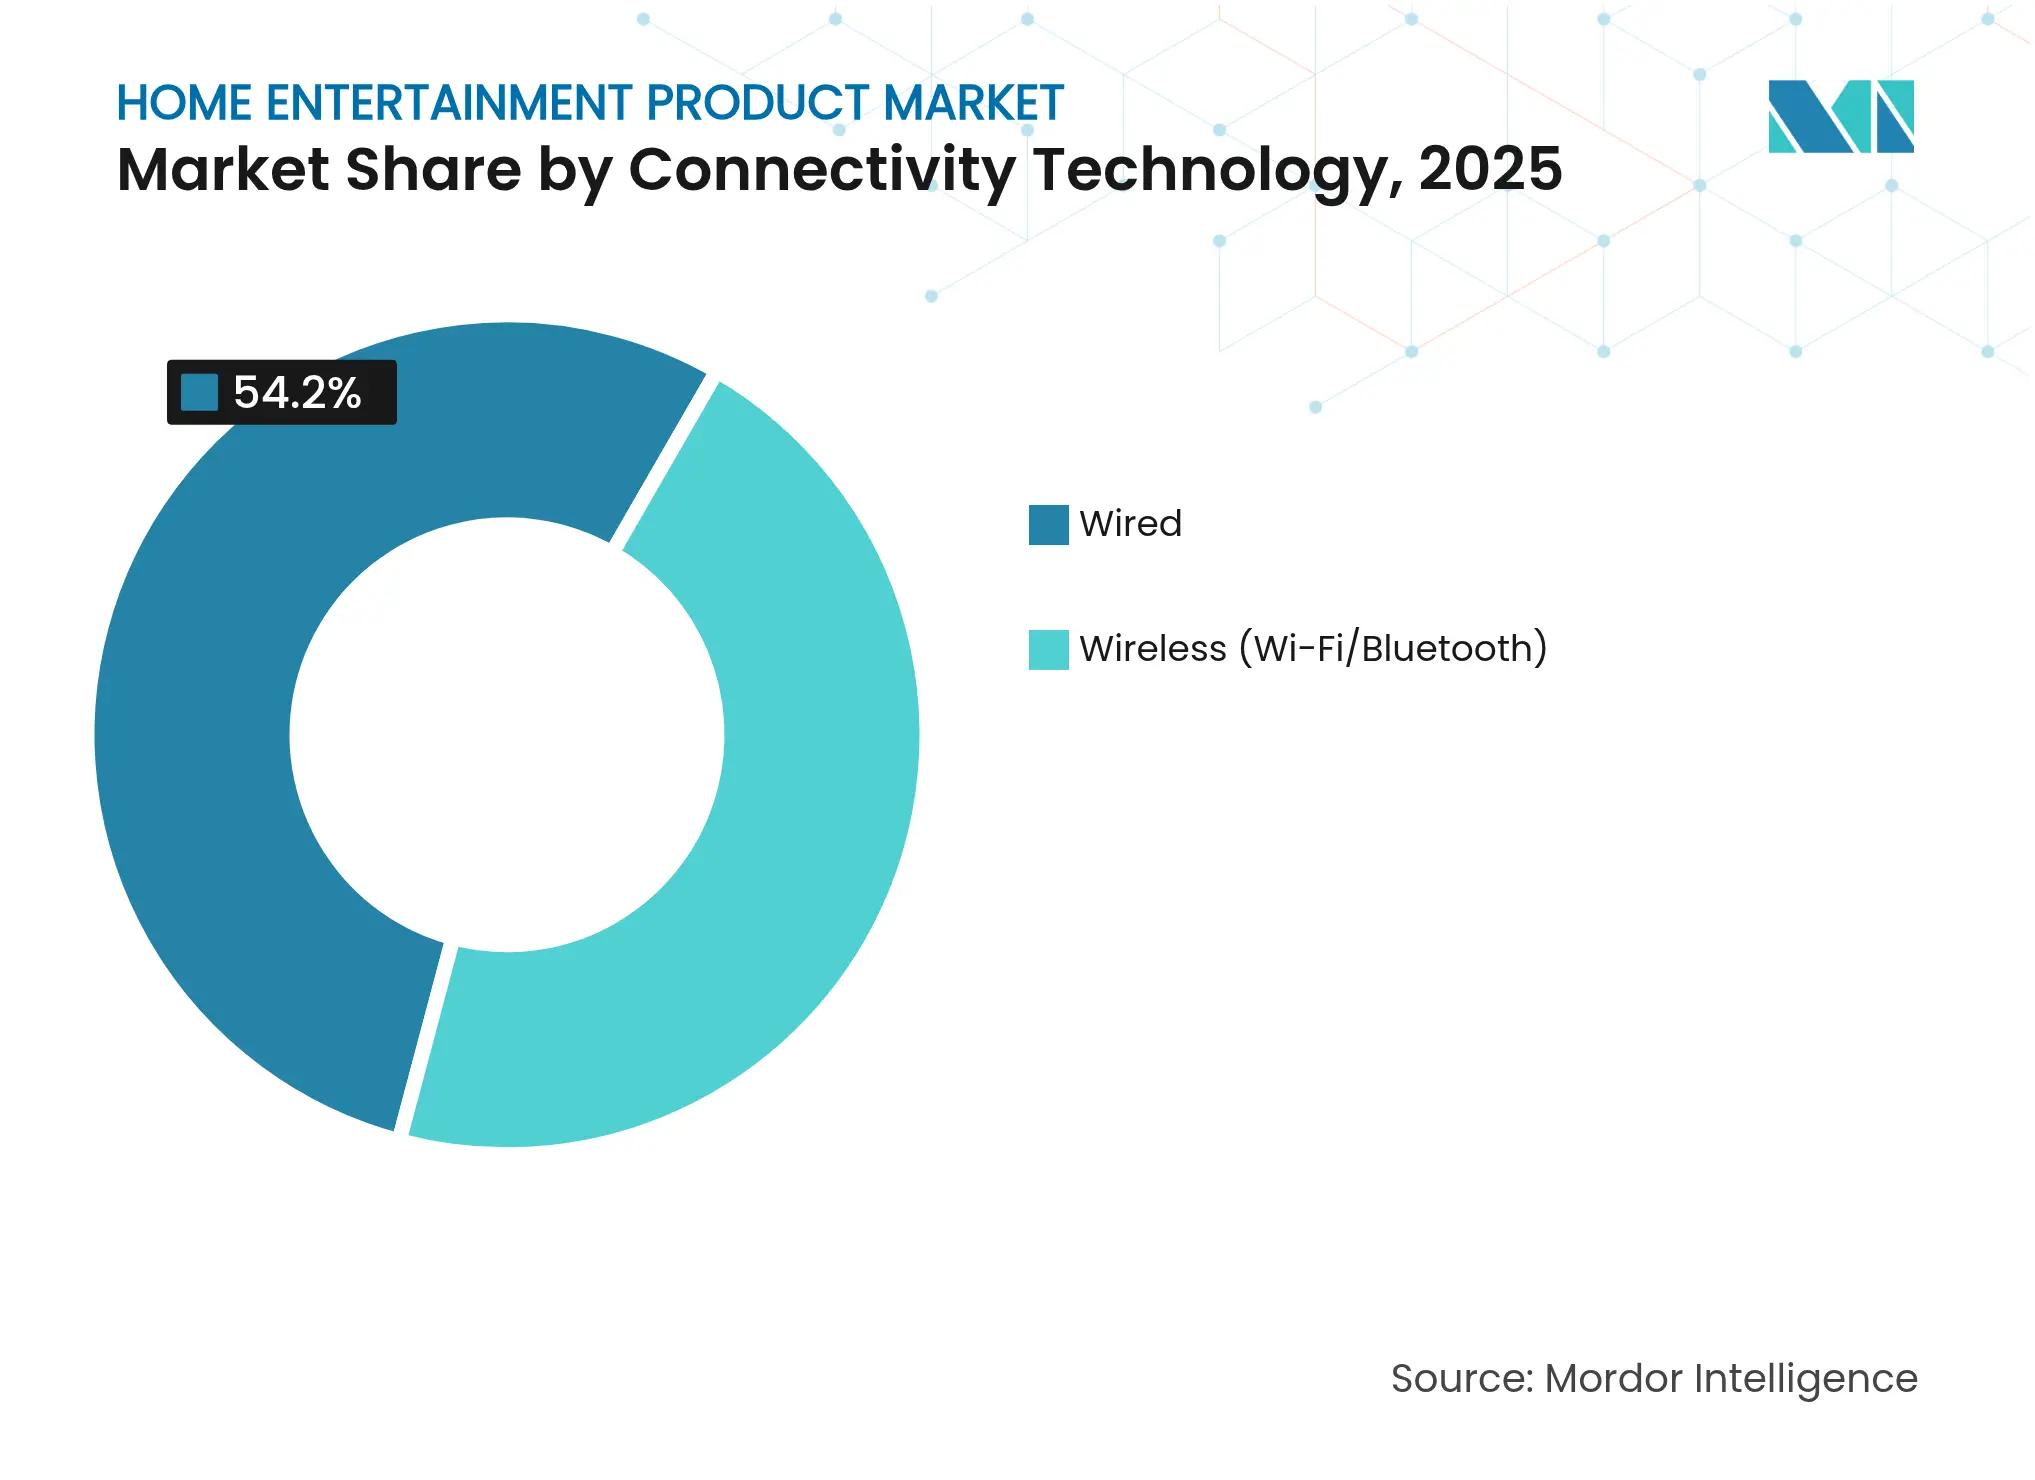
Wired connections captured 54.20% of 2025 revenue, largely because competitive gamers and audiophiles prize zero latency. The remaining share, however, is expanding quickly; wireless protocols are projected for a near-6.74% CAGR through 2031 as Wi-Fi 6E and Bluetooth Low Energy Audio cut latency in half. Mainstream users seldom detect quality differences under normal living-room conditions and increasingly favor decluttered spaces. OEMs respond by stripping redundant ports from minimalist speaker lines, lowering bill-of-materials costs, and simplifying industrial design. The home entertainment product market size for wireless products is set to widen further as multi-antenna arrays become affordable for mid-range models.
Professional studios and e-sports arenas still insist on deterministic wired links, ensuring a durable premium niche for HDMI 2.1 and fiber optics. Yet the mass-market pivot pressures aftermarket dongles, which may disappear once robust wireless becomes standard at the board level. Chipset vendors integrate both wired and wireless cores in a single package, giving product managers flexibility while easing supply-chain complexity. Consumer-facing marketing elevates battery endurance and multi-room synchronization over raw bandwidth, reflecting how experience metrics eclipse spec sheets. As wireless reliability rises, households add extra speakers or secondary displays without home-renovation hurdles, broadening the total addressable base of the home entertainment product market.
Note: Segment shares of all individual segments available upon report purchase
By Distribution Channel: Omnichannel Approaches Improve Resilience
Offline retail still generates roughly two-thirds of global sales because live demonstrations and professional installation sway high-value purchases. Specialty electronics chains convert floorspace into experiential studios where shoppers can test subwoofer placement or latency before buying, enhancing engagement. Online channels, however, lead growth at an 7.56% CAGR to 2031, pushing brands to engineer packaging that survives direct-to-door journeys and reduces returns. Marketplaces dominate e-commerce with more than 70% of online sales, but brands lack first-party data unless they launch loyalty programs through companion apps.
2024 saw a surge in online-exclusive SKUs that bundle digital credits or extended warranties, encouraging logged-in usage that yields behavioral insights. Real-time review analytics allow rapid firmware fixes and proactive customer care, trimming refund costs. Offline retailers counter with same-day pickup, synchronized inventory visibility, and flexible financing, highlighting how the most successful players blend physical reach with digital convenience. As shipping fees fluctuate, omnichannel operators can reroute stock to minimize last-mile expenses. The evolution boosts the home entertainment product market because frictionless access and tailored experiences spur larger basket sizes and higher upgrade frequency
Asia-Pacific accounts for 37.60% of the home entertainment devices market and remains the principal manufacturing base. Rising labor costs in China accelerated diversification toward Vietnam and India, which together add resilience against trade disruptions. India posts high single-digit unit growth driven by first-time buyers, so brands emphasize voltage protection and multilingual interfaces. Local intellectual-property filings show Asia-based firms own more than 60% of active patents in advanced display and wireless technology, giving the region outsized influence on global standards. Governments encourage domestic assembly with tax incentives, adding to vertical-integration advantages. As middle-class incomes rise, premium adoption follows, expanding the revenue pool of the home entertainment product market.
North America holds about a 26.85% share, with growth below 5% because most households already own multiple screens. Disposable income, however, supports robust spending on streaming and gaming subscriptions, which increases the strategic value of embedded app stores. California standards limit standby power, steering silicon choices toward ultra-low-leakage designs. Although owners now replace TVs less often, micro-LED showcases and ultra-short-throw projectors still entice enthusiasts through bundle financing that stacks hardware with content vouchers. Supply-chain re-routing to Mexican assembly cuts delivery times and softens tariff exposure, underscoring how near-shoring can stabilize the home entertainment product market during logistic shocks.
Europe contributes around 21.90% of global revenue and achieves steady, if modest, expansion. Implementation of the Digital Markets Act forces gatekeeping platforms to open interface real estate, allowing indigenous brands to regain visibility lost to imported operating systems. Sustainability legislation-particularly right-to-repair mandates-encourages modular designs that accept swappable backlights and serviceable batteries. Eco-labels influence purchasing decisions, especially in Nordic countries where green financing makes energy-efficient appliances cheaper to own. Content-quota rules drive localized production budgets, which in turn elevate demand for devices optimized for region-specific apps. This regulatory cocktail lengthens product life cycles yet opens margin streams in certified refurbishment, providing a balanced growth profile for the home entertainment product market.
Market Concentration
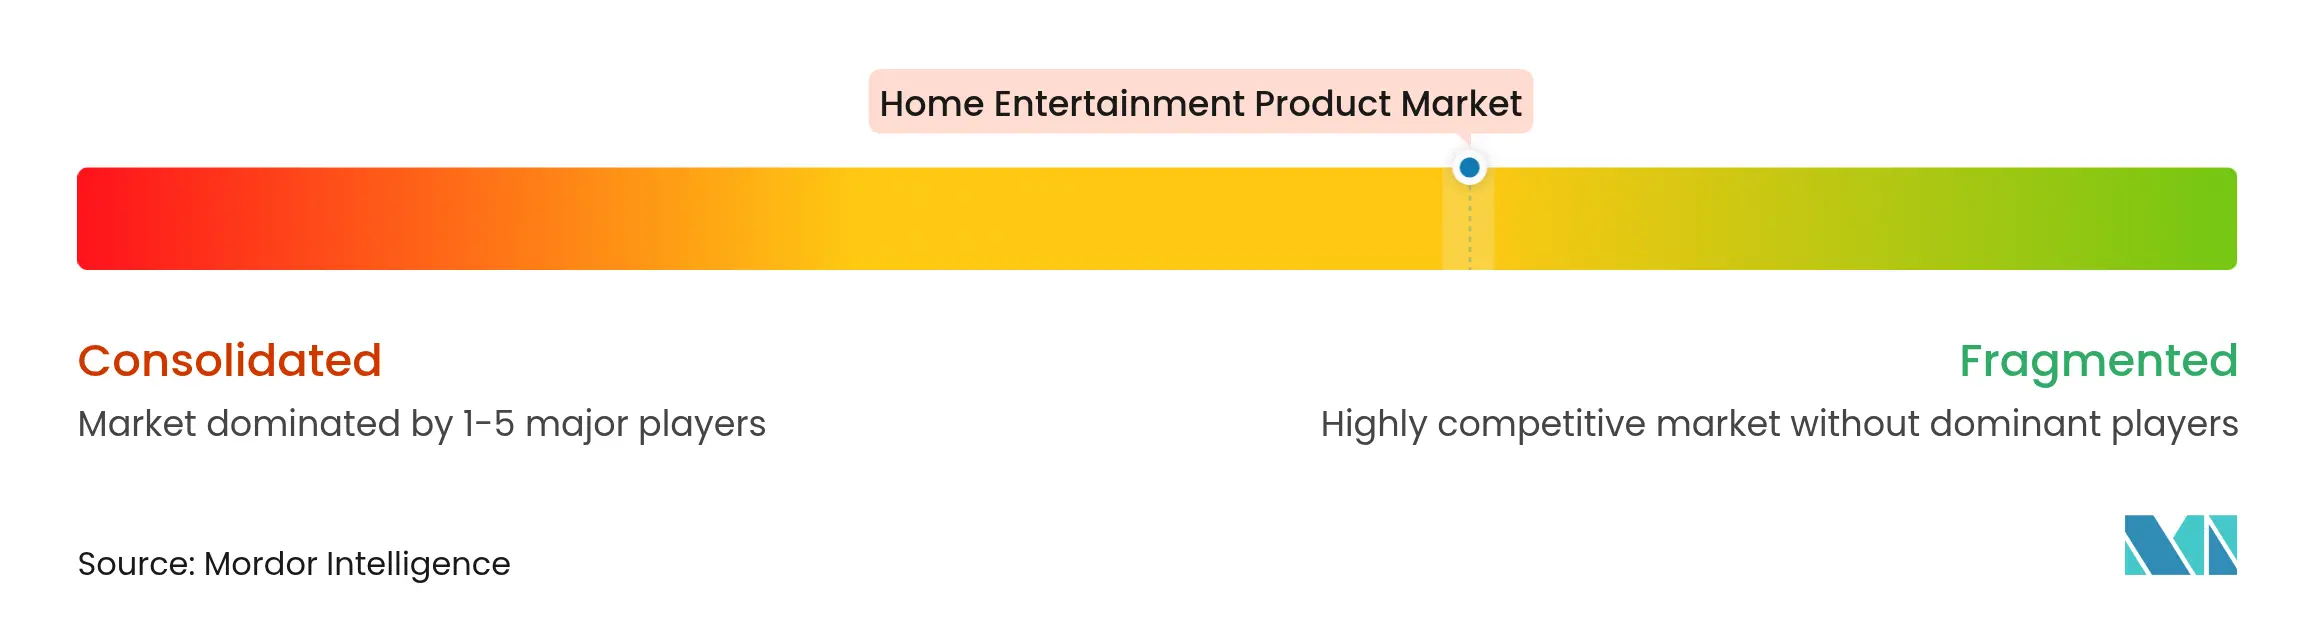
The five largest manufacturers together account for just over 50% of the global home entertainment product market share, indicating moderate consolidation. Samsung, Sony, and LG enjoy vertical control over panels, semiconductors, and proprietary operating systems, which lets them adjust costs quickly when component prices swing. Patent filings reveal an arms race in micro-LED and AI-upscaling algorithms, with Samsung alone submitting nearly 1,900 display applications during 2024. Chinese challengers such as TCL and Hisense leverage local supply chains and cost engineering to shorten lead times into Western markets, pressuring incumbents to match entry prices on select models.
Software-oriented disruptors carve defensible niches without manufacturing scale. Sonos relies on a proprietary mesh protocol to deliver lossless multi-room audio and thus commands premium prices against commodity Bluetooth products. Roku powers white-label smart TVs for mass retailers, monetizing advertising inventory that once flowed solely to device brands. These playbooks highlight a structural shift: enduring advantage stems from user-engagement ownership and data pipelines rather than raw hardware specifications. As advertising and subscription revenue magnify, design teams treat user interface latency with the same urgency once reserved for panel response time.
Sustainability and service ecosystems form the third battleground. European right-to-repair mandates push brands to publish spare-parts catalogs and guarantee firmware support for at least five years, turning compliance into a loyalty lever. Partnerships with certified repair networks emerge as differentiators against gray-market imports. Brands that communicate carbon footprints clearly and offer trade-in credits see higher repeat-purchase intent. Across categories, the competitive narrative shows that hardware alone no longer secures leadership; instead, platform control, sustainable design, and post-sale engagement define who captures long-run value in the home entertainment product market.

*Disclaimer: Major Players sorted in no particular order
1. INTRODUCTION
2. RESEARCH METHODOLOGY
3. EXECUTIVE SUMMARY
4. MARKET LANDSCAPE
5. MARKET SIZE AND GROWTH FORECASTS (VALUE)
6. COMPETITIVE LANDSCAPE
7. MARKET OPPORTUNITIES AND FUTURE OUTLOOK
Home entertainment technology includes various electronic devices that deliver audio and visual media experiences right at home. It all started with the radio, which brought music and news into households. The game changed with the introduction of television, adding a visual dimension to media consumption. The transition to color TV took the viewing experience up a notch. With the emergence of VCRs and DVDs, movie-watching became a matter of personal convenience. Video game consoles then stepped in, introducing a new realm of interactive entertainment and solidifying their place in countless homes.
The home entertainment product market is segmented by device (audio devices, video devices, gaming consoles), by distribution channel (online, offline), and by region (North America, Europe, Asia-Pacific, Latin America, Middle East & Africa). The market size and forecasts are provided in terms of value (USD) for all the above segments.
| By Product | Audio Products | Smart Speakers | |
| Soundbars | |||
| Home Theatre Systems / AV Receivers | |||
| Headphones and Earphones | |||
| Video Products | Televisions | Smart TVs | |
| Traditional TVs | |||
| Streaming Media Players | |||
| Projectors | |||
| Set-Top Boxes and Blu-ray Players | |||
| Gaming Consoles | Home Consoles | ||
| Handheld and Hybrid Consoles | |||
| VR Headsets (Console-Compatible) | |||
| By Connectivity Technology | Wired | ||
| Wireless (Wi-Fi / Bluetooth) | |||
| By Distribution Channel | Offline | Consumer Electronics and Appliance Stores | |
| Hypermarkets / Supermarkets | |||
| Specialty Retailers | |||
| Online | E-commerce Marketplaces | ||
| Company-owned Webstores | |||
| By Geography | North America | United States | |
| Canada | |||
| Mexico | |||
| South America | Brazil | ||
| Argentina | |||
| Rest of South America | |||
| Europe | Germany | ||
| United Kingdom | |||
| France | |||
| Italy | |||
| Spain | |||
| Rest of Europe | |||
| Asia-Pacific | China | ||
| Japan | |||
| South Korea | |||
| India | |||
| Rest of Asia-Pacific | |||
| Middle East and Africa | United Arab Emirates | ||
| Saudi Arabia | |||
| South Africa | |||
| Rest of Middle East and Africa | |||
Accelerating Additive Manufacturing Adoption in India
3 Min Read
Pricing Strategy for Semiconductor Components
3 Min Read
When decisions matter, industry leaders turn to our analysts. Let’s talk.
