
HIV/AIDS Diagnostics Market Size and Share
Market Overview
| Study Period | 2020 - 2031 |
|---|---|
| Market Size (2026) | USD 4.02 Billion |
| Market Size (2031) | USD 6.64 Billion |
| Growth Rate (2026 - 2031) | 10.56 % |
| Fastest Growing Market | Asia Pacific |
| Largest Market | North America |
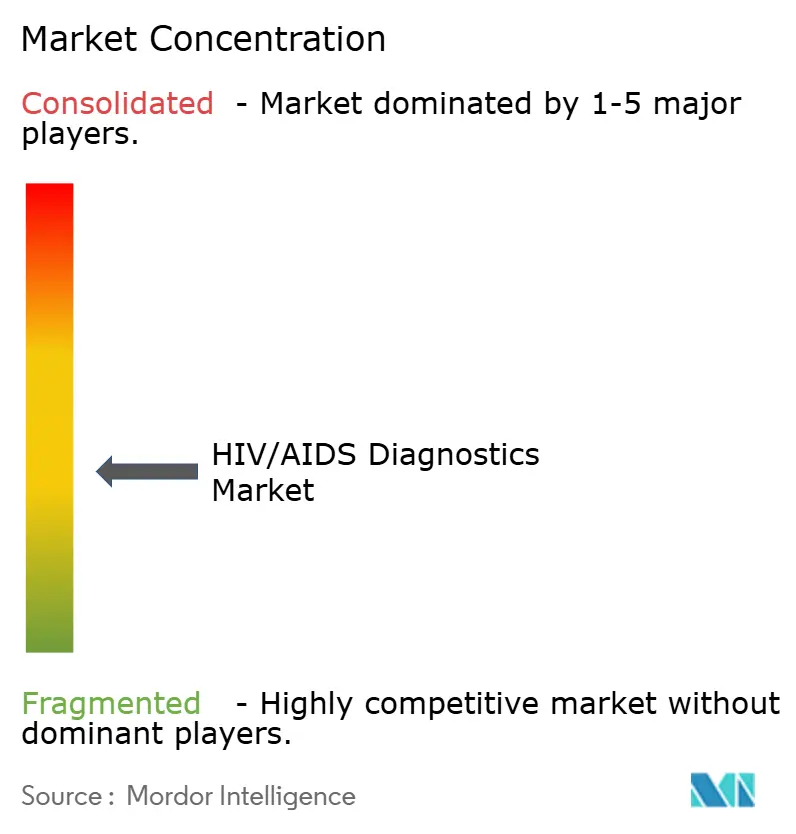
| Market Concentration | Medium |
Major Players *Disclaimer: Major Players sorted in no particular order Image © Mordor Intelligence. Reuse requires attribution under CC BY 4.0. | |
HIV/AIDS Diagnostics Market Analysis by Mordor Intelligence
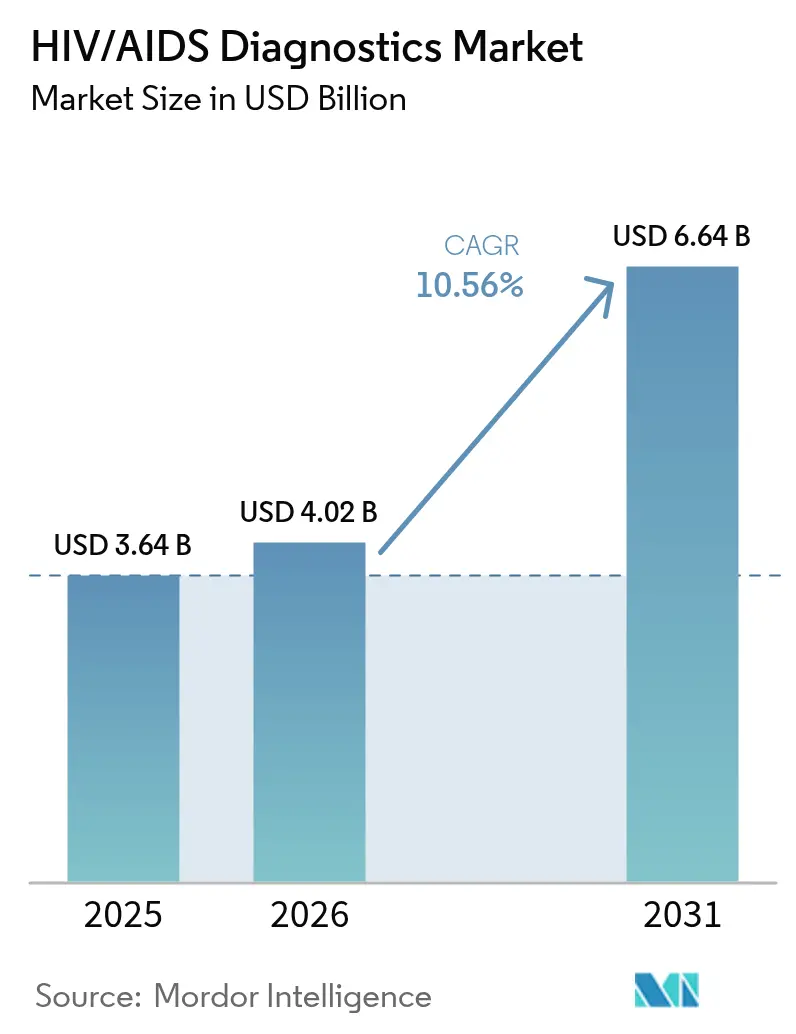
The HIV/AIDS diagnostics market size is expected to grow from USD 3.64 billion in 2025 to USD 4.02 billion in 2026 and is forecast to reach USD 6.64 billion by 2031 at 10.56% CAGR over 2026-2031. This pace reflects sustained funding, updated testing guidelines, and rapid technology diffusion that keep the HIV/AIDS diagnostics market well aligned with global 95-95-95 goals. Government-led self-testing programs, rising viral load monitoring volumes, and multi-disease molecular platforms collectively widen the addressable pool of users [1]World Health Organization, “Updated Recommendations on HIV Testing Services,” who.int. At the same time, donor-backed price ceilings, assay sensitivity gaps for new recombinant strains, and the shift to syndromic panels impose competitive and margin pressures that shape product strategy. Platform consolidation by leading firms and AI-enabled result interpretation continue to define how the HIV/AIDS diagnostics market evolves while ensuring reliable access in both mature and resource-limited settings.
Key Report Takeaways
- By product, consumables commanded 61.74% of the HIV/AIDS diagnostics market share in 2025, while instruments are projected to expand at an 11.18% CAGR through 2031.
- By test type, antibody tests led with a 47.92% revenue share in 2025; viral load testing is advancing at an 11.27% CAGR to 2031.
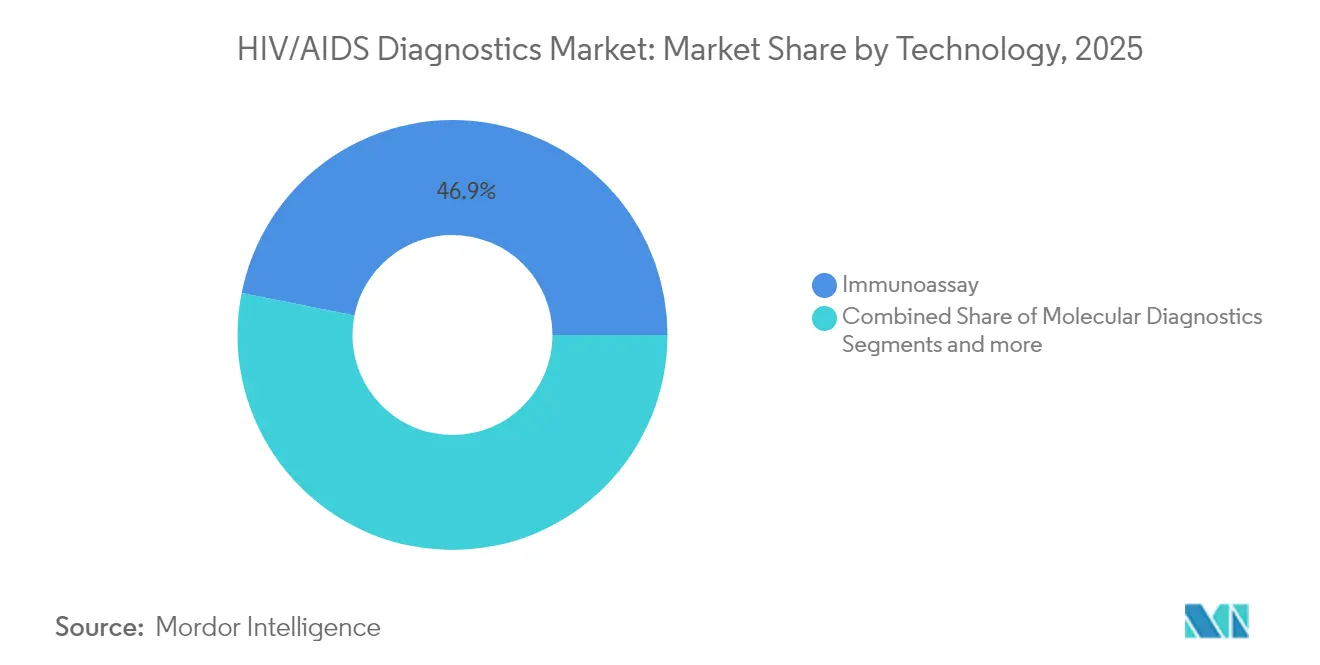
- By technology, immunoassays secured 46.88% share in 2025, whereas molecular diagnostics record the fastest CAGR of 11.22% through 2031.
- By end user, hospitals accounted for 53.35% of the HIV/AIDS diagnostics market size in 2025; at-home use registers the highest CAGR of 11.24% for the forecast period.
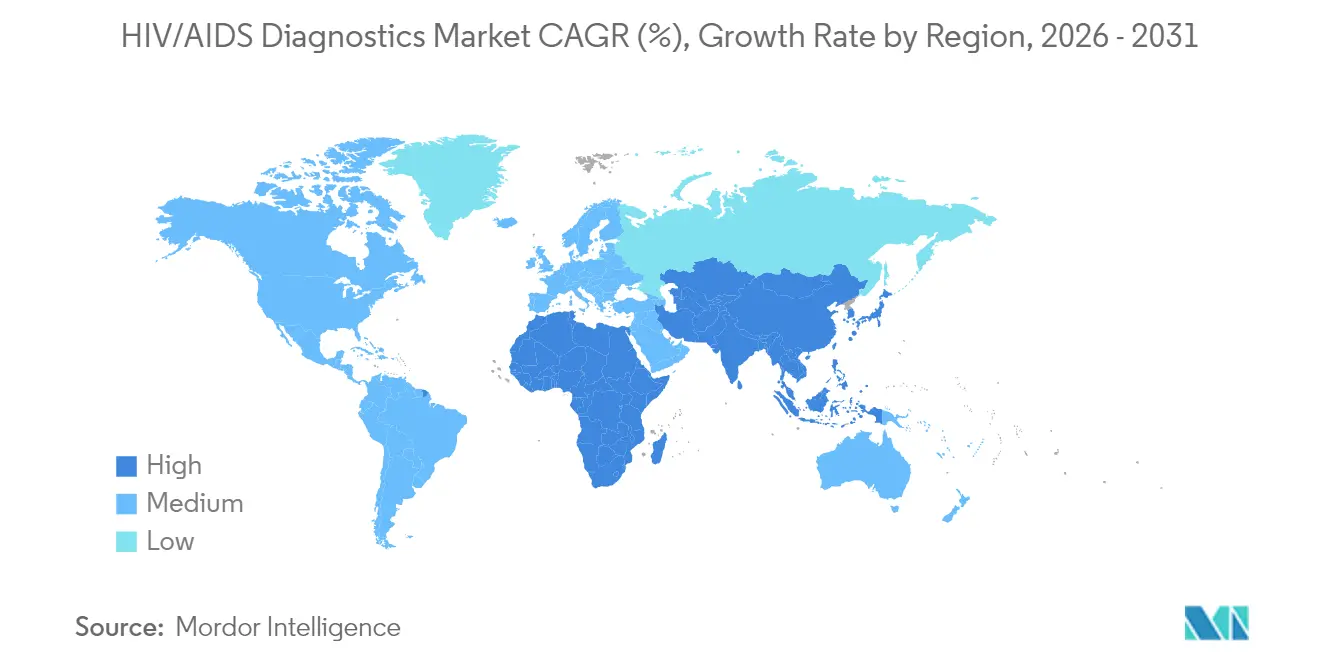
- By geography, North America held 38.52% revenue share in 2025, while Asia-Pacific is projected to grow at an 11.49% CAGR through 2031.
Note: Market size and forecast figures in this report are generated using Mordor Intelligence’s proprietary estimation framework, updated with the latest available data and insights as of 2026.
Market Trends and Insights
Drivers Impact Analysis of HIV/AIDS Diagnostics Market*
| Driver | (~) % Impact on CAGR Forecast | Geographic Relevance | Impact Timeline |
|---|---|---|---|
| Growing HIV prevalence & incidence | +2.1% | Global, with concentration in Sub-Saharan Africa and Asia-Pacific | Medium term (2-4 years) |
| Government funding & initiatives | +2.8% | Global, led by PEPFAR countries and EU initiatives | Short term (≤ 2 years) |
| Expanding adoption of HIV self-testing & at-home rapid tests | +2.3% | North America, Europe, expanding to Asia-Pacific | Medium term (2-4 years) |
| Integration of HIV in multiplex molecular respiratory/STD panels | +1.4% | North America, Europe, selected Asia-Pacific markets | Long term (≥ 4 years) |
| Scale-up of near-POC viral-load & EID testing in LMICs | +1.9% | Sub-Saharan Africa, South Asia, Latin America | Medium term (2-4 years) |
| Digital connectivity & AI-based result reporting platforms | +1.2% | Global, with early adoption in developed markets | Long term (≥ 4 years) |
| Source: Mordor Intelligence | |||
Growing HIV Prevalence & Incidence
High-burden regions record continued case growth that widens the screening pool and amplifies demand for new assays. China reported 1.3 million people living with HIV by 2023, virtually all from sexual transmission, which is shifting screening efforts to general adult populations [2]China CDC Weekly, “HIV/AIDS in China — 2023,” chinacdc.cn . South Korea logged a 5.7% rise in new infections in 2023, with two-thirds occurring in adults aged 20-39. Novel recombinants such as CRF85_BC/CRF01_AE discovered in Ningxia, China, challenge assay sensitivity and spur continuous test optimization. India’s expanding PrEP programs also mandate periodic viral load checks to ensure prevention efficacy. These epidemiological shifts collectively enlarge the addressable HIV/AIDS diagnostics market.
Government Funding & Initiatives
Coordinated global and national funding accelerates test uptake. PEPFAR and the Global Fund are supporting lenacapavir access for 2 million individuals, requiring robust baseline screening and follow-up. The United Kingdom allocated GBP 20 million to expand opt-out HIV testing across 47 emergency departments, translating to immediate procurement needs [3]UK Department of Health and Social Care, “Investment to Expand HIV Testing,” gov.uk. West Bengal’s “Triple Elimination” program pairs HIV, syphilis, and hepatitis B screening, creating bundled demand for multiplex test kits. South Africa’s plan to enroll an extra 1.1 million patients in antiretroviral therapy by 2025 further solidifies predictable test volumes. Such funding clarity strengthens the revenue baseline for the HIV/AIDS diagnostics market.
Expanding Adoption of HIV Self-Testing & At-Home Rapid Tests
Consumer-controlled testing is redefining the HIV/AIDS diagnostics market by reaching first-time users and underserved groups. The CDC’s Together TakeMeHome program shipped 440,000 self-test kits in twelve months, with 24.1% going to people who had never tested before. Singapore began selling self-test kits in major pharmacies from January 2025, making walk-in, over-the-counter access routine. The FDA broadened OraQuick’s label to adolescents aged 14 years and older, opening a critical demographic accounting for nearly one-fifth of new U.S. diagnoses. A Canadian pilot of oral-fluid self-testing reported 100% concordance with lab methods plus 97% user satisfaction. Mainstreaming self-testing builds recurring revenue streams and cements the HIV/AIDS diagnostics market as a household-accessible category.
Integration of HIV in Multiplex Molecular Respiratory/STD Panels
Syndromic panels promise operational efficiencies by testing multiple pathogens in a single run. Roche secured FDA clearance for its cobas liat multiplex STI panel, delivering results in under 20 minutes. Multiplex PCR studies record sensitivities of 82%–97.1% and specificities above 94%, demonstrating clinical robustness. WHO’s systematic review found rapid integrated nucleic acid tests achieving ≥95% accuracy, endorsing their use in combined screening programs. Yet higher device pricing and the need for tailored result interpretation limit deployment in low-resource settings, pushing vendors to align dedicated HIV assays with broader syndromic menus to preserve share within the HIV/AIDS diagnostics market.
Restraints Impact Analysis of HIV/AIDS Diagnostics Market*
| Restraint | (~) % Impact on CAGR Forecast | Geographic Relevance | Impact Timeline |
|---|---|---|---|
| Limited lab infrastructure & skilled manpower in LICs | –1.8% | Sub-Saharan Africa, South Asia, select Pacific Islands | Medium term (2-4 years) |
| Price erosion from donor-driven bulk tenders | –1.4% | PEPFAR and Global Fund recipient countries | Short term (≤ 2 years) |
| Shift to multi-disease devices reducing dedicated HIV test demand | –0.9% | North America, Europe, developed Asia-Pacific markets | Long term (≥ 4 years) |
| Sensitivity gaps vs new HIV recombinants/variants | –0.7% | Global, with concentration in high-burden regions | Medium term (2-4 years) |
| Source: Mordor Intelligence | |||
Limited Lab Infrastructure & Skilled Manpower in LICs
Infrastructure gaps hinder implementation of high-complexity assays. A regulatory landscape review in Zimbabwe highlighted shortages in equipment calibration services and trained biomedical engineers, delaying device approvals. Low-cost approaches such as India-ink cryptococcosis screening in Mozambique illustrate demand for ultra-simple diagnostics that may compete with advanced molecular systems. While point-of-care early infant diagnosis in Uganda cut result turnaround from 28 days to 1 day and boosted ART initiation to 95%, scaling similar models requires steady funding for maintenance and training. These structural hurdles temper the near-term expansion pace of the HIV/AIDS diagnostics market in low-income regions.
Price Erosion from Donor-Driven Bulk Tenders
Large-volume procurements curb average selling prices. The Global Fund pushed first-line HIV treatment costs below USD 45 per person annually, signaling similar price expectations for diagnostics. PEPFAR’s planned budget cut of over 6% for fiscal 2025 heightens competition for grant-funded orders and compresses margins. Cost-effectiveness work in sub-Saharan Africa shows HIV self-testing at USD 12.75 per person versus USD 27.64 for campaign testing, reinforcing donor preference for lower-cost modalities. Vendors must therefore optimize scale and supply chain efficiency to stay profitable in the HIV/AIDS diagnostics market while serving donor-funded programs.
*Our forecasts treat driver/restraint impacts as directional, not additive. The impact forecasts reflect baseline growth, mix effects, and variable interactions.
HIV/AIDS Diagnostics Market Segment Analysis
By Product:
Consumables Maintain Revenue CoreConsumables held 61.74% of the HIV/AIDS diagnostics market share in 2025 and generate steady repeat sales each time a test is performed. Volume predictability secures cash flow and funds R&D. Instruments contribute larger upfront revenue per unit and are forecast to expand at an 11.18% CAGR, reflecting health-system moves toward integrated analyzers that accept multiple assays. Software and service add-ons, including AI-based interpretation dashboards, start to differentiate vendor offerings.
Recurring reagent demand anchors margin sustainability in the HIV/AIDS diagnostics market. Meanwhile, platform acquisitions—such as Roche’s USD 350 million purchase of LumiraDx’s point-of-care technology—signal that incumbents aim to secure future instrument installed bases. Public research funding, exemplified by NIH’s USD 1.3 million grant to Florida Atlantic University for a USD 5 microchip test, underscores how innovation targets both cost containment and usability. Digital services that triage results and guide next steps grow in prominence as manufacturers compete beyond hardware.


By Test Type:
Viral Load AcceleratesAntibody assays led revenue at 47.92% in 2025 because they serve as gateway screening tools. Yet viral load testing is set for the highest 11.27% CAGR through 2031 as treatment monitoring drives routine usage. The WHO recommendation that viral load replace CD4 counts for monitoring more than 30 million individuals on therapy materially boosts this subsegment. CD4 and resistance tests remain important adjuncts but at lower growth trajectories.
High-throughput labs such as South Africa’s National Health Laboratory Service processed over 45 million viral load samples in 2022, proving scale economics. Innovations like pooled testing in Cameroon, which raised capacity by 80% while holding accuracy, and Bigtec Labs’ portable micro-PCR platforms illustrate how technology adapts to infrastructure realities. These factors cement the HIV/AIDS diagnostics market size for viral load assays as a prime growth driver.
By Technology:
Molecular Diagnostics Gain MomentumImmunoassays retained 46.88% share in 2025 on the back of mature workflows and favorable cost profiles. Molecular diagnostics, however, are projected to grow 11.22% annually as point-of-care capabilities advance and early-infection detection needs intensify. Flow cytometry occupies a specialized niche within CD4 monitoring, while CRISPR, nanomechanical sensors, and electrochemical biosensors populate the emerging technology pipeline.
Rapid molecular formats provide quantitation, resistance insight, and earlier window-period detection, advantages that justify premium pricing in the HIV/AIDS diagnostics market. CRISPR-based assays demonstrate potential for room-temperature reactions and smartphone readouts. Bio-Rad’s fourth-generation combo tests, reporting 100% sensitivity for acute infection, further bridge immunoassay convenience with molecular accuracy.
By End User:
At-Home Testing Scales FastestHospitals delivered 53.35% of total 2025 revenues, underlining their central role in confirmatory and treatment-linked testing. The at-home segment, helped by relaxed regulatory pathways and e-commerce distribution, is forecast to expand 11.24% per year to 2031. Independent laboratories address complex testing such as resistance genotyping, while community settings and retail pharmacies broaden access.
Self-collection kits demonstrate technical reliability and high user satisfaction, validated by Canada’s 100% concordance pilot. Economic analyses in Kenya show cost per self-test under USD 9 when scaled. Digital counselor integration, as implemented in India’s virtual self-testing program, links remote users to clinical care, fortifying the HIV/AIDS diagnostics market against loss to follow-up.
Geography Analysis
North America and Europe HIV/AIDS Diagnostics Market
North America held a 38.52% revenue lead in 2025 because of strong insurance coverage and proactive public health campaigns. Federal initiatives such as the Together TakeMeHome self-test distribution provide reliable procurement streams and keep the HIV/AIDS diagnostics market expanding steadily in mature settings. Europe sustains moderate growth through emergency-department opt-out programs and integrated care models.
APAC HIV/AIDS Diagnostics Market
Asia-Pacific is the definitive growth engine, advancing at an 11.49% CAGR to 2031. India’s National AIDS Control Programme conducted 60 million tests in 2023-24 and dispenses free treatment to more than 1.68 million patients. China’s 1.3 million-person HIV cohort and Japan’s 2024 PrEP approval build continuous demand for screening and monitoring. South Korea’s broader healthcare reforms, which include diagnostic capacity upgrades, further bolster market expansion.
MEA and LATAM HIV/AIDS Diagnostics Market
Middle East & Africa and South America trail but still represent meaningful opportunities as infrastructure investments rise. PEPFAR and Global Fund financing channels continue to anchor procurement in Sub-Saharan Africa. In Latin America, modernization of public laboratories and the gradual inclusion of self-testing in national guidelines stimulate incremental volumes, rounding out the global HIV/AIDS diagnostics market landscape.

Regulatory Landscape
Regulation of HIV/AIDS diagnostics is shaped by a dual-track compliance model, with WHO Prequalification supporting UN agency and donor procurement, while major developed markets depend on national or regional conformity assessment and post-market surveillance. WHO continued updating its prequalified in vitro diagnostics lists in 2026, including HIV rapid diagnostic tests, which helps keep products eligible for tender-based purchasing and program scale-up in resource-limited settings.
In the United States, FDA oversight covers rapid antibody/antigen screening and nucleic acid tests used for diagnosis and viral load monitoring, and manufacturers must align claims and intended use with established HIV testing algorithms. In Europe, the transition to the In Vitro Diagnostic Regulation (IVDR) remains central to CE marking. Commission Regulation (EU) 2024/1860 entered into force in July 2024 to extend transitional periods for certain legacy IVDs and reduce supply disruption risk, while EU Reference Laboratories (including the Paul Ehrlich Institute) became operational in 2026, adding scientific and performance-evaluation infrastructure that can affect evidence expectations for higher-risk assays.
Competitive Landscape
The HIV/AIDS diagnostics market shows moderate concentration, with top manufacturers combining instrumentation, reagents, and digital ecosystems. Roche, Abbott, and Siemens Healthineers continue consolidating point-of-care assets to protect installed bases. Roche’s acquisition of LumiraDx technology exemplifies the strategy to absorb emerging rivals and accelerate product cycles. Danaher’s dual Centers of Innovation sharpen its regulatory and companion-diagnostic capabilities, shortening development timelines.
M&A activity fell to 32 full-company deals in 2023, indicating selectivity and preference for bolt-on assets rather than transformative mergers. BD’s decision to divest its USD 3.4 billion IVD unit could reshuffle competitive rankings if acquired by a rival aiming to scale. AI-first platforms, such as Healthvana’s HIPAA-compliant chatbot for sexual-health clinics, point to a future where result interpretation services differentiate offerings more than hardware attributes.
Disruptors leverage CRISPR, smartphone connectivity, and pan-pathogen cartridges to target underserved niches. Yet recurring consumables revenue and regulatory experience give incumbents resilience. Overall, strategic moves center on portfolio breadth, digital add-ons, and manufacturing scale that can weather donor-driven price compression while sustaining innovation budgets.\
HIV/AIDS Diagnostics Industry Leaders
Siemens Healthineers
F. Hoffmann-La Roche Ltd
Abbott Laboratories
Thermo-Fisher Scientific Inc.
Danaher Corporation
- *Disclaimer: Major Players sorted in no particular order
HIV/AIDS Diagnostics Market Companies Covered in this Report
- Siemens Healthineers
- Roche
- Abbott Laboratories
- Danaher Corp. (Cepheid & Beckman Coulter)
- Thermo Fisher Scientific
- Merck KGaA (MilliporeSigma)
- Beckton Dickinson
- Hologic
- Bio-Rad Laboratories
- Orasure Technologies
- Chembio Diagnostics Inc.
- Omega Diagnostics Group
- QIAGEN
- bioMérieux
- QuidelOrtho Corp.
- Trinity Biotech
- Sysmex Corp.
- GenMark Diagnostics (Roche)
- Seegene
- DiaSorin
- Guangzhou Wondfo Biotech
- Access Bio

Market Opportunities and Future Outlook
Self-testing scale-up and algorithm optimization create a clearer whitespace in low-cost, quality-assured rapid tests that can keep volumes steady under constrained budgets. WHO actions in 2025 anchored this shift by promoting low-cost, WHO-prequalified rapid tests within national testing algorithms and reinforcing procurement discipline through benchmark pricing, including targets of at or below USD 0.70 for HIV RDTs and at or below USD 0.95 for dual HIV/syphilis RDTs. In this environment, manufacturers that can maintain quality systems while improving manufacturing efficiency and expanding distribution through public programs and retail channels can better protect share.
Multi-disease offerings and digitally assisted workflows also widen use beyond standalone HIV testing. WHO prequalification in July 2025 of the Determine Antenatal Care Panel, a bundled set of rapid tests for HIV, hepatitis B, and syphilis, supports integrated maternal-health screening and can shift purchasing toward panelized kits in antenatal and community settings. On the technology side, peer-reviewed research in 2025-2026 points to decentralizing viral load testing and improving usability in non-lab contexts, including a point-of-care viral load approach reported at less than USD 3 per test (with 95% sensitivity and 100% specificity in the published evaluation) and smartphone-based, AI-assisted readouts for oral-fluid-equivalent testing. Vendors that translate these capabilities into program-ready products, and add connectivity layers that reduce reliance on conventional lab pathways, can compete more effectively in settings shaped by workforce constraints and loss-to-follow-up.
Recent Industry Developments in HIV/AIDS Diagnostics Market
- March 2026: Roche launched the cobas MPX-E assay, a 4-in-1 qualitative donor screening test for HIV-1/2 and hepatitis C, B, and E viruses for the cobas x800 system. The consolidation of multiple viral targets into a single high-throughput assay streamlines blood screening workflows and supports labs seeking efficiency gains without adding separate test runs.
- March 2026: Siemens Healthineers reported verification results for the Atellica IM HIV Antigen/Antibody Combo assay on the Atellica CI analyzer, supporting consistency with the ADVIA Centaur platform. Cross-platform reliability improves operational flexibility for health systems running mixed analyzer fleets and helps protect assay share during instrument refresh cycles.
- July 2024: The European Union brought Commission Regulation (EU) 2024/1860 into force, extending certain IVDR transitional timelines for legacy in vitro diagnostic medical devices to mitigate supply shortages. The action reduced near-term discontinuation risk for some established assays while keeping pressure on manufacturers to complete IVDR technical documentation and performance-evaluation upgrades.


HIV/AIDS Diagnostics Market Report Scope and Research Methodology
Market Definition and Coverage
This market covers revenues generated from products and solutions used to detect HIV infection and to support patient monitoring in clinical and screening settings, including lab-based and point-of-care testing purchased by healthcare providers and programs.
Scope exclusions: We exclude HIV treatment drugs, general laboratory equipment not used for HIV testing, and non-diagnostic services that do not result in a reportable HIV test outcome.
Segments Covered in This Report
- By Product
- Consumables
- Instruments
- Software & Services
- By Test Type
- Antibody Tests
- Viral Load Tests
- CD4 Tests
- Others
- By Technology
- Immunoassay
- Molecular Diagnostics
- Flow Cytometry
- Others
- By End User
- Hospitals
- Diagnostic Laboratories
- At-Home Settings
- Others
- By Geography
- North America
- United States
- Canada
- Mexico
- Europe
- Germany
- United Kingdom
- France
- Italy
- Spain
- Rest of Europe
- Asia-Pacific
- China
- Japan
- India
- Australia
- South Korea
- Rest of Asia-Pacific
- Middle East and Africa
- GCC
- South Africa
- Rest of Middle East and Africa
- South America
- Brazil
- Argentina
- Rest of South America
- North America
Data Sources, Market Sizing, and Validation
Desk Research
Our desk work starts with public health demand signals and testing policy context, and then maps what is realistically bought and used across care settings. We refer to sources such as WHO guidance and country program dashboards, UNAIDS epidemiology and 95-95-95 progress tracking, and the CDC for testing recommendations and surveillance context. For boundary checks, we also use sources such as the World Bank for macro and health spend context, and peer-reviewed journals for test performance trends and adoption patterns.
On the supply side, we review company filings, investor presentations, product literature, and reputable press releases to understand portfolio mix and how revenue is recognized. When needed, we use paid subscriptions for company financials and intelligence, patent databases, and shipment-level import and export signals to sanity-check trade flows of relevant kits and components. The desk research sources listed here are illustrative, and we also drew on other public and subscription sources for data collection, validation, and clarification.
Primary Interviews and Surveys
Primary work is used to pressure-test model assumptions that are not cleanly observable in public data, especially testing mix shifts between screening and confirmatory pathways and how purchasing changes by setting. We spoke with a mix of manufacturers, distributors, laboratory managers, public health procurement stakeholders, and clinicians across APAC, EMEA, and the Americas, so regional program intensity and channel structures could be reflected more realistically.
Distribution of primary research fieldwork respondents
| Company type | Respondent position | Region |
|---|---|---|
| Top tier: 31% | CXOs: 12% | APAC: 39% |
| Mid tier: 51% | Functional/Unit leaders: 43% | EMEA: 37% |
| Smaller Players: 18% | Managers: 45% | Americas: 24% |
Market-Sizing & Forecasting
Sizing is built using a top-down approach where epidemiology, testing guidelines, and public program intensity are converted into a realistic testing volume pool by region and care setting, then translated into value using observed price bands by test category. Since utilization does not always move in a straight line with prevalence, the model is adjusted using inputs such as diagnosed population share, screening coverage in key risk groups, confirmatory testing ratios, and the split between rapid tests and lab-based methods.
To keep totals grounded, we corroborate outcomes with selective bottom-up approximations, such as sampled supplier revenue splits for HIV testing, channel checks on kit volumes, and typical price per test ranges shared by labs and procurement respondents. Where bottom-up visibility is incomplete in smaller countries, we handle gaps through proxying from similar health system profiles, then re-check against public procurement patterns and import intensity. For forecasting, we use scenario analysis supported by expert views on funding cycles and policy changes, and we track variables like ART program scale-up, adoption of self-testing, viral load monitoring frequency, and shifts in donor support that can move demand faster than demographics alone.
Data Validation & Update Cycle
Estimates are validated through triangulation across independent signals, where model outputs are compared with testing volumes reported by programs, procurement cues, and the implied spending envelope that health budgets can support. Variance checks are run across regions and test types, and any sharp jumps are reviewed to confirm they link back to a clear driver such as guideline changes, tender timing, or pricing resets.
Before sign-off, the model and assumptions go through multi-step analyst review so the calculation logic, units, and currency conversions stay consistent. If a key input moves or a new policy or funding event is identified, we re-contact relevant respondents to re-check the assumption and update the model. Reports are refreshed annually, with interim updates for material events, and a final pre-delivery scan is completed so clients receive the latest updated view.
Mordor Intelligence's Hiv Aids Diagnostics Market Size Measured Against Other Published Estimates
Published market sizes for HIV/AIDS diagnostics often do not match because each publisher draws the scope line differently and then applies its own pricing, utilization, and currency assumptions. Differences also show up when one estimate is anchored to program testing volumes, while another leans more heavily on supplier revenues or a narrower product definition.
The table reflects a spread in 2024 to 2026 values. In Mordor Intelligence's model, the market includes consumables, instruments, and software and services tied to HIV testing and monitoring across lab, hospital, and at-home settings, which can lift totals versus studies that focus mainly on test kits or a limited testing pathway.
Benchmark comparison
| Source | Market Size | Gaps in Research Methodology |
|---|---|---|
| Mordor Intelligence | USD 4.02 B (2026) | |
| Global Consultancy A | USD 3.42 B (2024) | This estimate appears to anchor earlier to a base year and may apply a narrower product capture, which can undercount monitoring-related volumes and associated platform-linked revenues in some regions. |
| Industry Research Group B | USD 2.96 B (2024) | The figure is likely more kit-centric and can treat instruments as a pass-through or exclude software and services, and it may use different average selling price progression assumptions across rapid tests versus lab methods. |
Overall, the gaps mostly come from what is counted as an HIV diagnostics revenue item, how the testing pathway is converted into volumes, and how prices are carried forward year to year. By keeping inputs tied to observable testing activity and cross-checking with supplier and channel signals, we aim to produce a practical number that can be traced back to clear, repeatable steps rather than broad averaging.


Key Questions Answered in the Report
What is the current size of the HIV/AIDS diagnostics market?
The HIV/AIDS diagnostics market stands at USD 4.02 billion in 2026 and is expected to reach USD 6.64 billion by 2031.
Which segment is growing fastest within the market?
Viral load testing registers the highest forecast CAGR of 11.27% owing to its central role in treatment monitoring.
Why is Asia-Pacific considered the primary growth engine?
Government initiatives in India and China, rising incidence, and expanding PrEP programs push Asia-Pacific to an 11.49% CAGR through 2031.
How are self-testing trends influencing market dynamics?
Large-scale programs such as the CDC’s Together TakeMeHome have shown that self-testing reaches first-time users, driving volume and shifting demand toward at-home channels.
What challenges do manufacturers face in donor-funded markets?
Bulk tenders from PEPFAR and the Global Fund reduce average selling prices, demanding high manufacturing efficiency to preserve margins.
Who are the leading companies in the HIV/AIDS diagnostics industry?
Roche, Abbott, and Siemens Healthineers hold dominant positions through integrated platforms, while emerging firms focus on AI-based and CRISPR-enabled diagnostics.
Page last updated on:


 Your data is secure and never sold or shared.


