
Higher Education Learning Systems Market Size and Share
Market Overview
| Study Period | 2020 - 2031 |
|---|---|
| Market Size (2026) | USD 10.54 Billion |
| Market Size (2031) | USD 20.83 Billion |
| Growth Rate (2026 - 2031) | 14.61 % |
| Fastest Growing Market | Asia Pacific |
| Largest Market | North America |
| Market Concentration | Medium |
Major Players *Disclaimer: Major Players sorted in no particular order Image © Mordor Intelligence. Reuse requires attribution under CC BY 4.0. | |
Higher Education Learning Systems Market Analysis by Mordor Intelligence
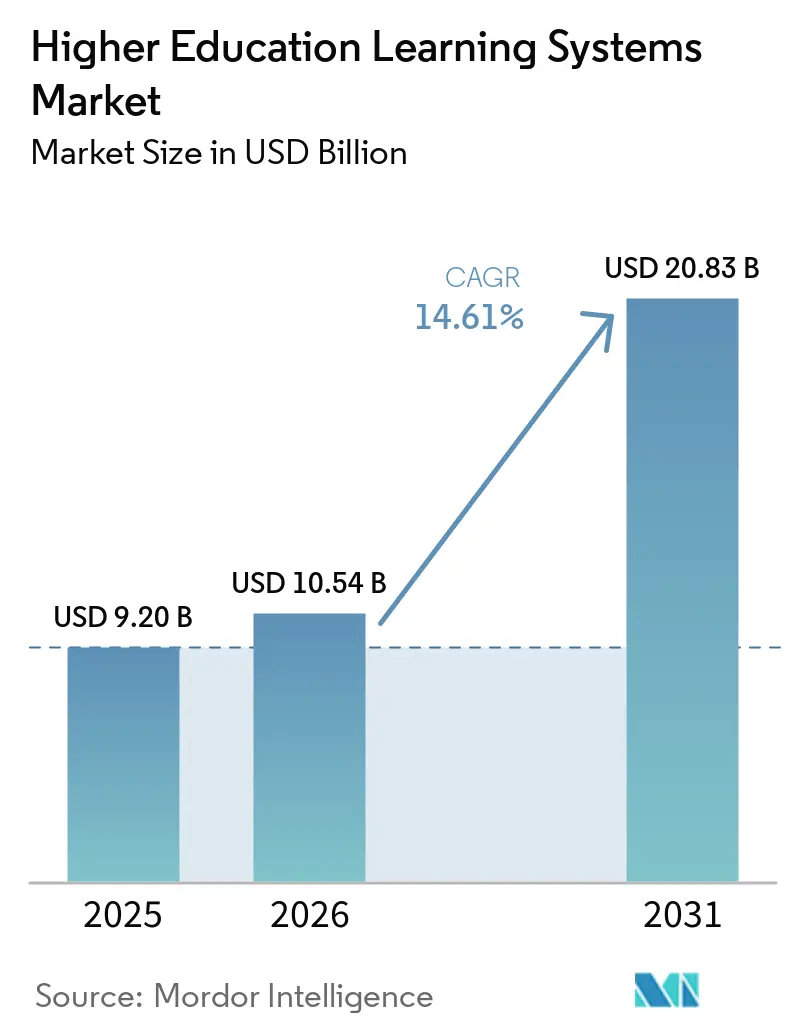
The higher education learning systems market size was valued at USD 9.20 billion in 2025 and estimated to grow from USD 10.54 billion in 2026 to reach USD 20.83 billion by 2031, at a CAGR of 14.61% during the forecast period (2026-2031). Rapid cloud adoption, the mainstreaming of AI-powered personalization, and government stimulus programs are reshaping institutional technology strategies while intensifying competition among platform vendors. Institutions are prioritizing SaaS deployments to curb data center spending, deliver anywhere access for mobile learners, and simplify version management. AI-driven recommendation engines embedded in learning-management platforms are enhancing retention by identifying at-risk students earlier, prompting a shift from focusing on feature quantity to achieving measurable student success outcomes. Meanwhile, tight cybersecurity mandates and widening skills gaps in EdTech administration temper rollout velocity, creating robust demand for specialized services that guide migrations and change management.
Key Report Takeaways
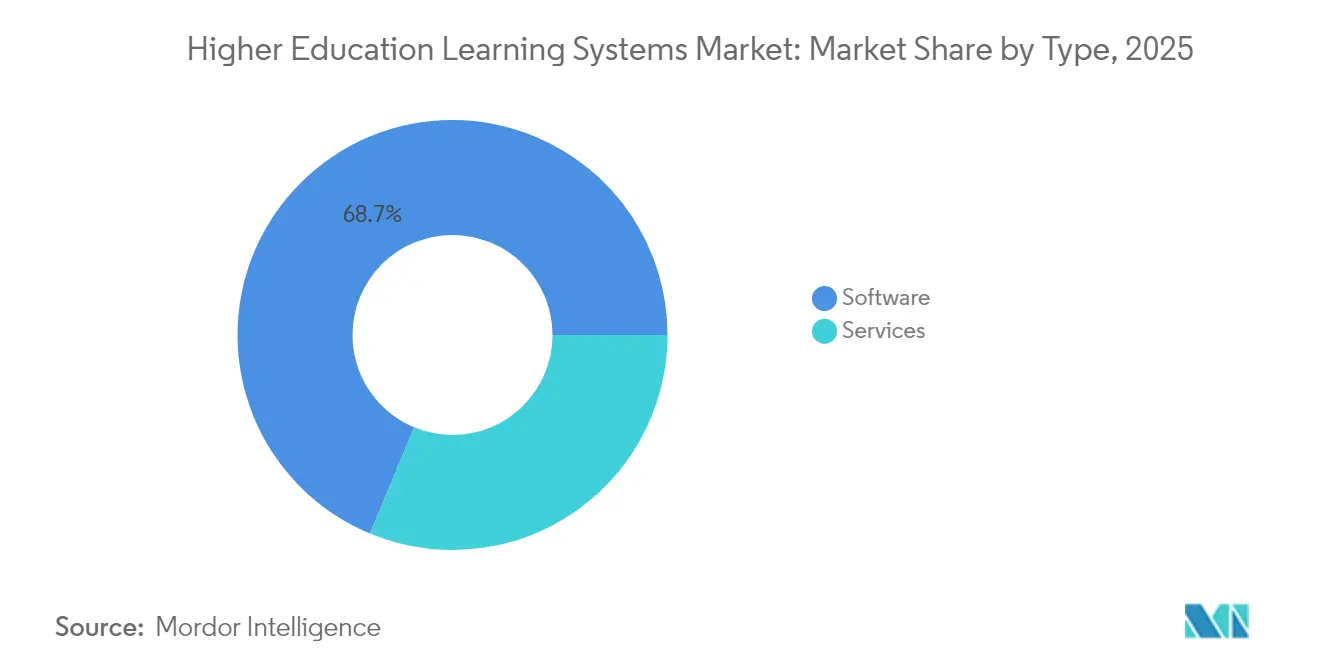
- By type, software accounted for 68.74% of the higher education learning systems market share in 2025, whereas the services segment is forecast to grow at a 15.94% CAGR to 2031, underscoring the mounting complexity of implementation.
- By deployment model, cloud deployments held 72.36% of the higher education learning systems market size in 2025 and are expected to expand at a 15.89% CAGR through 2031, as institutions adopt multi-tenant SaaS platforms.
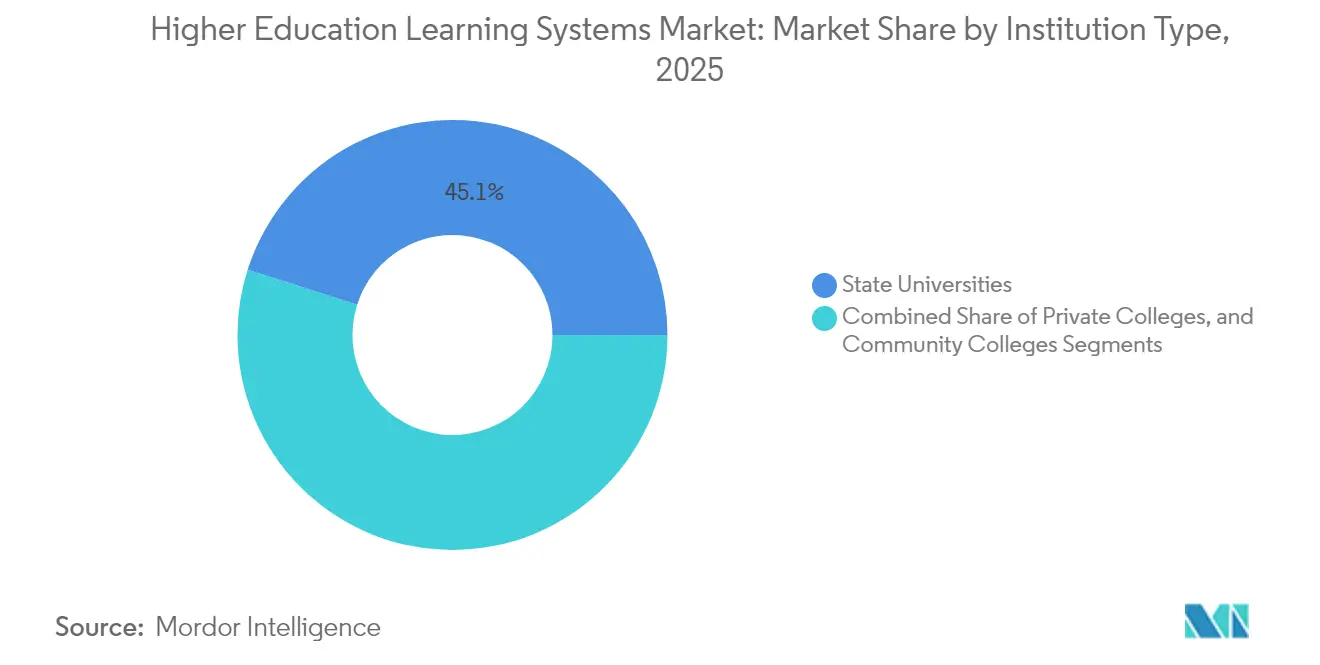
- By institution type, state universities led spending with a 45.10% share in 2025, while community colleges are poised for a 16.63% CAGR on the back of targeted digital equity appropriations.
- By learning mode, hybrid and blended formats captured 40.76% of deployments in 2025 and are projected to grow at a 16.37% CAGR through 2031, reflecting lasting shifts toward flexible pedagogy.
- By geography, North America commanded 39.72% of the 2025 revenue, yet the Asia Pacific is expected to post the fastest regional growth at a 16.94% CAGR through 2031, as China and India scale digital campus initiatives.
Note: Market size and forecast figures in this report are generated using Mordor Intelligence’s proprietary estimation framework, updated with the latest available data and insights as of 2026.
Market Trends and Insights
Drivers Impact Analysis of Higher Education Learning Systems Market*
| Driver | (~) % Impact on CAGR Forecast | Geographic Relevance | Impact Timeline |
|---|---|---|---|
| Increasing cloud-first strategies among higher-ed institutions | +3.2% | Global, with highest adoption in North America and Europe | Short term (≤ 2 years) |
| Proliferation of AI-powered adaptive learning tools | +2.8% | North America, Asia Pacific core, spillover to Europe | Medium term (2-4 years) |
| Government digital-campus stimulus packages | +2.1% | Australia, Ireland, United Kingdom, select US states | Short term (≤ 2 years) |
| Rapid international student mobility driving multi-tenant architectures | +1.7% | North America, United Kingdom, Australia, emerging in Asia Pacific | Medium term (2-4 years) |
| Campus-wide demand for learning analytics dashboards | +1.9% | Global, led by state universities in North America and Europe | Medium term (2-4 years) |
| Sustainability mandates pushing paperless workflows | +1.4% | Europe, North America, select Asia Pacific markets | Long term (≥ 4 years) |
| Source: Mordor Intelligence | |||
Increasing Cloud-First Strategies Among Higher-Ed Institutions
Universities are dismantling on-premises data centers in favor of elastic SaaS environments that compress capital outlays, expand uptime, and shorten feature-release cycles. Internet2’s NET+ survey revealed that 78% of member institutions had transitioned at least one core academic system to the cloud by mid-2024, up from 54% in 2022. Australia’s NCRIS fund tied AUD 750 million (USD 488 million) to cloud migration milestones, catalyzing accelerated adoption across the sector.[1] Cloud platforms also streamline integrations with collaboration and AI services that on-premises stacks struggle to support. Compliance drivers reinforce momentum as ISO/IEC 27001 certification gains de facto status for vendors courting higher education clients. Collectively, these factors contribute more than three percentage points to the higher education learning systems market CAGR during the short term.
Proliferation of AI-Powered Adaptive Learning Tools
AI-driven personalization has moved beyond pilots, scaling across production environments to raise completion metrics. Tel Aviv University’s TAUDT system lowered first-year STEM attrition by 12% in 2024 through natural-language-generated study plans.[2] Pearson’s AI tutor delivered 1.2 million adaptive assessments the same year, lifting remedial-math pass rates by 15%. In early 2025, the University of California deployed predictive early-warning systems system-wide to flag at-risk students, broadening AI reach to 285,000 learners. These successes spur platform vendors to embed machine-learning APIs natively, driving nearly three percentage points of incremental CAGR over the medium term while elevating conversations around algorithmic transparency and IEEE-aligned ethics.
Government Digital-Campus Stimulus Packages
Public-sector infusions are closing funding gaps that tuition revenues cannot bridge. Ireland’s INSPIRE program committed EUR 750 million (USD 848 million) in 2024 to achieve full-cloud adoption by 2027. The U.K. Office for Students distributed GBP 92 million (USD 117 million) to analytics and accessibility projects, contingent on retention improvements. Eighteen U.S. states earmarked FY 2024 appropriations for LMS upgrades and cyber-hardening. These conditional grants hasten procurement cycles, standardize interoperability requirements, and contribute just over two percentage points to forecast expansion.
Campus-Wide Demand for Learning Analytics Dashboards
Real-time data visualizations help faculty track engagement and intervene early. Civitas Learning’s platform, active at 385 institutions in 2024, improved retention by an average of 8%.[3] Anthology’s Illuminate logged 42 million dashboard views the same year, facilitating data-informed pacing adjustments. The University of Michigan added a Canvas-based analytics layer in 2025 to alert advisors when submission behaviors deviate from historical norms. These investments add nearly two percentage points to growth as dashboards shift from optional to essential.
Restraints Impact Analysis of Higher Education Learning Systems Market*
| Restraint | (~) % Impact on CAGR Forecast | Geographic Relevance | Impact Timeline |
|---|---|---|---|
| Escalating cybersecurity and data-privacy compliance costs | -2.3% | Global, with highest burden in North America and Europe due to FERPA and GDPR | Short term (≤ 2 years) |
| Skills gap in EdTech systems administration | -1.8% | Global, acute in community colleges and smaller private institutions | Medium term (2–4 years) |
| Budget freezes at community colleges | -1.4% | United States, select regions in Europe and Latin America | Short term (≤ 2 years) |
| Vendor lock-in concerns over proprietary ecosystems | -1.1% | Global, particularly affecting institutions with legacy on-premises systems | Medium term (2–4 years) |
| Source: Mordor Intelligence | |||
Escalating Cybersecurity and Data-Privacy Compliance Costs
The median security spend per institution reached USD 1.2 million in 2024, a 23% increase from 2022, as FERPA and GDPR audits intensified. European universities faced EUR 1.2 billion in GDPR fines during 2023, driving emergency budget reallocations. The University of California invested USD 14 million in ransomware remediation and monitoring following the 2024 breach. These costs siphon funds from innovation and subtract more than two percentage points from growth during the near term.
Skills Gap in EdTech Systems Administration
In 2024, 62% of IT directors reported difficulty hiring cloud-architecture talent, while 54% cited analytics expertise as a critical gap. Community-college salary disparities exacerbate the shortage, prompting the California Community Colleges system to invest USD 12 million in upskilling 500 staffers.[4] Faculty capability gaps persist, dampening feature adoption and dragging CAGR by almost two percentage points over the medium horizon.
*Our forecasts treat driver/restraint impacts as directional, not additive. The impact forecasts reflect baseline growth, mix effects, and variable interactions.
Higher Education Learning Systems Market Segment Analysis
By Type:
Services Address Complexity and Drive OutcomesServices revenue, including consulting, integration, training, and managed support, is projected to rise at a 15.94% CAGR through 2031, outstripping software, even though the latter captured 68.74% of 2025 spending. AI-enabled systems measure skill acquisition, link training to performance metrics, and integrate with HR suites, cementing the education software market as a strategic pillar of talent management. Institutions increasingly view platform rollouts as change-management journeys, engaging integrators to migrate legacy content, configure single sign-on, and build custom analytics layers. Accenture’s higher-education practice grew 19% in 2024, driven by demand for cloud-migration roadmaps that align with FERPA and GDPR guardrails. The higher education learning systems market benefits as service providers quantify retention lifts and cost savings, repositioning technology as an outcome driver rather than a procurement checklist.
Ongoing managed-service contracts reduce strain on lean campus IT teams and ensure regulatory patches are applied on schedule. Niche firms specializing in AI-powered tutoring, plagiarism detection, or accessibility remediation monetize open APIs that characterize the higher education learning systems industry. Over the forecast period, institutions will emphasize evidence-based ROI metrics, such as graduation rates, credit completion velocity, and employability, encouraging deeper advisory engagements. As a result, services are set to command a growing slice of the higher education learning systems market by 2031.

By Deployment Model:
Cloud Dominance AcceleratesCloud deployments owned 72.36% of the higher education learning systems market in 2025 and are poised for a 15.89% CAGR through 2031 as SaaS becomes the default for new procurements. The University of Edinburgh completed a three-year migration to AWS in 2025, saving GBP 1.8 million (USD 2.3 million) annually while easing peak-load scaling. FedRAMP, ISO/IEC 27001, and similar attestations are now the minimum entry requirements, boosting confidence in the off-premises storage of sensitive student data. Multi-tenant designs allow vendors to push feature updates without campus downtime, shortening innovation cycles across the higher education learning systems market.
Hybrid models persist where data-residency statutes require local storage or where legacy research compute clusters remain on-site. Nonetheless, even cautious institutions offload compute-intensive tasks, such as video transcoding, to public clouds to manage burst workloads. Reduced maintenance windows, predictable subscription pricing, and automated patching cement cloud’s trajectory, ensuring its share of the higher education learning systems market size widens steadily.
By Institution Type:
Community Colleges Lead GrowthCommunity colleges are forecast to have a 16.63% CAGR through 2031, outpacing their state and private peers as performance-funding policies reward improved completion metrics. California budgeted USD 85 million in 2024 to standardize an LMS across 116 campuses, centralizing analytics and reporting. Affordability pressures are pushing two-year institutions toward SaaS solutions that bundle security, accessibility, and analytics, thereby lowering the total cost of ownership. State universities, which account for 45.10% of the 2025 spending, review technology ROI more rigorously, lengthening procurement cycles while sustaining high absolute expenditures.
Private colleges invest in premium AI coaching and VR labs to differentiate themselves, but face enrollment headwinds that dampen their expansion. The higher education learning systems market share for community colleges is expected to rise as digital equity mandates channel public funds toward underserved learner segments, further diversifying vendor requirements and accelerating volume growth within this customer cohort.
By Learning Mode:
Hybrid Models Cement Post-Pandemic GainsHybrid and blended courses accounted for 40.76% of deployments in 2025 and are projected to advance at a 16.37% CAGR through 2031, embedding flexible pedagogy into mainstream practice. The University of Central Florida reported hybrid completion rates seven percentage points higher than fully online sections in 2024, demonstrating improved engagement when face-to-face touchpoints are maintained. HyFlex designs empower learners to switch attendance modes each week, necessitating tight video-conferencing integration and real-time polling features within LMS platforms.
Instructor-led formats remain essential for labs and clinical rotations; however, digital simulations now supplement in-person practice, thereby shortening seat-time requirements. Self-paced enrollment surges in continuing education, but higher dropout rates spur institutions to embed AI nudges that prompt steady progress. These dynamics ensure that the higher education learning systems market continues to shift toward modality-agnostic architecture, capable of delivering consistent experiences across synchronous and asynchronous channels.
Geography Analysis
North America Higher Education Learning Systems Market
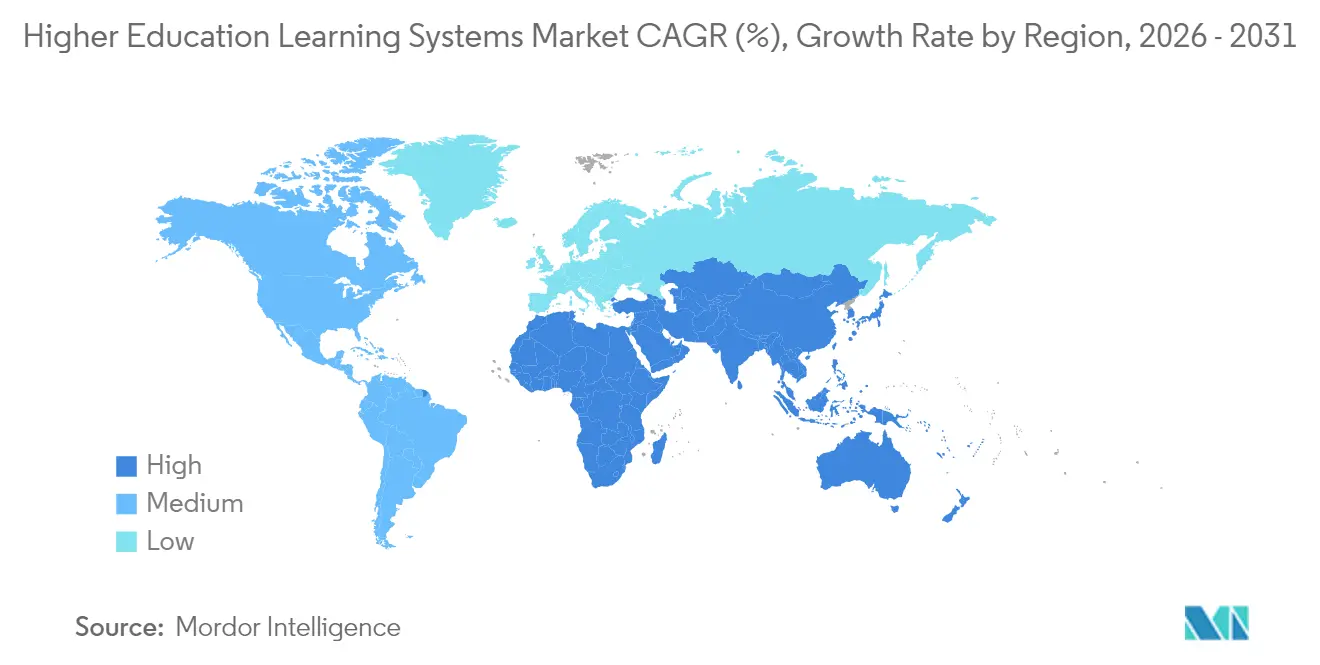
North America generated 39.72% of global revenue in 2025, fueled by large state systems, private endowment spending, and robust IT budgets. Mature platform penetration moderates regional CAGR, yet ongoing refresh cycles and analytics upgrades sustain steady expansion. Stringent FERPA compliance obligations and frequent ransomware incidents also drive sustained cybersecurity spending, adding incremental service opportunities.
APAC Higher Education Learning Systems Market
The Asia Pacific is forecast to lead growth at a 16.94% CAGR through 2031, as China and India deploy national digitization blueprints. China’s Ministry of Education has earmarked CNY 15 billion (USD 2.1 billion) to modernize 200 universities, aiming for 80% cloud adoption by 2027. India’s National Education Policy aims for a 50% gross enrollment rate by 2035, necessitating a massive expansion of online capacity. Southeast Asian governments emulate these models, leveraging multi-tenant architectures to support multilingual users and variable bandwidth conditions.
EMEA and South America Higher Education Learning Systems Market
Europe maintains steady growth underpinned by Erasmus-style student mobility and strict GDPR mandates that elevate vendor vetting. The U.K. Office for Students’ GBP 92 million grant program links funding to analytics-driven retention improvements, stimulating platform upgrades. South America shows uneven progress; Brazil’s public universities adopt LMS platforms quickly, whereas smaller economies struggle with connectivity. The Middle East, led by Saudi Arabia’s USD 1.3 billion Vision 2030 EdTech plan, prioritizes smart campus rollouts to diversify its economies. Africa remains nascent, yet it records pockets of double-digit growth as distance learning addresses rural access.
Regulatory Landscape
Regulation for higher education learning systems is tightening around accessibility, privacy, and accountable use of AI, which is raising baseline requirements for LMS and analytics vendors selling into public-sector institutions. In the United States, digital accessibility compliance tied to the Americans with Disabilities Act (Title II) is being operationalized against WCAG 2.1 Level AA for public colleges and universities, while FERPA-driven controls continue to shape vendor contracting, audit rights, and incident reporting expectations.
AI governance is increasingly treated as a procurement constraint alongside privacy. In March 2026, UNESCO, UNICEF, and ITU released the Charter for Public Digital Learning Platforms, reinforcing public-sector expectations on data protection, transparency, and platform governance. In Europe, EU-level activity around AI in education and the EU AI Act adds transparency and documentation obligations for AI-enabled learning features, with enforceable transparency requirements (for example, labeling AI-generated content and disclosing AI interactions) becoming a concrete compliance checkpoint as 2026 timelines progress.
Value Chain Analysis
The value chain starts with content and pedagogy design (faculty, instructional designers, libraries, and publishers) and moves into platform provisioning and operations. In this layer, LMS vendors, student information system (SIS)/ERP providers, identity providers (SSO), and cloud infrastructure partners supply the core digital backbone. Delivery and orchestration layers cover analytics (dashboards, learning record stores), assessment/proctoring, collaboration and video, and a growing set of AI services embedded through APIs. Implementation partners and campus IT teams then operationalize integrations, data governance, and change management, while accreditation and compliance bodies influence requirements for accessibility, privacy, retention reporting, and distance learning controls.
Recent partnerships point to value being co-created across larger ecosystems rather than within a single vendor stack. Pearson announced a multi-year partnership with Microsoft in January 2025 to integrate Azure cloud and AI infrastructure into its content and assessment platforms. On the institution side, the California State University system announced a broad AI initiative in February 2025 with major technology providers (including Microsoft, OpenAI, Google, Adobe, AWS, IBM, Instructure, Intel, and NVIDIA) to deploy AI tooling across 23 campuses. These moves shift spend and decision-making toward centralized infrastructure and governable integrations, while also highlighting dependencies on hyperscaler cloud services, data and identity plumbing, and specialized services talent as the main deployment bottlenecks and cost drivers.
Competitive Landscape
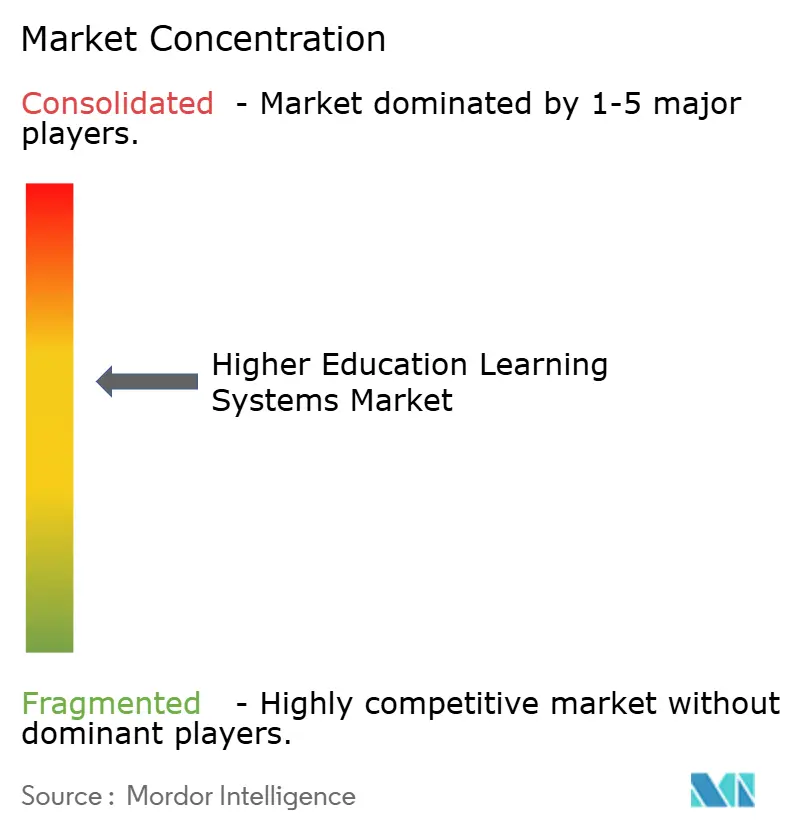
The higher education learning systems market exhibits moderate concentration, with the top five vendors capturing approximately 55% of the 2024 software revenue. Instructure, Anthology, and Blackboard defend incumbency through bundled enterprise agreements that integrate LMS, SIS, and analytics, leveraging data lock-in to deter churn. However, interoperability standards like IMS Global’s Learning Tools Interoperability compel providers to open APIs, lowering switching barriers and enabling multi-vendor ecosystems.
Open-source contender Moodle reported 420 million users across 245,000 sites in 2024, underscoring its potential for fragmentation. AI-native upstarts deliver standalone analytics or adaptive-learning engines that can be bolted onto any LMS, exploiting incumbents’ slower innovation cycles. Patent activity in automated grading and natural language processing rose sharply, with IBM, Oracle, and SAP each filing more than 20 education-related patents in 2024. Accessibility compliance to WCAG 2.1 AA and Section 508 emerges as a differentiator, as litigation risk rises for non-conforming platforms.
Strategic moves reinforce competitive intensity. Instructure committed USD 150 million in 2025 to scale its AI assistant across 1,200 institutions. Anthology’s USD 320 million acquisition of Civitas fused LMS and predictive analytics capabilities, serving 40 million students globally. Ellucian partnered with Microsoft Azure to integrate AI services into its ERP suites, enabling the use of chatbots and predictive enrollment models. These maneuvers signal continued convergence of content delivery, analytics, and administrative workflows under unified vendors, even as modular architectures invite specialist plug-ins.
Higher Education Learning Systems Industry Leaders
-
Cornerstone OnDemand, Inc.
-
Jenzabar, Inc.
-
Blackboard Inc.
-
SAP SE
-
Desire2Learn Corporation
- *Disclaimer: Major Players sorted in no particular order
Higher Education Learning Systems Market Companies Covered in this Report
- Anthology Inc.
- Blackboard Inc.
- Cornerstone OnDemand Inc.
- Desire2Learn Corporation
- Ellucian Company L.P.
- Epignosis LLC
- IBM Corporation
- iSpring Solutions Inc.
- Instructure Holdings Inc.
- Jenzabar Inc.
- McGraw Hill LLC
- Moodle Pty Ltd.
- Oracle Corporation
- Pearson PLC
- SAP SE
- SumTotal Systems LLC
- The rSmart Group Inc.
- Unifyed LLC
- Workday Inc.
- Civitas Learning Inc.
Read Analysis of Higher Education Learning Systems Companies
Market Opportunities and Future Outlook
A clear opportunity is systemwide standardization of LMS and shared services that consolidate fragmented campus tools into a governed platform layer, supporting demand for migration, integration, accessibility remediation, and managed support. For example, in April 2026 the University of Hawaiʻi directed that online instruction be delivered through the Lamakū learning management system beginning Summer 2026, a type of mandate that accelerates institution-wide rollouts and reduces long-tail legacy platforms. In the United States, North Carolina enacted legislation requiring a competitive solicitation for a systemwide LMS for the community college system, with a transition completion deadline by December 31, 2027. This is set up to support multi-year implementation and a services pipeline tied to common templates, analytics, and security baselines.
A second opportunity is operationalizing AI governance inside learning environments, which changes buying criteria from standalone AI tools to LMS-embedded, auditable capabilities. In May 2026, SUNY required its campuses to adopt or update AI guidelines by December 31, 2026, and the University of Maine System announced a shared AI tool contract beginning July 1, 2026. Together, these signals point to centrally managed AI usage across teaching, learning support, and student success. In parallel, network and cloud foundation upgrades are being funded as prerequisites for dense digital learning and AI workloads, including Georgetown University selecting Cisco for a Wi-Fi 7 deployment (announced January 2026). These programs create space for vendors to package compliant AI features, analytics, and accessibility with verifiable governance controls, alongside service partners that can implement secure integrations across LMS, SIS, and identity systems.
Recent Industry Developments in Higher Education Learning Systems Market
- May 2026: Cornerstone OnDemand launched Cornerstone Workforce AI, positioning an intelligence layer for skills and workforce readiness use cases that overlap with higher education continuing education and career services workflows. The release increases competitive pressure on learning platforms to add agentic and skills-graph capabilities as differentiated value, not just course delivery.
- March 2026: Blackboard (formerly Anthology) emerged from Chapter 11 as a debt-free, stand-alone company with a renewed focus on core teaching and learning solutions, including the Blackboard LMS. The restructuring alters competitive dynamics by sharpening product and investment priorities and can influence multi-year contract renewals and platform consolidation decisions across institutions.
- April 2024: Jenzabar launched a cloud-based finance solution for higher education business offices. The move strengthens vendor positioning in integrated campus administrative workflows, supporting cross-sell into learning systems ecosystems where institutions prefer unified procurement and interoperable cloud platforms.
Higher Education Learning Systems Market Report Scope and Research Methodology
Market Definition and Coverage
This market covers revenues earned from software and related services used by higher education institutions to plan, deliver, manage, and measure teaching and learning activities across on-campus and online settings.
Scope exclusions: K-12 focused platforms and corporate training systems are excluded unless they are sold and used specifically for higher education use cases.
Segments Covered in This Report
- By Type
- Software
- Services
- By Deployment Model
- Cloud
- On-Premises
- By Institution Type
- State Universities
- Private Colleges
- Community Colleges
- By Learning Mode
- Instructor-Led
- Self-Paced
- Hybrid/Blended
- By Geography
- North America
- United States
- Canada
- Mexico
- South America
- Brazil
- Argentina
- Rest of South America
- Europe
- Germany
- United Kingdom
- France
- Italy
- Spain
- Russia
- Rest of Europe
- Asia Pacific
- China
- Japan
- India
- South Korea
- Australia
- Rest of Asia Pacific
- Middle East and Africa
- Middle East
- Saudi Arabia
- United Arab Emirates
- Turkey
- Rest of Middle East
- Africa
- South Africa
- Nigeria
- Egypt
- Rest of Africa
- Middle East
- North America
Data Sources, Market Sizing, and Validation
Desk Research
Desk work started with building a simple fact base using higher education enrollment figures, digital learning adoption signals, and observed institutional IT spending patterns. We then mapped how learning systems are typically purchased and renewed across universities, colleges, and higher education consortia.
To keep student and institution counts consistent across regions, we relied on public sources such as the National Center for Education Statistics (IPEDS), UNESCO Institute for Statistics, OECD Education at a Glance, and World Bank education indicators. To connect demand signals to budgets, we also reviewed university procurement notices, public annual reports, and audited financial statements where they were available, then added press releases and reputable education technology news coverage for product positioning and pricing context. When needed, patent and standards references were checked to confirm feature direction (for example, analytics and remote proctoring tie-ins). For revenue triangulation, a paid subscription database for company financials and news was used to validate revenue splits for a sample of suppliers.
The specific sources named here are illustrative, and many other public documents were also used to cross-check data points and clarify assumptions.
Primary Interviews and Surveys
Primary inputs were collected through expert interviews and structured surveys with higher education IT leaders, learning and teaching administrators, and solution providers. The respondent input was used to confirm buying cycles, deployment preference shifts, and typical contract structures, especially around software licensing and the associated implementation and support services.
To avoid one-region bias, we covered demand and supply perspectives across major geographies, and then used follow-up calls when desk findings and field feedback did not align on pricing or adoption pace.
Distribution of primary research fieldwork respondents
| Company type | Respondent position | Region |
|---|---|---|
| Top tier: 36% | CXOs: 14% | APAC: 46% |
| Mid tier: 48% | Functional/Unit leaders: 41% | EMEA: 36% |
| Smaller Players: 16% | Managers: 45% | Americas: 18% |
Market-Sizing & Forecasting
Sizing used a top-down approach where enrollment and institution counts, together with digital and blended learning penetration, were translated into an addressable demand pool for higher education learning systems. That demand pool was then converted into spend using typical contract values and renewal patterns.
To stress-test the totals, we also ran selective bottom-up checks, including sampled supplier revenue roll-ups by region, channel feedback on deal sizes, and a simple ASP times volume sanity check for large clusters of public institutions.
Key inputs used in the model included higher education student enrollment trends, the share of courses delivered online or in hybrid formats, cloud versus on-premises deployment mix, average contract duration and renewal rates, and typical services attach rates for implementation and support. Where vendor revenue disclosures were incomplete, we filled gaps using conservative proxy ratios from comparable public peers, then re-tested those assumptions using interview feedback. Forecasts were built using scenario analysis, where base, conservative, and accelerated adoption paths were aligned to budget flexibility, digital learning policy direction described by respondents, and the pace of platform modernization.
Data Validation & Update Cycle
Validation was done through multiple checks, starting with internal consistency tests across enrollment, institution counts, and implied spending per student or per institution. We then compared outcomes with observed deal ranges provided during interviews.
Outliers, sudden step changes, and region-level variances were reviewed by another analyst. Assumptions were adjusted only after the supporting evidence was documented and re-confirmed.
Reports are refreshed annually, and interim updates are made when material events affect budgets, adoption, or procurement timing. Before delivery, a final review pass is completed so clients receive an updated view that reflects the latest public indicators and any new interview feedback that changes model inputs.
Mordor Intelligence's Higher Education Learning Systems Market Sizing Compared With Other Published Estimates
Published market values for higher education learning systems can differ significantly, even when the topic sounds similar. Scope boundaries and what each publisher counts as system revenue can shift, for example between learning platforms versus broader campus system bundles. Differences also come from pricing logic, how services are treated, and how frequently assumptions are refreshed when universities change their delivery models.
The benchmark table shows a wide spread. In the Mordor Intelligence model, the value reflects higher education learning systems revenues tied to teaching and learning delivery, captured across software and related services, rather than bundling adjacent campus systems that are not primarily learning platforms.
Benchmark comparison
| Source | Market Size | Gaps in Research Methodology |
|---|---|---|
| Mordor Intelligence | USD 10.54 B (2026) | |
| Industry Publisher A | USD 11.39 B (2025) | Uses a different base year and typically centers the scope on higher education LMS software, which can shift totals if services and broader learning system functions are treated differently. |
| Industry Publisher B | USD 133.60 B (2025) | Appears to include a wider bundle of higher education systems such as student information, content management, and assessment systems, which expands the market far beyond learning systems defined around instruction delivery. |
When the scope stays anchored to learning platform software and the related service revenue that directly supports higher education teaching and learning, the market size stays traceable to clear demand drivers like enrollment, course delivery mix, and contract patterns. When broader campus administration or multi-system suites are added, the number grows quickly, even if the underlying learning platform spend has not changed at the same pace.
Key Questions Answered in the Report
How large is the higher education learning systems market in 2026?
The higher education learning systems market size is USD 10.54 billion in 2026, and it is on track to hit USD 20.83 billion by 2031.
Which deployment model is growing fastest?
Cloud deployments are expanding at a 15.89% CAGR through 2031 as institutions prefer SaaS for cost control and rapid feature updates.
Why are community colleges investing heavily in learning systems?
State-level performance funding and digital-equity mandates are driving a 16.63% CAGR for community colleges, the fastest among institution types.
What is the main driver of hybrid learning adoption?
Higher completion rates and scheduling flexibility push hybrid and blended formats, which already hold 40.76% share and are growing at 16.37% CAGR.