High Vacuum Filling Machine Market Size and Share
Market Overview
| Study Period | 2020 - 2031 |
|---|---|
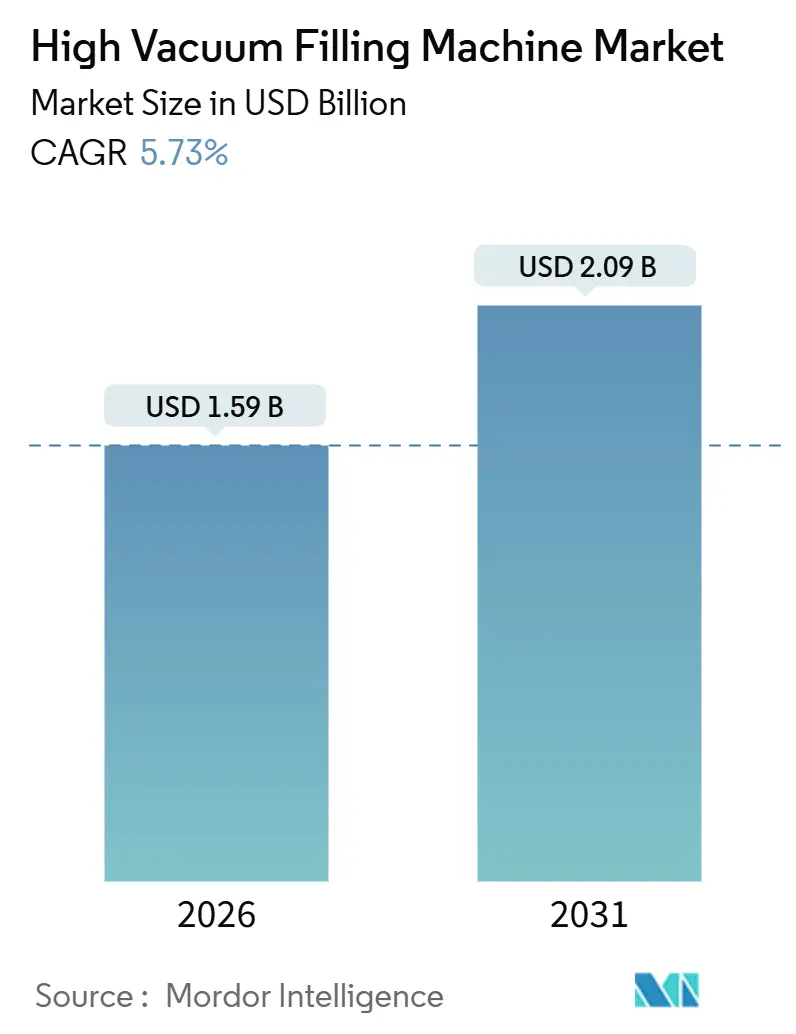
| Market Size (2026) | USD 1.59 Billion |
| Market Size (2031) | USD 2.09 Billion |
| Growth Rate (2026 - 2031) | 5.73% CAGR |
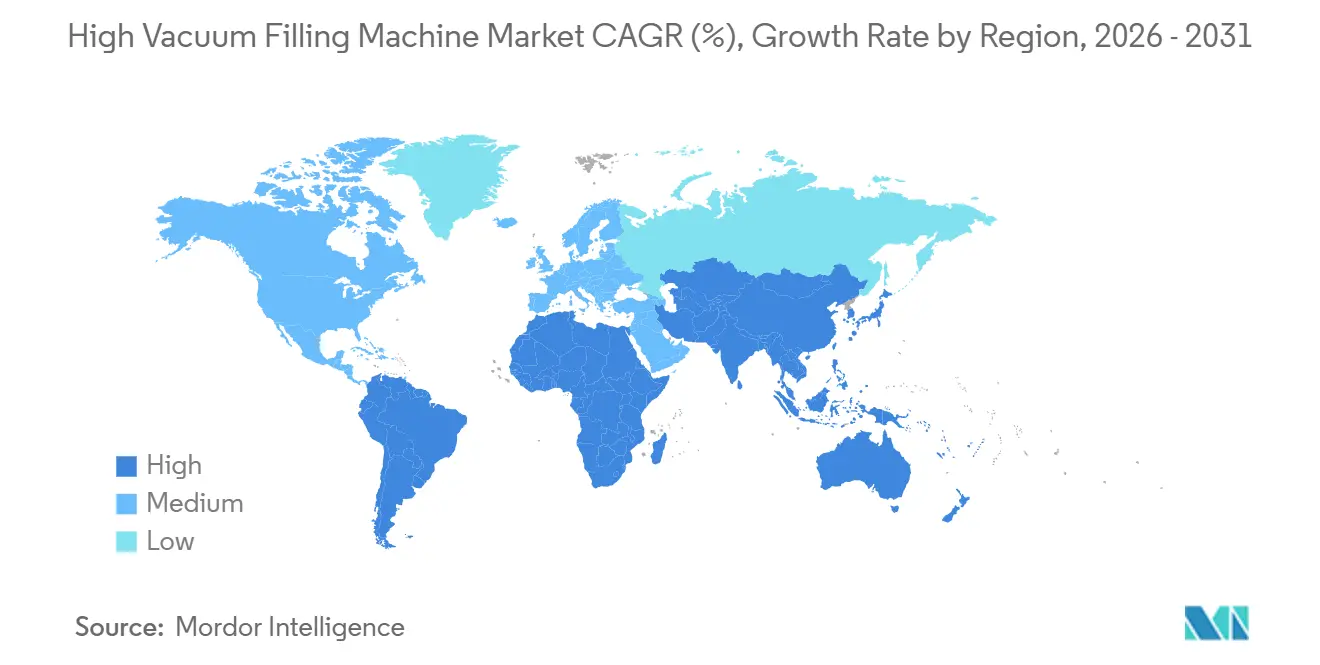
| Fastest Growing Market | Asia Pacific |
| Largest Market | Asia Pacific |
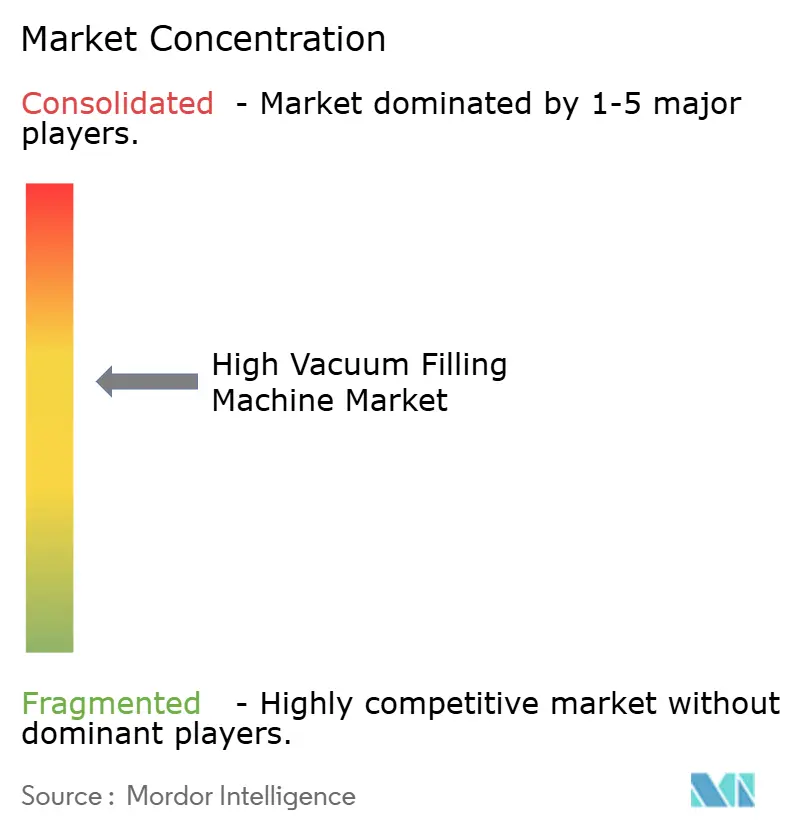
| Market Concentration | Medium |
Major Players
*Disclaimer: Major Players sorted in no particular order Image © Mordor Intelligence. Reuse requires attribution under CC BY 4.0. |
|
High Vacuum Filling Machine Market Analysis by Mordor Intelligence
The high vacuum filling machine market size reached USD 1.59 billion in 2026 and is projected to reach USD 2.09 billion by 2031, reflecting a 5.73% CAGR over the forecast period. The growing adoption of lithium-ion and emerging battery chemistries, stricter ambient-shelf-life requirements for packaged foods, and the shift toward preservative-free premium cosmetics are expanding the addressable market. At the same time, Industry 4.0 retrofits are shifting capital budgets toward fully automated, data-rich lines, and energy-efficient dry-screw pumps are reducing lifetime operating costs. Capacity buildouts at gigafactories, along with regulatory harmonization around FDA 21 CFR Part 113 and EU Regulation 1935/2004, are amplifying demand for precision vacuum filling that removes residual oxygen to below 0.5 ppm. Competitive strategies now center on vertical integration, pairing filling with downstream capping and labeling to reduce line-integration risk for turnkey buyers, while nearshoring in North America and Europe is opening new opportunities for regional assemblers.
Key Report Takeaways
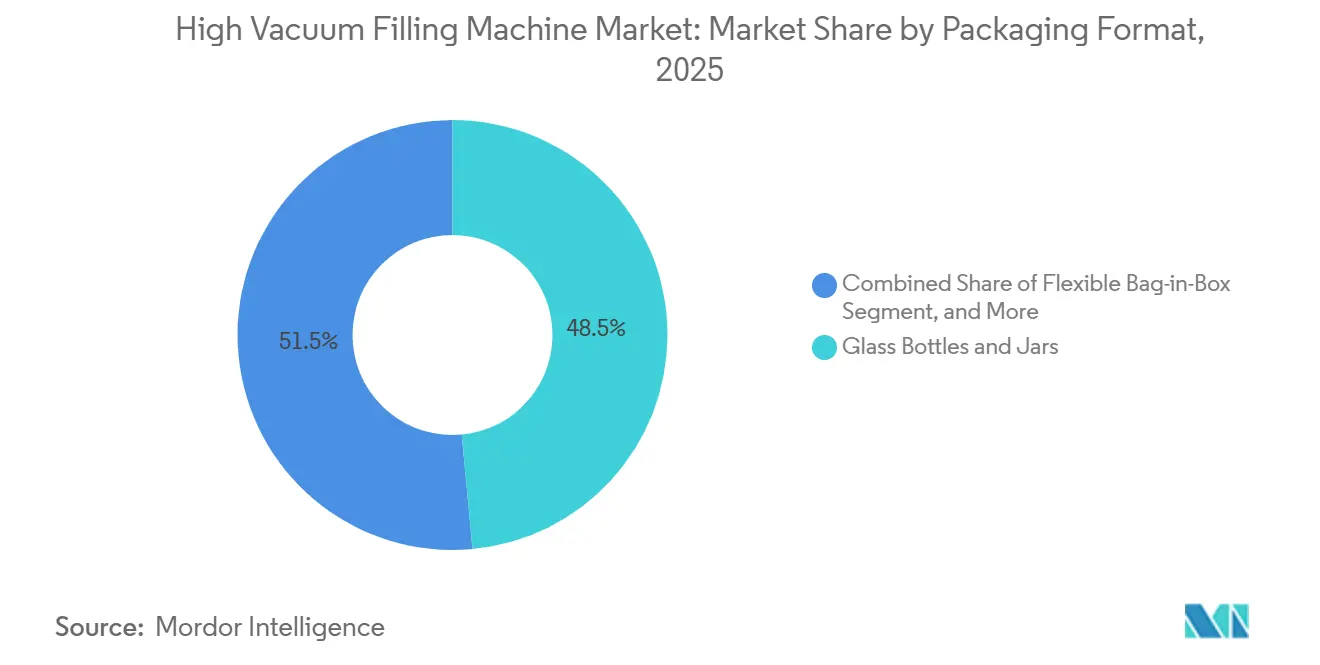
- By packaging format, glass bottles and jars captured 48.52% of the high vacuum filling machine market share in 2025.
- By automation level, the high vacuum filling machine market size for fully automatic stations accounted for 61.03% of the revenue and is projected to grow at a CAGR of 8.03% between 2026 and 2031.
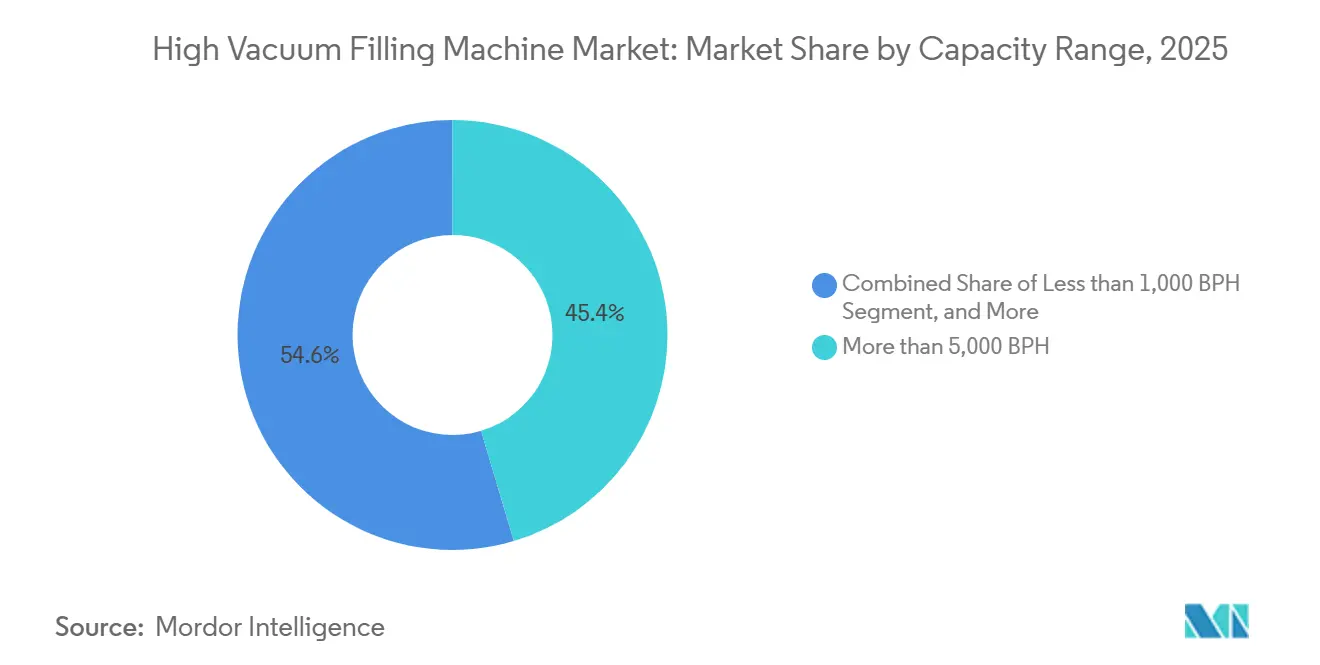
- By capacity, more than 5,000 BPH captured 45.39% of the high vacuum filling machine market share in 2025.
- By end-user industry, the high vacuum filling machine market size for the electronics sector is projected to grow at a 7.47% CAGR between 2026 and 2031.
- By geography, the Asia-Pacific captured 37.81% of the high vacuum filling machine market share in 2025.
Global High Vacuum Filling Machine Market Trends and Insights
Drivers Impact Analysis
| Driver | (~) % Impact on CAGR Forecast | Geographic Relevance | Impact Timeline |
|---|---|---|---|
| Rise in Demand for Longer Ambient-Shelf-Life Packaged Foods | +1.2% | Global strongest in North America, Europe, and Asia-Pacific | Medium term (2-4 years) |
| Transition to Industry 4.0 Smart Filling Lines | +1.5% | North America, Europe, China, Japan, South Korea | Medium term (2-4 years) |
| Rapid Expansion of Lithium-Ion Battery Gigafactories | +1.8% | China, South Korea, Germany, Poland, the United States | Short term (≤ 2 years) |
| Surge in Premium Cosmetics That Require Oxygen-Free Filling | +0.9% | France, Italy, the United States, Japan, South Korea | Medium term (2-4 years) |
| Energy-Efficient High-Vacuum Pump Breakthroughs | +0.7% | Europe and North America | Long term (≥ 4 years) |
| Growth of Cross-Border E-Commerce for Temperature-Sensitive Goods | +0.6% | Global plus Middle East and Africa corridors | Medium term (2-4 years) |
| Source: Mordor Intelligence | |||
Rapid Expansion of Lithium-Ion Battery Gigafactories
Vacuum filling prevents bubble formation, ensures full wetting of separators, and achieves a first-pass yield above 95% in both cylindrical and prismatic cells. Fraunhofer research confirms that the process reduces the formation cycle time by 15-20% and alleviates a persistent bottleneck in cell assembly. Guoxuan, Natron Energy, and Lyten have specified vacuum-compatible stations for novel chemistries, collectively translating to more than 1,200 stations across announced capacities by 2030. Single-shot filling, as demonstrated by South 8 Technologies, slices capital outlays by 30-34% and redirects USD 200-300 million per 10 GWh line toward other factory assets. As a result, the high-vacuum filling machine market is becoming system-critical for battery value chains in the Asia-Pacific, Europe, and North America regions.
Transition to Industry 4.0 Smart Filling Lines
OPC-UA-enabled fillers from OMRON feed real-time data on pump vibration, seal wear, and valve cycle counts into plant SCADA layers, reducing unexpected downtime by up to 30% and extending the mean time between failures to approximately 24 months.[1]OMRON Corporation, “Pharma 4.0 Connected Machine Solutions,” omron.com Predictive maintenance, combined with servo-driven precision, reduces energy consumption by 10-15% and limits fill-weight deviation to ±0.3%. Digital twins built from continuous sensor data optimize changeover routines, shrinking material waste 15-20%. Above 5,000 bottles per hour, labor savings and quality gains yield payback in under 3.5 years, motivating converters, co-packers, and pharmaceutical CDMOs to migrate from semi-automatic alternatives.
Rise in Demand for Longer Ambient-Shelf-Life Packaged Foods
Removing residual oxygen below 2% extends the ambient shelf life of tomato sauces, fruit purées, and meals from 6 to 18 months, while meeting FDA 21 CFR Part 113 and EU Regulation 1935/2004 requirements. Bag-in-box systems using FDpack high-barrier film exhibit oxygen permeability of less than 0.1 cc/m²/day, which can double or triple the shelf life of premium juices. Sacmi’s aseptic rotary filler logs oxygen ingress at 0.5 ppm or less at 850 packs per hour, enabling preservative-free claims that command double-digit pricing premiums. The U.S. Food Safety Modernization Act’s preventive-control rule now favors closed-loop vacuum solutions, boosting retrofit orders across North America and Europe.
Surge in Premium Cosmetics That Require Oxygen-Free Filling
Luxury serums from Sisley, Dior, and Shiseido stipulate sub-0.3 ppm oxygen to protect sensitive actives. Aptar’s under-vacuum line achieves that level, ensuring 95% evacuation of airless pumps. Technibag’s ISO Class 7 semi-automatic station caters to small-batch producers, while refillable packs with thinner walls feature controlled pressure ramps that add up to 20% to the capital cost but double the shelf life to 24 months. Clean-label claims sustain 20-30% price premiums, justifying the investment and driving the expansion of the high-vacuum filling machine market across Europe, Japan, and the United States.
Restraints Impact Analysis
| Restraint | (~) % Impact on CAGR Forecast | Geographic Relevance | Impact Timeline |
|---|---|---|---|
| High CAPEX and Payback Horizon for SMEs | -0.8% | Global most acute in South America, Africa, and Southeast Asia | Short term (≤ 2 years) |
| Skilled Operator and Maintenance Talent Shortage | -0.6% | North America, Europe, China, Japan, South Korea | Medium term (2-4 years) |
| Price Pressure from Low-Vacuum Substitute Technologies | -0.4% | South America, Africa, South Asia | Medium term (2-4 years) |
| Stainless-Steel Supply-Chain Volatility | -0.5% | Global amplified in the United States by tariffs | Short term (≤ 2 years) |
| Source: Mordor Intelligence | |||
High CAPEX and Payback Horizon for SMEs
Fully automatic, Industry 4.0-ready lines cost USD 300,000-500,000 for 3,000-5,000 bottles per hour, resulting in a payback period of 4-5 years for most craft beverage, niche cosmetics, and contract filling firms. Subsidies, such as Singapore’s Productivity Solutions Grant, cover only 8-10% of capital outlays, as stated on enterprises.gov.sg. Entry-level semi-automatic units rose to USD 90,000-115,000 after 2025 tariffs on stainless steel, further delaying upgrades. Leasing programs remain rare, with fewer than 15% of suppliers offering equipment-as-a-service, stalling the penetration of the high vacuum filling machine market among SMEs.
Skilled Operator and Maintenance Talent Shortage
PLC programming, IIoT sensor calibration, and dry-screw pump upkeep require niche skills. Only one in five vocational graduates meets baseline competence, extending commissioning from 8-12 weeks to as long as 16 weeks and adding USD 15,000-25,000 in travel costs for supplier technicians. Long-term, remote diagnostics and augmented-reality support from OMRON promise relief; however, adoption stands at around 30% because many SMEs lack adequate network infrastructure. Service contracts priced at USD 20,000-40,000 per line per year are becoming routine, raising the total cost of ownership.
Segment Analysis
By Packaging Format: Glass Stability and Flexible Innovation
Glass Bottles and Jars controlled 48.52% of the 2025 revenue within the high-vacuum filling machine market, buoyed by wine, spirits, and premium juice brands that prize inertness and shelf appeal. FDpack’s barrier films and Sacmi’s 0.5 ppm oxygen rotary filler are accelerating the adoption of bag-in-box, which is growing at a rate of 7.12% yearly. Glass will retain its foothold in pharmaceutical vials and luxury cosmetics, where Type I borosilicate resists autoclave and formulation challenges. However, flexible pouches, bag-in-box, and liner-based drums are scaling quickly as processors seek lighter freight profiles and lower breakage risk. SRAML’s Venturi-based system, which maintains package shape during transport, reduces damage claims by one-quarter. These gains reinforce the momentum of the high-vacuum filling machine market as converters diversify their container portfolios.
Bag-in-box oxygen permeability under 0.1 cc/m²/day now supports ambient storage of premium juices, olive oils, and concentrates. Alfa Laval’s Astepo Grande reaches 700 bags per hour, matching many glass-bottle lines while slashing material cost nearly in half. Flexible formats also align with sustainability targets by reducing waste. Nevertheless, validation under FDA 21 CFR Part 210 and EU GMP Annex 1 still extends launch cycles by up to six months, keeping glass firmly entrenched in the regulated biopharma sector.
Note: Segment shares of all individual segments available upon report purchase
By Automation Level: Fully Automatic Lines Gain Industry 4.0 Premium
Fully automatic stations captured 61.03% of the 2025 revenue and are growing at an 8.03% CAGR, as Industry 4.0 mandates favor sensor-rich networks. OMRON’s connected architecture logs production data for digital twins, reducing unplanned downtime by approximately one-quarter. Semi-automatic lines, with a 38.97% share, continue to serve small-batch runs and contract fillers; however, their limited data logging and higher labor intensity hinder their penetration in the pharmaceutical industry, where traceability is non-negotiable.
The high-vacuum filling machine market size for automatic lines benefits further from servo-driven dosing, which narrows fill-weight tolerance to 0.5 ml, thereby enhancing yield in cosmetics and biopharma. CVC’s 990SR softgel unit posts a 36.4% productivity lift thanks to automated die-roll swaps, illustrating why investment dollars gravitate toward full automation. Semi-automatic models remain vital for start-ups, but expected payback periods surpass 4-5 years, limiting widespread upgrades.
By Capacity Range: Scale Economics Favor High Throughput
More than 5,000 BPH owned 45.39% of shipments in 2025 as large beverage, dairy, and battery clients amortize capital across tens of millions of units. Alfa Laval’s 700-bag-per-hour Astepo Grande and Sacmi’s 850-piece-per-hour rotary filler typify the tier’s push for efficiency. Mid-tier 1,001-5,000 units account for 32.4% of the high vacuum filling machine market and cater to mid-size cosmetics and regional food brands, striking a balance between throughput and changeovers.
Entry-level systems, which produce below 1,000 bottles per hour, hold a 22.21% share, serving craft distillers and pilot pharmaceutical operations. Yet limited Industry 4.0 functions and higher unit costs leave growth at a modest 4.2% CAGR. Battery gigafactories slot near the mid-cap tier, 600-900 cells per hour, but demand complex material compatibility and inert-gas purges, adding to capital costs and spurring suppliers to design hybrid pressurized-vacuum cycles.
Note: Segment shares of all individual segments available upon report purchase
By End-user Industry: Food Leadership with Electronics Acceleration
Food and beverages generated 46.72% of 2025 revenue by leveraging vacuum technology to reduce residual oxygen to below 2%, thereby meeting an 18-month ambient shelf life. FDA 21 CFR Part 113 and EU 1935/2004 regulations govern cement supplier relationships with processors, emphasizing compliance. Electronics, dominated by battery cell assembly, is surging at a 7.47% CAGR. Fraunhofer studies indicate that vacuum stages can increase the first-pass yield to above 95% in both lithium-ion and sodium-ion formats, positioning electronics as a pivotal growth engine for the high-vacuum filling machine market.
Pharmaceuticals, with an 18.3% share, require ISO Class 7 cleanrooms and 21 CFR Part 210 compliance, which sustains premium pricing. Cosmetics and personal care products account for 12.8% of the market, expanding through oxygen-free filling, which doubles shelf life and supports clean-beauty claims. Chemicals, paints, and lubricants comprise the remainder, where void-free packaging enhances mechanical integrity and material consistency.
Geography Analysis
Asia-Pacific generated 37.81% of 2025 revenue and is on track for a 7.59% CAGR. China supplies 35% of global vacuum-component output and hosts Guoxuan’s CNY 4 billion (USD 600 million) 20 GWh base integrating pressurized and vacuum filling. India’s food corridor gained momentum with MULTIVAC’s EUR 9 million (USD 10.6 million) Ghiloth facility, and Southeast Asia is adding vacuum capacity to qualify for export markets.
Europe held a significant market share in 2025, driven by pharmaceutical and cosmetics hubs that adhere to FDA and EU GMP Annex 1 protocols. FUCHS and E-Lyte’s electrolyte plant highlights localized supply chain ambitions, while Europe’s 965 GWh battery target could require 1,200-1,500 vacuum stations. Consolidation is underway.[2]FUCHS Petrolub SE, “Electrolyte Plant Commissioning,” fuchs.com Krones bought GHS Separationstechnik and Can Systems Worldwide to integrate vacuum filling with downstream processes.
In 2025, North America held a notable share of the market. Natron Energy and Lyten are constructing USD billion-scale sodium-ion and lithium-sulfur plants that utilize vacuum-compatible filling. However, a 25% tariff on imported steel lifted equipment prices by 8-12%, complicating upgrades for SMEs. Mexico’s nearshoring wave, evident in the EXPO PACK 2026 exhibitor rolls, may help counter some cost pressures.
Competitive Landscape
The high-vacuum filling machine market remains moderately fragmented. European builders such as Heinrich Frey, NIKO Nahrungsmittel, and FIMER excel in pharma-grade stainless fabrication yet face pricing pressure from Shanghai Grepack and Wenzhou Jvan, which offer modular servo-driven designs at 30-40% lower cost.
Krones’ 2025 spree, which includes the acquisition of GHS Separationstechnik and Can Systems Worldwide, demonstrates a push to integrate filling, capping, and labeling into turnkey bundles, thereby reducing commissioning time by roughly one-quarter. CVC’s acquisition of Changsung Softgel System extends its reach into India and North America with the 990SR model, which lifts productivity 36.4% through automated changeovers.
Technology differentiation now revolves around energy-frugal dry-screw pumps such as Pfeiffer’s A 100 L ES, which saves 7,900 kWh per year, and Atlas Copco’s GHS VSD+, which trims annual bills by USD 20,000-25,000.[3]Atlas Copco AB, “GHS VSD+ Case Study,” atlascopco.com Mexican assemblers are gaining traction by importing components tariff-free under USMCA and offering duty-free delivery into U.S. facilities.
High Vacuum Filling Machine Industry Leaders
-
Accutek Packaging Equipment Company, Inc.
-
Tenco S.r.l.
-
Universal Filling Machine Company Ltd.
-
Shanghai Grepack Packing Machinery Co., Ltd.
-
FIMER S.p.A.
- *Disclaimer: Major Players sorted in no particular order
Recent Industry Developments
- August 2025: Sacmi unveiled an aseptic rotary filler handling 850 packs per hour with oxygen ingress under 0.5 ppm.
- July 2025: Krones acquired 60% of GHS Separationstechnik for USD 11.8 million to expand its vacuum deaeration portfolio.
- June 2025: Natron Energy broke ground on a USD 1.4 billion sodium-ion gigafactory in North Carolina, featuring vacuum-ready lines.
- May 2025: Lyten secured USD 1 billion financing for a Nevada lithium-sulfur facility specifying single-shot vacuum filling.
Global High Vacuum Filling Machine Market Report Scope
The high vacuum filling machine is designed specifically for products that are particularly dense and are filled in glass containers or, in any case, resistant materials. It consists of the automatic and semi-automatic machines, and products normally handled using high-vacuum machines are oil, syrups, creams, sauces, and all those products that come under the segment, such as food and beverage, pharma, etc., which, due to their particular density, cannot be handled by gravity filling machines.
The High Vacuum Filling Machine Market Report is Segmented by Packaging Format (Glass Bottles and Jars, Rigid Plastic Containers, and Flexible Bag-in-Box), Automation Level (Fully Automatic, and Semi-Automatic), Capacity Range (Less than 1,000 BPH, 1,001–5,000 BPH, and More than 5,000 BPH), End-user Industry (Food and Beverages, Pharmaceuticals, Cosmetics and Personal Care, Chemical, Electronics, and Other End-user Industries), and Geography (North America, South America, Europe, Asia-Pacific, Middle East and Africa). The Market Forecasts are Provided in Terms of Value (USD).
| Glass Bottles and Jars |
| Rigid Plastic Containers |
| Flexible Bag-in-Box |
| Fully Automatic |
| Semi-Automatic |
| Less than 1,000 BPH |
| 1,001–5,000 BPH |
| More than 5,000 BPH |
| Food and Beverages |
| Pharmaceuticals |
| Cosmetics and Personal Care |
| Chemical |
| Electronics |
| Other End-user Industries |
| North America | United States | |
| Canada | ||
| Mexico | ||
| South America | Brazil | |
| Argentina | ||
| Chile | ||
| Rest of South America | ||
| Europe | United Kingdom | |
| Germany | ||
| France | ||
| Italy | ||
| Spain | ||
| Rest of Europe | ||
| Asia-Pacific | China | |
| India | ||
| Japan | ||
| South Korea | ||
| Australia | ||
| Rest of Asia-Pacific | ||
| Middle East and Africa | Middle East | Saudi Arabia |
| United Arab Emirates | ||
| Turkey | ||
| Rest of Middle East | ||
| Africa | South Africa | |
| Nigeria | ||
| Rest of Africa | ||
| By Packaging Format | Glass Bottles and Jars | ||
| Rigid Plastic Containers | |||
| Flexible Bag-in-Box | |||
| By Automation Level | Fully Automatic | ||
| Semi-Automatic | |||
| By Capacity Range | Less than 1,000 BPH | ||
| 1,001–5,000 BPH | |||
| More than 5,000 BPH | |||
| By End-user Industry | Food and Beverages | ||
| Pharmaceuticals | |||
| Cosmetics and Personal Care | |||
| Chemical | |||
| Electronics | |||
| Other End-user Industries | |||
| By Geography | North America | United States | |
| Canada | |||
| Mexico | |||
| South America | Brazil | ||
| Argentina | |||
| Chile | |||
| Rest of South America | |||
| Europe | United Kingdom | ||
| Germany | |||
| France | |||
| Italy | |||
| Spain | |||
| Rest of Europe | |||
| Asia-Pacific | China | ||
| India | |||
| Japan | |||
| South Korea | |||
| Australia | |||
| Rest of Asia-Pacific | |||
| Middle East and Africa | Middle East | Saudi Arabia | |
| United Arab Emirates | |||
| Turkey | |||
| Rest of Middle East | |||
| Africa | South Africa | ||
| Nigeria | |||
| Rest of Africa | |||
Key Questions Answered in the Report
What is the current size of the high vacuum filling machine market?
The market reached USD 1.59 billion in 2026 and is forecast to grow to USD 2.09 billion by 2031.
Which end-user segment is growing fastest?
Electronics, fueled by battery gigafactories, are advancing at a 7.47% CAGR.
Why are fully automatic vacuum fillers gaining share?
Industry 4.0 data capture, predictive maintenance, and lower total cost of ownership drive an 8.03% CAGR for fully automatic lines.
Which region contributes the largest revenue?
Asia-Pacific led with 37.81% of global revenue in 2025 and is poised for a 7.59% CAGR.
What are the main restraints on adoption by small firms?
High capital outlays of USD 300,000-500,000 for fully automatic lines, combined with shortages of skilled technicians, extend the payback period to 4-5 years.
How does vacuum filling benefit lithium-ion battery production?
It removes trapped gases, improves separator wetting, and reduces formation time by 15-20%, thereby raising the first-pass yield above 95%.
Page last updated on:


