
High Energy Lasers Market Size and Share
Market Overview
| Study Period | 2020 - 2031 |
|---|---|
| Market Size (2026) | USD 11.73 Billion |
| Market Size (2031) | USD 16.25 Billion |
| Growth Rate (2026 - 2031) | 6.73 % |
| Fastest Growing Market | Asia Pacific |
| Largest Market | North America |
| Market Concentration | Medium |
Major Players *Disclaimer: Major Players sorted in no particular order Image © Mordor Intelligence. Reuse requires attribution under CC BY 4.0. | |
High Energy Lasers Market Analysis by Mordor Intelligence
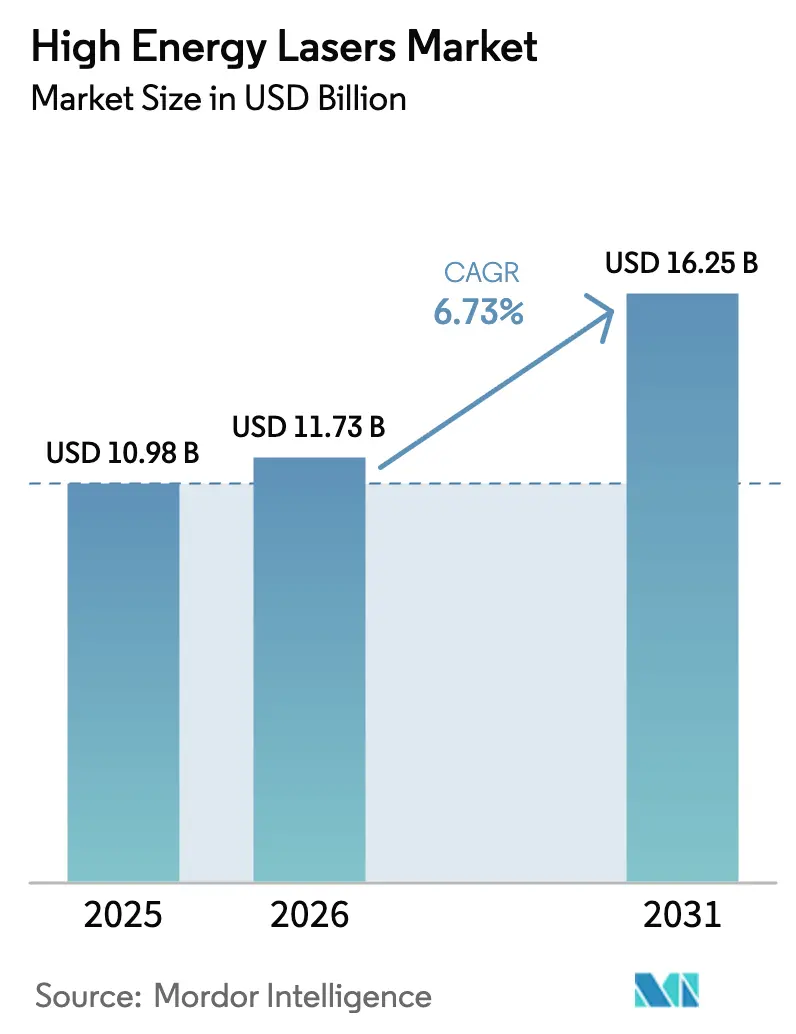
The High Energy Lasers Market size is expected to increase from USD 10.98 billion in 2025 to USD 11.73 billion in 2026 and reach USD 16.25 billion by 2031, growing at a CAGR of 6.73% over 2026-2031. Demand momentum is shifting from experimental trials toward routine field deployment as government customers emphasize cost-per-shot savings, power-scaling breakthroughs, and interoperability with AI-enabled command-and-control networks. Fiber architectures command attention because spectral beam combining raises output beyond 100 kW without proportional thermal penalties, while solid-state and gas designs cede share. Communications payloads on satellites, aircraft, and high-altitude platforms are accelerating adoption outside factory floors, opening fresh revenue for suppliers that historically served welding and cutting lines. Corporate strategies increasingly revolve around cross-border teaming, typified by Lockheed Martin and Rafael, because no single vendor controls all subsystems spanning diodes, beam control, power electronics, and fire-control software.
Key Report Takeaways
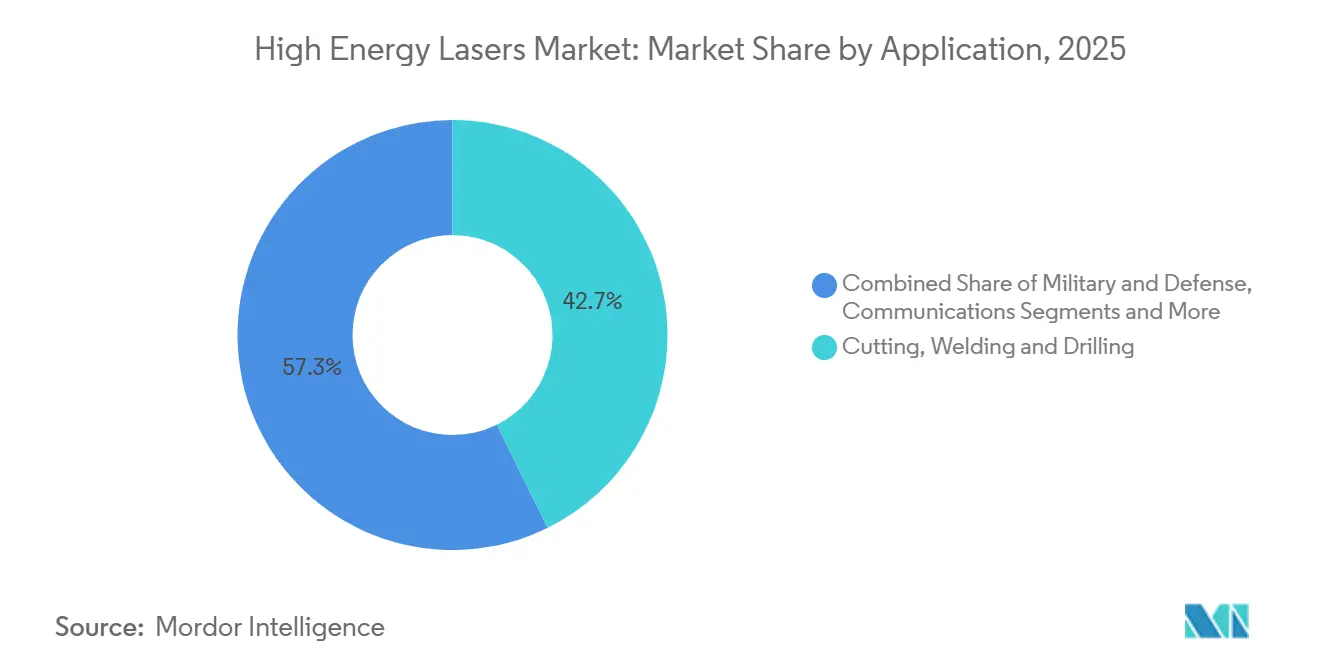
- By application, cutting, welding, and drilling led with 42.70% of High Energy Lasers Market share in 2025, while communications is the fastest growing segment at an 8.12% CAGR through 2031.
- By laser type, fiber lasers captured 55.71% share of the High Energy Lasers Market size in 2025 and are projected to expand at a 7.23% CAGR to 2031.
- By power output, systems above 100 kW are advancing at an 8.69% CAGR between 2026-2031, the quickest pace among all ranges.
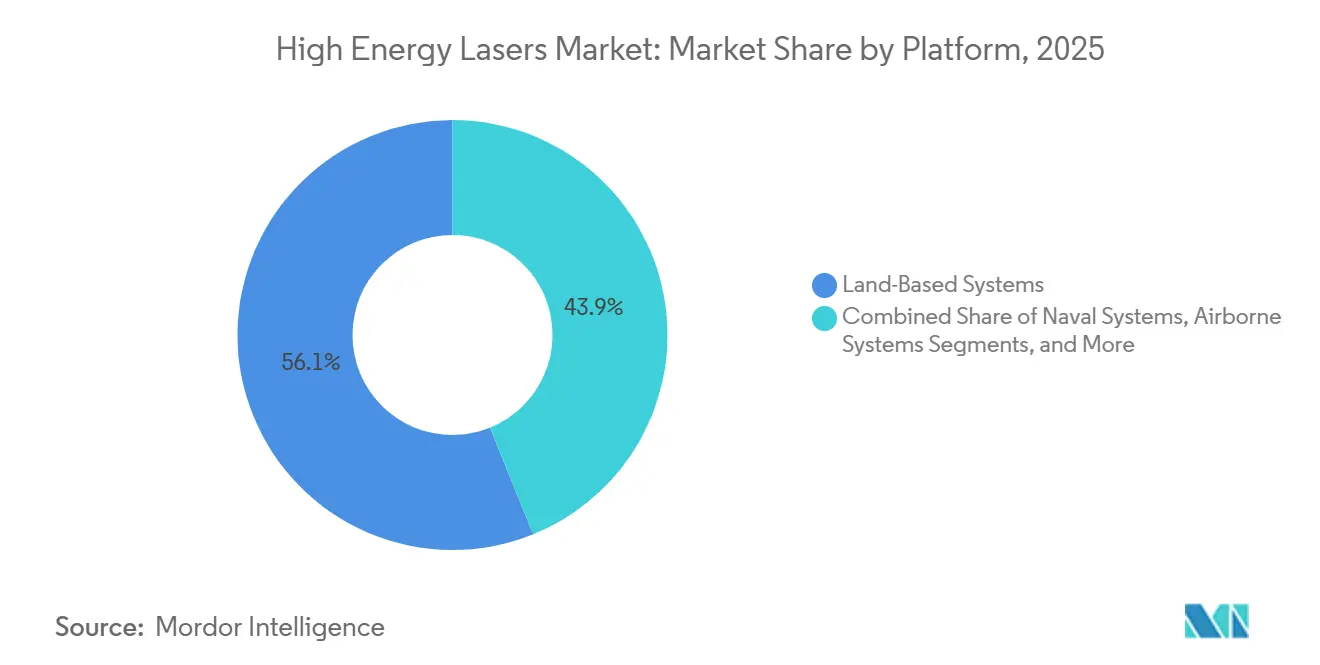
- By platform, land-based systems held 56.12% share in 2025, yet space-based platforms are rising at a 7.14% CAGR as satellite operators move to optical links.
- By end user, industrial manufacturing dominated with 52.74% share in 2025, whereas aerospace and defense is growing at a 6.89% CAGR on the back of counter-drone programs.
Note: Market size and forecast figures in this report are generated using Mordor Intelligence’s proprietary estimation framework, updated with the latest available data and insights as of January 2026.
Market Trends and Insights
Drivers Impact Analysis of High Energy Lasers Market*
| Driver | (~) % Impact on CAGR Forecast | Geographic Relevance | Impact Timeline |
|---|---|---|---|
| Escalating Directed-Energy Defense Budgets Among Major Powers | +1.8% | North America, Europe, Israel, India, South Korea | Medium term (2-4 years) |
| Demand for Cost-Per-Shot Reduction Versus Conventional Munitions | +1.5% | Middle-East littorals, Asia-Pacific naval corridors | Short term (≤ 2 years) |
| Rapid Advancements in Beam-Combining and Thermal Management Techniques | +1.2% | North America, Europe, advanced Asian manufacturing hubs | Long term (≥ 4 years) |
| Integration of AI-Enabled Targeting for Precision and Low-Collateral Damage | +0.9% | Early adoption in North America and Israel | Medium term (2-4 years) |
| Fiber Laser Efficiency and Scalability Driving Industrial Adoption | +0.7% | Global automotive, electronics, and machinery clusters | Short term (≤ 2 years) |
| Above-100 kW Power Scaling Unlocking New Military Missions | +0.6% | United States, Israel, China, India | Long term (≥ 4 years) |
| Source: Mordor Intelligence | |||
Escalating Directed-Energy Defense Budgets Among Major Powers
Defense ministries are reallocating procurement funds toward lasers because inexpensive drones and rockets saturate missile magazines. The United States appropriated USD 1.2 billion for Israel’s Iron Beam in April 2024, a figure that eclipses many interceptor line items.[1]India is financing 30 kW and 300 kW prototypes for naval and border security, while South Korea placed a USD 132 million order for serial production of its 20 kW Block I system. These budgets position the High Energy Lasers Market for steady multi-year program funding rather than sporadic demonstrations.
Demand for Cost-Per-Shot Reduction Compared to Conventional Munitions
Lasers are revolutionizing military economics, significantly reducing costs from tens of thousands of dollars per missile to mere single-digit electricity expenses per shot. For example, each round of the Iron Dome system costs approximately USD 50,000, whereas interceptions carried out by the Iron Beam system are estimated to cost just about USD 2.[2] Similarly, the UK's DragonFire laser weapon system demonstrates comparable single-digit cost efficiency. This dramatic reduction in operational expenses has garnered significant interest from Middle-Eastern nations, particularly due to their ongoing challenges with persistent drone swarms targeting critical infrastructure. The ability to deploy cost-effective and efficient laser systems offers a strategic advantage in addressing these threats. Additionally, the benefits of short supply chains and enhanced magazine depth make lasers an especially compelling option for naval ships. These vessels often operate in high-tempo engagement scenarios where the risk of ammunition depletion could compromise mission success, making the adoption of laser technology a critical consideration.
Rapid Advancements in Beam-Combining and Thermal Management Techniques
By stacking dozens of fiber outputs into a single coherent column, spectral beam combining enables suppliers to significantly exceed the 100 kW threshold without the risk of overheating. This advanced method has proven to be a game-changer in high-power laser systems. In 2024, Lockheed Martin successfully delivered a 300 kW-class prototype to the Pentagon, showcasing the potential of this innovative technique. Designers now benefit from enhanced integration flexibility, thanks to the incorporation of liquid cooling loops, compact heat exchangers, and additive-manufactured cold plates. These technological advancements not only improve thermal management but also reduce system footprints, making it feasible to mount these systems on tactical trucks and frigates, thereby expanding their operational versatility.
Integration of AI-Enabled Targeting for Precision and Low-Collateral Damage
In mere milliseconds, machine-learning algorithms classify, prioritize, and cue beams with remarkable efficiency. Lockheed Martin's Maneuver Short-Range Air Defense demonstrator effectively harnesses advanced computer vision technology to optimize dwell time across a fleet of drones, ensuring enhanced operational performance. Furthermore, AI's unparalleled precision in energy placement significantly mitigates fragmentation risks, which is especially crucial in densely populated urban areas. This capability aligns with the increasingly stringent rules-of-engagement standards, addressing critical safety and operational requirements.
Restraints Impact Analysis of High Energy Lasers Market*
| Restraint | (~) % Impact on CAGR Forecast | Geographic Relevance | Impact Timeline |
|---|---|---|---|
| Thermal Blooming Limitations in High-Humidity or Dusty Environments | -1.1% | Tropical littorals, Middle-East deserts, South & Southeast Asia | Short term (≤ 2 years) |
| Stringent Export Control Regimes on Directed-Energy Technologies | -0.8% | Global, especially cross-border defense programs | Medium term (2-4 years) |
| Power Supply and Cooling Constraints on Mobile Platforms | -0.6% | Global naval and airborne integrators | Medium term (2-4 years) |
| Line-of-Sight and Weather Dependency Limiting Engagement Windows | -0.5% | Mountainous and high-latitude theaters | Short term (≤ 2 years) |
| Source: Mordor Intelligence | |||
Thermal Blooming Limitations in High-Humidity or Dusty Environments
Under high humidity conditions, atmospheric turbulence can significantly reduce beam intensity by as much as 40% at altitudes ranging between 5-8 km. This substantial reduction in beam intensity creates operational challenges, compelling operators to maintain backup interceptors to ensure system reliability and effectiveness. Although adaptive optics can help address this issue by compensating for the effects of turbulence, their implementation introduces additional weight and cost to the system. These added factors ultimately compromise the mobility and efficiency of the overall setup, posing further constraints for operators.
Stringent Export Control Regimes on Directed-Energy Technologies
Foreign sales face significant throttling due to the stringent regulations imposed by Category XII of the U.S. Munitions List and the Wassenaar Arrangement. These regulatory frameworks are designed to control the export of sensitive technologies, including high-energy laser systems, to ensure national security and prevent misuse. However, these restrictions result in extended lead times ranging from 12 to 24 months, thereby creating substantial delays in the supply chain and delivery timelines. Additionally, these measures contribute to the fragmentation of the addressable base within the High Energy Lasers Market, further complicating market dynamics, limiting the potential customer base, and hindering growth opportunities for manufacturers and suppliers operating in this space.
*Our forecasts treat driver/restraint impacts as directional, not additive. The impact forecasts reflect baseline growth, mix effects, and variable interactions.
High Energy Lasers Market Segment Analysis
By Application:
Communications Systems Gain VelocityIn 2025, cutting, welding and drilling held a dominant 42.70% share of the High Energy Lasers Market, driven by automakers and aerospace fabricators turning to fiber beams for precise alloy trimming. This segment's prominence highlights the critical role of high-energy lasers in achieving precision and efficiency in industrial applications. Meanwhile, communications platforms are on the rise, boasting an 8.12% CAGR. This growth underscores satellite operators' pursuit of terabit cross-links, allowing them to bypass congested radio frequencies and improve data transmission capabilities. Such a shift not only highlights the evolving landscape but also broadens revenue streams for suppliers, moving away from the traditional cyclical manufacturing reliance. The diversification of revenue pools is expected to provide stability and growth opportunities for market players in the long term.
The growing adoption of communications is bolstering the demand for components like narrow-linewidth emitters and indium phosphide modulators. These components are essential for enabling high-performance optical systems, which are increasingly critical in modern communication networks. Notably, Coherent ramped up its output of these critical components threefold in 2025 to meet the surging demand. Furthermore, military bandwidth requirements underscore this trend; optical terminals are now pivotal, transmitting reconnaissance data from low-Earth-orbit constellations to ground analysts in mere seconds. This capability significantly enhances the efficiency of military operations by compressing kill chains and enabling faster decision-making processes. The crossover between commercial and military applications further emphasizes the strategic importance of high-energy laser technologies in addressing diverse market needs.

By Laser Type:
Fiber Architectures Extend LeadFiber lasers secured 55.71% High Energy Lasers Market share in 2025 and will expand at 7.23% CAGR through 2031 as electrical-to-optical conversion efficiencies above 40% outclass legacy gas and chemical units.[3]Spectral combining lets integrators stack modules without physics rewrites, trimming non-recurring engineering costs.
Free-electron and chemical alternatives linger in laboratory niches because of size and toxicity hurdles. Their limited field readiness keeps procurement officers centered on fiber pathways, reinforcing economies of scale that lower price per watt for industrial customers.
By Power Output:
>100 kW Systems Unlock New MissionsAs armies increasingly target 7 km intercept envelopes to effectively neutralize threats such as rockets, artillery, and cruise missiles, systems exceeding 100 kW are experiencing the fastest growth, with a remarkable CAGR of 8.69%. By 2031, the High Energy Lasers Market for this segment is projected to double in size, creating significant opportunities for integrators who excel in addressing challenges like thermal lensing mitigation. This growth highlights the strategic importance of high-power laser systems in modern defense applications.
Meanwhile, lower power bands, particularly in the 1-5 kW range, continue to dominate in terms of volume, primarily serving the needs of sheet-metal shops. However, Western sellers in this segment are increasingly facing margin pressures due to the rising competition from low-cost Asian imports. On the other hand, premium units exceeding 100 kW not only avoid the risks of commoditization but also offer additional value through service contracts, which include maintenance for chillers and optics refurbishment. These high-power systems represent a more sustainable and profitable segment for manufacturers and service providers in the market.
By Platform:
Space-Based Installations AccelerateIn 2025, land-based systems captured 56.12% of the revenue, primarily due to their straightforward grid access, which simplifies the power supply process. These platforms benefit from established infrastructure, making them a dominant segment in the market. Meanwhile, space-based terminals, despite holding a smaller market share, are projected to grow at a notable 7.14% CAGR. This growth is largely driven by the increasing adoption of optical inter-satellite links by broadband constellations, which facilitate the global transmission of AI training data. The rising demand for high-speed data transfer and advancements in satellite technology further contribute to the expansion of this segment.
Naval combatants are emerging as the next frontier for laser technology applications. With features such as corrosion-resistant housings and 360-degree turrets, lasers are becoming an ideal solution for defending against drone swarms, which pose a significant threat in modern naval warfare. The ability of lasers to provide precise targeting and rapid response enhances their appeal in this domain. However, airborne adoption of laser systems continues to lag behind due to the challenges posed by 100 kW loads, which strain the capacity of existing generators. Despite these challenges, ongoing advancements in gallium-nitride power electronics are expected to address these limitations. By the end of the forecast period, these technological improvements could significantly close the gap, enabling broader adoption of laser systems in airborne platforms.
By End User:
Defense Momentum Outpaces Industrial CyclesIn 2025, industrial manufacturing commanded a dominant 52.74% share of the High Energy Lasers Market. However, the aerospace and defense sector is poised for a more robust growth, boasting a projected CAGR of 6.89% through 2031. This surge is largely driven by fleet modernizations that are increasingly integrating lasers into counter-UAV systems. Meanwhile, research institutes are churning out groundbreaking intellectual property, which is swiftly transitioning to vendors. On another front, telecom carriers are experimenting with free-space optics for 5G backhaul, especially in areas where fiber build-outs are lagging.
The increasing adoption of high-energy lasers across various industries highlights their versatility and potential for innovation. In industrial manufacturing, these lasers are being utilized for precision cutting, welding, and material processing, driving efficiency and productivity. Similarly, the aerospace and defense sector is leveraging these technologies to enhance security and operational capabilities. As research institutes continue to develop advanced laser technologies, their commercialization is expected to further expand the market. Additionally, the exploration of free-space optics by telecom carriers underscores the growing demand for alternative solutions to address connectivity challenges in underserved regions.
Geography Analysis
North America High Energy Lasers Market
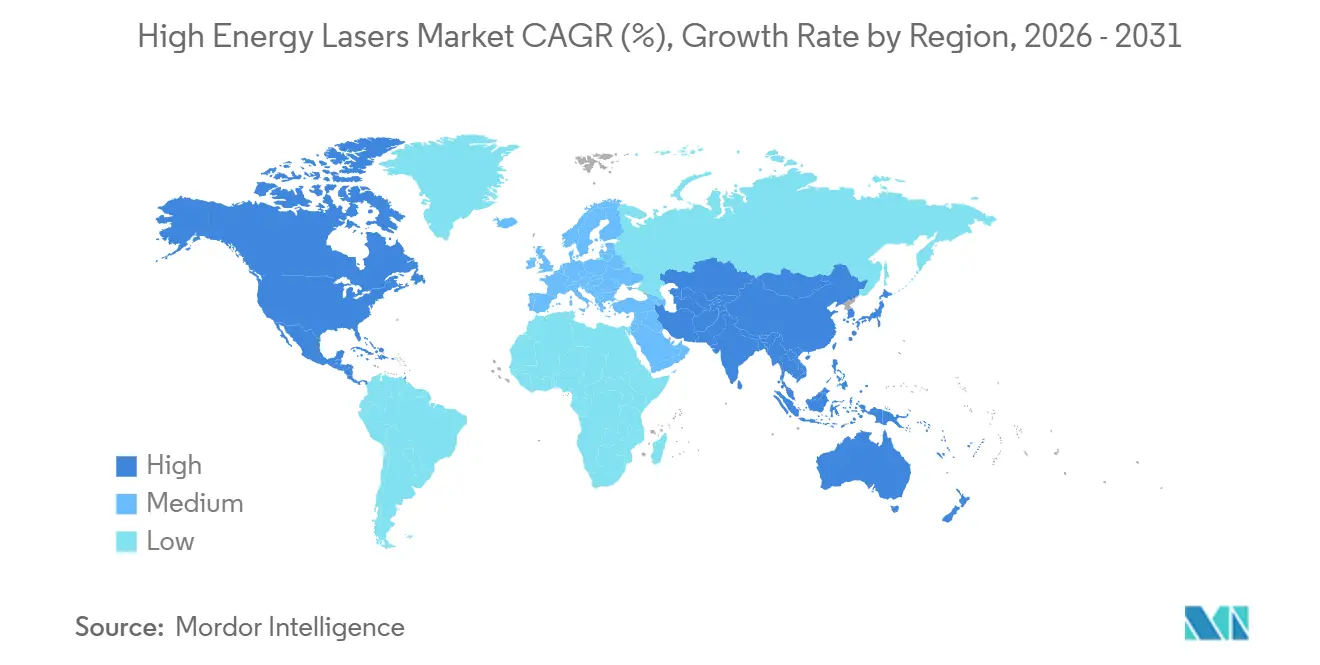
In 2025, North America secured 40.01% of the High Energy Lasers Market revenue, bolstered by Pentagon initiatives like the Navy's HELIOS and the Army's Indirect Fire Protection Capability. The region's industrial adoption of high-energy lasers is particularly evident in the Midwest, where automotive body-in-white welding has become a focal point, and in the Southeast, where turbine machining activities are thriving. Meanwhile, Canadian strategists are exploring the establishment of Arctic laser sites to address the logistical challenges associated with resupplying interceptors across vast and remote distances.
APAC High Energy Lasers Market
Asia-Pacific, led by China's cost-effective fiber production and India's self-funded 30 kW and 300 kW weapons (backed by a USD 200 million investment), boasts the world's fastest growth at a 7.47% CAGR. The region's rapid expansion is further highlighted by South Korea's deployment of a 20 kW laser in 2024, which underscores the increasing technological capabilities within the area. Additionally, Japanese electronics firms are increasingly turning to lasers for automation purposes, a strategic move aimed at countering labor shortages while ensuring a steady and reliable base-load demand for high-energy laser systems.
EMEA and South America High Energy Lasers Market
Europe presents a mixed bag of trends. Germany's machine-tool exporters play a significant role in underpinning industrial sales, while the United Kingdom's DragonFire successfully completed sea trials in 2025, marking a notable achievement in the region's defense capabilities. However, Southern Europe's budget constraints and stringent export regulations have tempered the overall momentum of the high-energy lasers market in the region. In the Middle East, Israel's operationalization of the Iron Beam in 2025, along with Gulf states' increasing interest in acquiring similar advanced defense systems, signals a rapid acceleration in the adoption of high-energy laser technologies. Africa and South America remain in the nascent stages of market development; however, Brazil's burgeoning aerospace sector shows promise as a potential future hub for laser-driven additive manufacturing, which could significantly contribute to the region's industrial growth in the coming years.
Regulatory Landscape
High-energy laser systems sit under tightly controlled defense acquisition and export-control regimes. In the United States, International Traffic in Arms Regulations (ITAR) controls are reinforced by Category XII of the U.S. Munitions List, alongside multilateral controls under the Wassenaar Arrangement dual-use list (Category 6, 6A005, updated in the 2025 corrected list). In Europe, controls align with the EU Dual-Use framework (Annex I references for high-power laser thresholds), shaping cross-border teaming, lead times, and the addressable market for laser sources, beam control, and related subsystems.
Safety and operational integration rules are also being updated to reflect field deployment beyond test ranges. In the United Kingdom, the Ministry of Defence Defence Ordnance Safety Regulator (DOSR) implemented revisions to DSA 02.OME Part 5 effective 13 April 2026, with related consultation activity tied to JSP 390 for laser directed energy weapon safety governance. In the United States, the Federal Aviation Administration cleared Department of Defense operation of a high-energy laser counter-drone system along the U.S.-Mexico border in New Mexico following a Safety Risk Assessment. This indicates more formal pathways for operating directed-energy systems near civil airspace, alongside ongoing DoD acquisition governance.
Competitive Landscape
Top Companies in High Energy Lasers Market
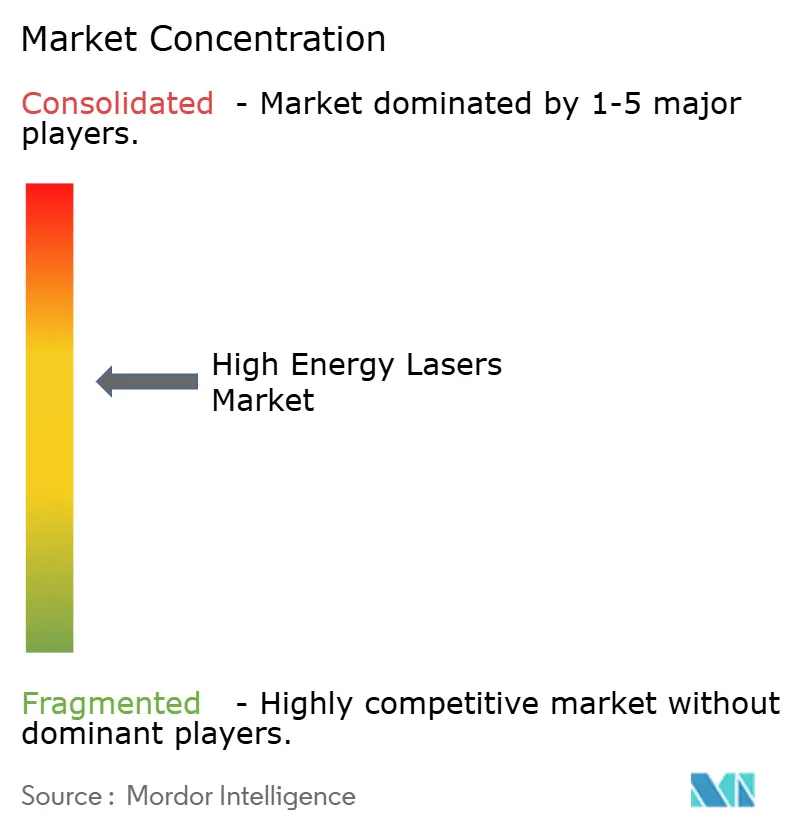
Moderate concentration characterizes the High Energy Lasers Market. The top five suppliers, Lockheed Martin, Raytheon, Northrop Grumman, TRUMPF, and IPG Photonics, command a combined share of about 65%. This significant concentration leads to a market score of 6, indicating a moderately consolidated market structure. Partnerships are increasingly prevalent, with primary players strategically sourcing beam modules from photonics specialists to enhance their technological capabilities. A notable example is Lockheed Martin’s collaboration with Rafael, aimed at co-producing 300 kW lasers for U.S. forces. This partnership underscores the growing synergy between U.S. system integrators and Israeli beam experts, reflecting a trend of cross-border cooperation to leverage specialized expertise.
Facing a slowdown in cutter sales, industrial vendors are pivoting towards defense applications to sustain growth and profitability. TRUMPF’s 2024 move to restrict military engagements to defensive applications, alongside a joint effort with Rohde & Schwarz to develop drone-defense systems, underscores this strategic shift. This realignment highlights the increasing focus on addressing emerging defense needs, such as counter-drone technologies, which are becoming critical in modern warfare. Meanwhile, IPG Photonics is transitioning to high-power diode platforms, which not only reduce size and cost but also enhance appeal for a broader range of applications. These include medical lithotripsy, where precision and efficiency are paramount, and naval interceptors, which demand robust and compact solutions for operational effectiveness.
Chinese players, Raycus and Han’s Laser, are capturing market share in the 1-10 kW segments by offering prices up to 30% lower than their Western counterparts. This aggressive pricing strategy enables them to compete effectively in cost-sensitive markets, particularly in regions where affordability is a key purchasing criterion. Export controls, particularly under ITAR and Wassenaar, limit U.S. and EU vendors from accessing markets in Asia and the Middle East. These restrictions create significant barriers for Western companies, occasionally nudging customers towards Chinese alternatives, which manage to bypass these constraints. As a result, Chinese manufacturers are steadily gaining traction in these regions, leveraging their ability to offer competitive pricing and navigate regulatory challenges more effectively.
High Energy Lasers Industry Leaders
-
IPG Photonics
-
TRUMPF Pvt. Ltd.
-
Coherent, Inc
-
nLight Inc.
-
BAE Systems plc
- *Disclaimer: Major Players sorted in no particular order
High Energy Lasers Market Companies Covered in this Report
- TRUMPF Pvt. Ltd.
- IPG Photonics Corporation
- Coherent Corp.
- nLIGHT, Inc.
- BAE Systems plc
- ALLTEC GmbH
- Lockheed Martin Corporation
- Applied Companies, Inc.
- The Boeing Company
- Lumentum Holdings Inc.
- Bystronic Laser AG
- Wuhan Raycus Fiber Laser Technologies Co., Ltd.
- Raytheon Technologies Corporation
- Northrop Grumman Corporation
- Han's Laser Technology Industry Group Co., Ltd.
- General Atomics
- Rheinmetall AG
- Thales Group
- MBDA
- Leonardo S.p.A.
Market Opportunities and Future Outlook
Government programs are translating into defined procurement pathways and larger multi-site evaluations, creating whitespace for suppliers that can package laser sources, beam directors, power and thermal subsystems, and fire-control software into modular, supportable configurations. The U.S. Army has pushed modular open-system approaches through its Enduring-High Energy Laser (E-HEL) activity, including production-oriented market engagement for fielding 24 systems. Separately, the Fiscal Year 2026 National Defense Authorization Act pilot program selected five U.S. installations (Fort Huachuca, Fort Bliss, Naval Base Kitsap, Grand Forks AFB, and Whiteman AFB) to test high-energy lasers and high-powered microwave systems against drones. These programs favor vendors that can meet standardized performance validation and safety requirements while delivering maintainability and upgrade paths across multiple sites.
European naval adoption also opens a parallel opportunity around maritime hardening and ship integration. In July 2026, Germany's BAAINBw contracted the ARGE HEL team (MBDA Deutschland and Rheinmetall Waffe Munition) to develop a laser weapon system for the German Navy, supporting demand for corrosion-resistant beam directors, stabilized mounts, and shipboard power-conditioning solutions. On the industrial and communications component side, supply-chain scaling for photonics substrates and narrow-linewidth devices remains a practical lever: Coherent signed a June 2026 letter of intent for up to USD 50 million under the CHIPS and Science Act tied to expanding 6-inch indium phosphide manufacturing in Sherman, Texas, supporting higher-volume optical components that serve both defense needs and optical communications payloads.
Recent Industry Developments in High Energy Lasers Market
- July 2026: The Pentagon selected Lockheed Martin and nLIGHT to lead the Joint Laser Weapon System (JLWS) effort, with initial contract values starting at USD 86 million. The award consolidates U.S. Army priority around a joint-service laser path after restructuring earlier efforts, and it pulls more of the supply chain toward standardized subsystems and interfaces suitable for repeatable production.
- December 2025: Rafael delivered Israel's first operational 100 kW Iron Beam laser shield to the Israel Defense Forces. Moving from development to an operational delivery strengthens confidence in fieldable architectures and helps accelerate follow-on procurement demand for beam control, power electronics, and thermal-management supply chains.
- October 2024: IPG Photonics agreed to acquire cleanLASER for USD 75 million to expand into laser cleaning applications. The deal broadens IPG's addressable industrial base beyond cutting and welding, supporting higher utilization of high-power laser platforms across maintenance and surface-preparation workflows.
High Energy Lasers Market Report Scope and Research Methodology
Market Definition and Coverage
This market covers revenue generated from high energy laser systems and related subsystems used to deliver high power beams for industrial processing and directed-energy style uses across key end users, with values tracked in USD at the global level.
Scope exclusions: Excluded from sizing are low-power lab and consumer laser devices, basic laser pointers, and non-laser energy systems that do not generate a coherent laser beam.
Segments Covered in This Report
- By Application
- Cutting, Welding and Drilling
- Military and Defense
- Communications
- Other Applications
- By Laser Type
- Gas Lasers
- Chemical Lasers
- Excimer Lasers
- Solid State Lasers
- Fiber Lasers
- Free-Electron Lasers
- Other Laser Types
- By Power Output
- Up to 10 kW
- 11–50 kW
- 51–100 kW
- Above 100 kW
- By Platform
- Land-Based Systems
- Naval Systems
- Airborne Systems
- Space-Based Systems
- By End User
- Defense
- Industrial Manufacturing
- Aerospace and Aviation
- Research Institutions
- Telecommunications
- Other End-Users
- By Geography
- North America
- United States
- Canada
- Mexico
- South America
- Brazil
- Argentina
- Rest of South America
- Europe
- Germany
- United Kingdom
- France
- Italy
- Spain
- Rest of Europe
- Asia Pacific
- China
- Japan
- South Korea
- India
- Australia
- New Zealand
- Rest of Asia-Pacific
- Middle East and Africa
- Middle East
- United Arab Emirates
- Saudi Arabia
- Turkey
- Rest of Middle East
- Africa
- South Africa
- Nigeria
- Kenya
- Rest of Africa
- Middle East
- North America
Data Sources, Market Sizing, and Validation
Desk Research
Desk work started by anchoring the demand context and procurement signals for high energy laser programs, then mapping how industrial high power lasers are being adopted in production lines. Public defense budget documents and procurement releases (including contract award notices) were used to understand timing, platform focus, and typical program phases. For industrial cues, sources such as the US Census Bureau manufacturing data, Bureau of Labor Statistics series, and trade statistics from UN Comtrade were used to cross-check where metalworking and electronics output trends were moving.
We also reviewed technical and standards style sources such as NIST publications, IEEE and SPIE open materials, and patent databases to understand technology direction (for example, fiber and solid-state scaling) and where power classes are shifting. Company annual reports, investor presentations, and reputable press helped validate product mix language and the pace of deliveries. Paid subscriptions for company financials and for news and financials were used selectively to speed up fact checks on revenue splits and event timelines. These desk sources are illustrative, and many other public references were used for collection, validation, and clarification.
Primary Interviews and Surveys
Primary work was used to test what we built from public signals, mainly through expert interviews and structured surveys across laser OEMs, subsystem suppliers, integrators, end-user engineering teams, and procurement focused roles. Because the market is global, coverage was balanced across APAC, EMEA, and the Americas, so regional deployment pace, qualification cycles, and typical power class choices could be compared on a like-for-like basis.
To keep responses practical, discussions focused on what is actually shipping or being qualified, typical lead times, and how pricing differs by power output and platform integration level. Where answers differed by region, we rechecked assumptions against public program timelines and then followed up to confirm the most realistic range.
Distribution of primary research fieldwork respondents
| Company type | Respondent position | Region |
|---|---|---|
| Top tier: 33% | CXOs: 13% | APAC: 39% |
| Mid tier: 50% | Functional/Unit leaders: 43% | EMEA: 34% |
| Smaller Players: 17% | Managers: 44% | Americas: 27% |
Market-Sizing & Forecasting
Sizing was built using the top-down and bottom-up combination, where defense procurement signals, published program timelines, and industrial production indicators were reconstructed into a realistic demand pool for high energy laser deployments and upgrades. Once that total was formed, it was corroborated with selective bottom-up approximations, such as sampled ASP times expected unit volumes by power class, plus channel checks on subsystem content where integration intensity is higher.
Key inputs used in the model included the shift toward fiber and solid-state systems, the mix by power output bands (including above 100 kW programs), platform adoption patterns across land, naval, airborne, and space use cases, and the cadence of industrial cutting, welding, and drilling investments. We also tracked program maturity signals, since prototypes and field trials do not convert into revenue at the same pace as contracted production lots. Where unit counts were unclear in bottom-up checks, gaps were handled by using power-class level pricing ranges validated by interviews, then applying conservative adoption curves until the results were consistent with the top line.
For forecasting, scenario analysis was used so deployment and procurement timing could be flexed around budget cycles, qualification delays, and production ramp rates. Those scenarios were then anchored to consensus ranges shared by primary respondents for delivery lead times and expected power scaling over the forecast window.
Data Validation & Update Cycle
Validation was done by triangulating the model against independent signals, such as public contract flow, platform level deployment announcements, and industrial output direction, then checking whether the implied ASP movement stayed realistic for each power band. Outliers were reviewed, and if a variance could not be explained by a known event like a major program ramp or a delayed qualification, the assumptions were revisited and experts were re-contacted.
A multi-step internal review was followed before sign-off, where inputs, calculations, and year-to-year bridges were checked by a second analyst for consistency. The report is refreshed annually, and interim updates are triggered when material events occur, such as large awards, policy changes, or notable production shifts. Before delivery, a final refresh pass is completed so clients receive the most current view available at that time.
Mordor Intelligence's High Energy Lasers Market Size Compared With Other Published Estimates
Published numbers for high energy lasers can spread apart even when the topic label looks the same, because each publisher draws lines differently around power thresholds, end uses, and what counts as a complete system versus a component. Differences also show up when one study leans on long-range growth assumptions and another stays closer to near-term procurement and production reality.
Low-power industrial lasers and standard laser processing equipment sit outside Mordor Intelligence's scope for this market, which reduces overlap with broader laser industry totals that sometimes get blended into one headline number. Other gaps often come from how currency timing is handled, whether forecast years assume fast defense program scaling, and whether power band splits are validated through interviews or kept as desk-based shares that may miss current delivery constraints.
Benchmark comparison
| Source | Market Size | Gaps in Research Methodology |
|---|---|---|
| Mordor Intelligence | USD 11.73 B (2026) | |
| Global Consultancy A | USD 12.90 B (2024) | Uses a 2024 base and forecasts out to 2032 with a higher growth assumption, and its power output buckets start below 1 kW, which can pull in a wider set of laser equipment beyond high energy use cases. |
| Industry Research Desk B | USD 10.30 B (2024) | Anchors sizing to a 2024 value with a 2025-2034 horizon, and the public summary provides limited clarity on whether revenue is counted as complete systems only or also includes a broader set of subsystems. |
Taken together, the table suggests that the spread is mainly driven by year alignment, power threshold definitions, and whether totals mix adjacent industrial laser categories with high energy programs. With clearer inputs tied to procurement visibility and validated power-class shares, we keep the final value easier to trace back to repeatable drivers when the model is refreshed.
Key Questions Answered in the Report
How fast is global demand for high-energy laser weapons growing?
The High Energy Lasers Market is forecast to expand at a 6.73% CAGR from 2026-2031, driven by defense budgets and satellite communications rollouts.
Which laser architecture holds the largest revenue share?
Fiber lasers led with 55.71% of total revenue in 2025 due to high electrical efficiency and scalable beam combining.
Why are systems above 100 kW attracting attention?
Output over 100 kW enables interception of rockets and cruise missiles at ranges near 7 km, prompting an 8.69% CAGR for this power segment.
Which region is the fastest growing buyer of high-energy lasers?
Asia-Pacific is advancing at 7.47% CAGR as China and India invest in indigenous production and military deployment.