
High Altitude Pseudo Satellites Market Size and Share
Market Overview
| Study Period | 2019 - 2031 |
|---|---|
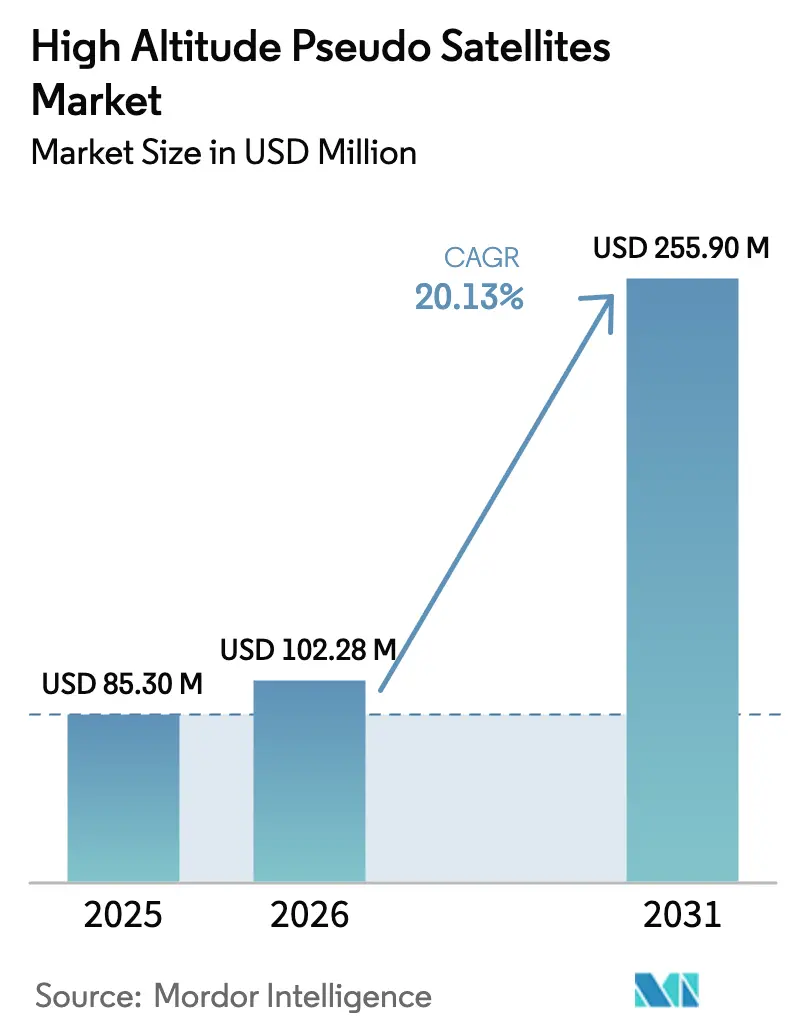
| Market Size (2026) | USD 102.28 Million |
| Market Size (2031) | USD 255.90 Million |
| Growth Rate (2026 - 2031) | 20.13 % |
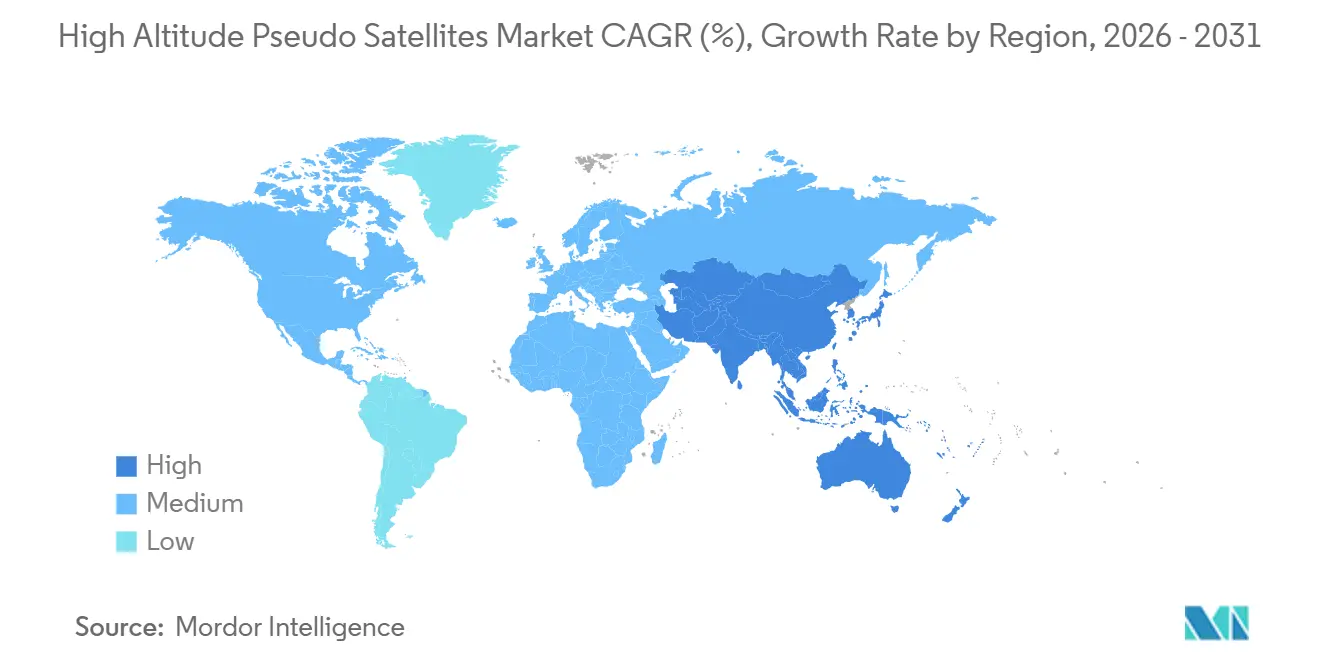
| Fastest Growing Market | Asia Pacific |
| Largest Market | North America |
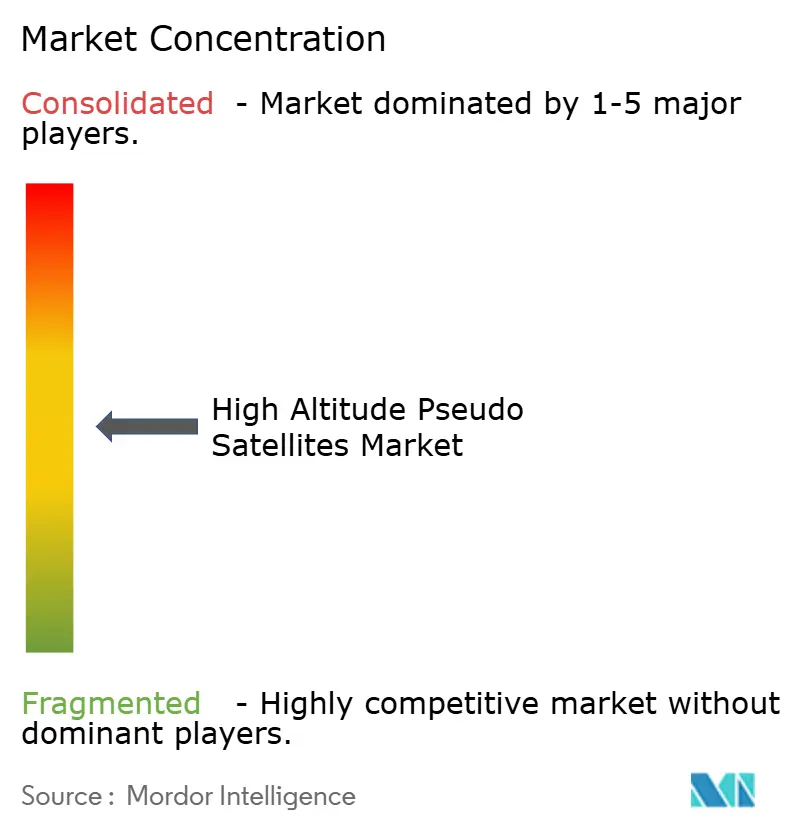
| Market Concentration | Medium |
Major Players *Disclaimer: Major Players sorted in no particular order Image © Mordor Intelligence. Reuse requires attribution under CC BY 4.0. | |
High Altitude Pseudo Satellites Market Analysis by Mordor Intelligence
The high-altitude pseudo-satellites market size is expected to grow from USD 85.30 million in 2025 to USD 102.28 million in 2026 and is forecasted to reach USD 247.56 million by 2031 at a 19.34% CAGR over 2026-2031. Demand stems from telecom operators racing to fill rural-connectivity gaps ahead of 6G standardization, defense ministries reallocating surveillance budgets toward stratospheric platforms, and regulators publishing airspace frameworks that shorten deployment cycles. Operators view the high-altitude pseudo-satellites market as an opportunity to deliver non-terrestrial 5G and early 6G services at a lower total cost of ownership than low-Earth-orbit constellations. Defense agencies favor year-round vigilance to avoid sortie-generation costs. Technological advancements in ultra-light solar modules, silicon-anode batteries, and hydrogen fuel cells extend mission endurance, while spectrum allocations in the 38 GHz and 47 GHz bands provide clear licensing paths. The sector’s momentum now hinges on proving multi-month stratospheric flights at costs that undercut satellite economics by an order of magnitude, a benchmark several pilots have neared since 2025.
Key Report Takeaways
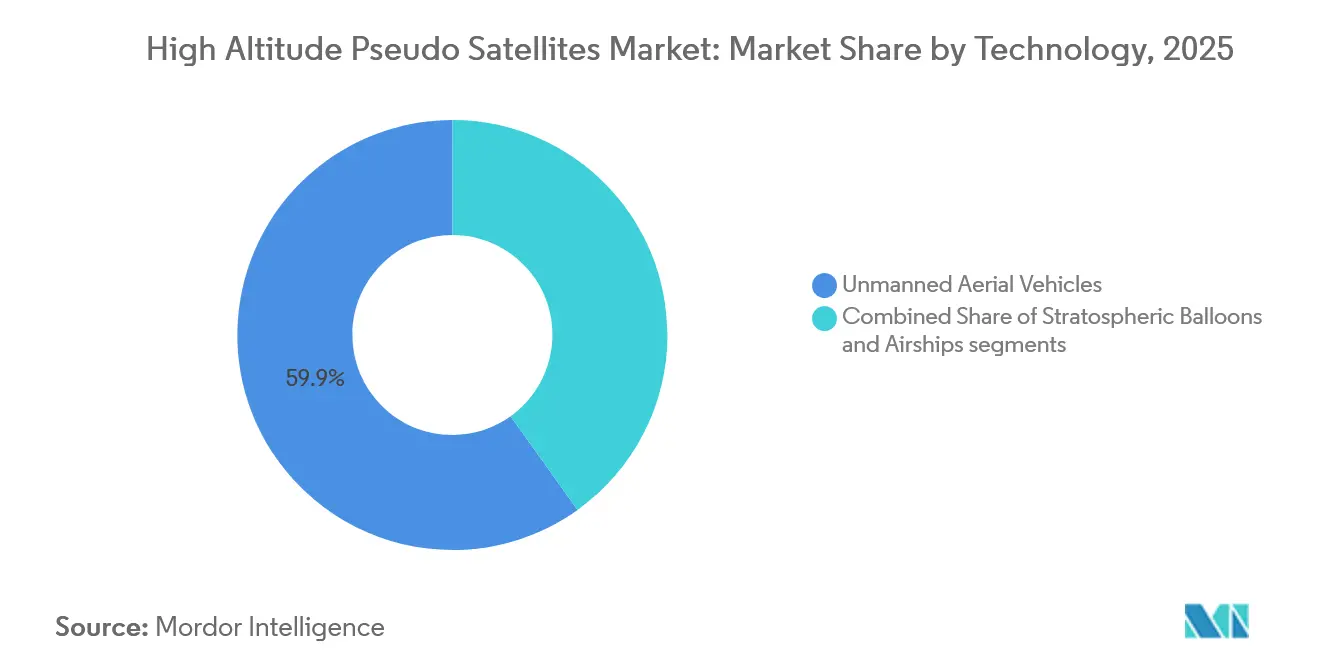
- By technology, unmanned aerial vehicles led with 59.85% of the high-altitude pseudo-satellites (HAPS) market share in 2025, while airships are forecast to expand at a 25.45% CAGR through 2031.
- By application, communication and connectivity captured 42.55% of 2025 revenue; the segment is projected to grow at a 24.40% CAGR to 2031.
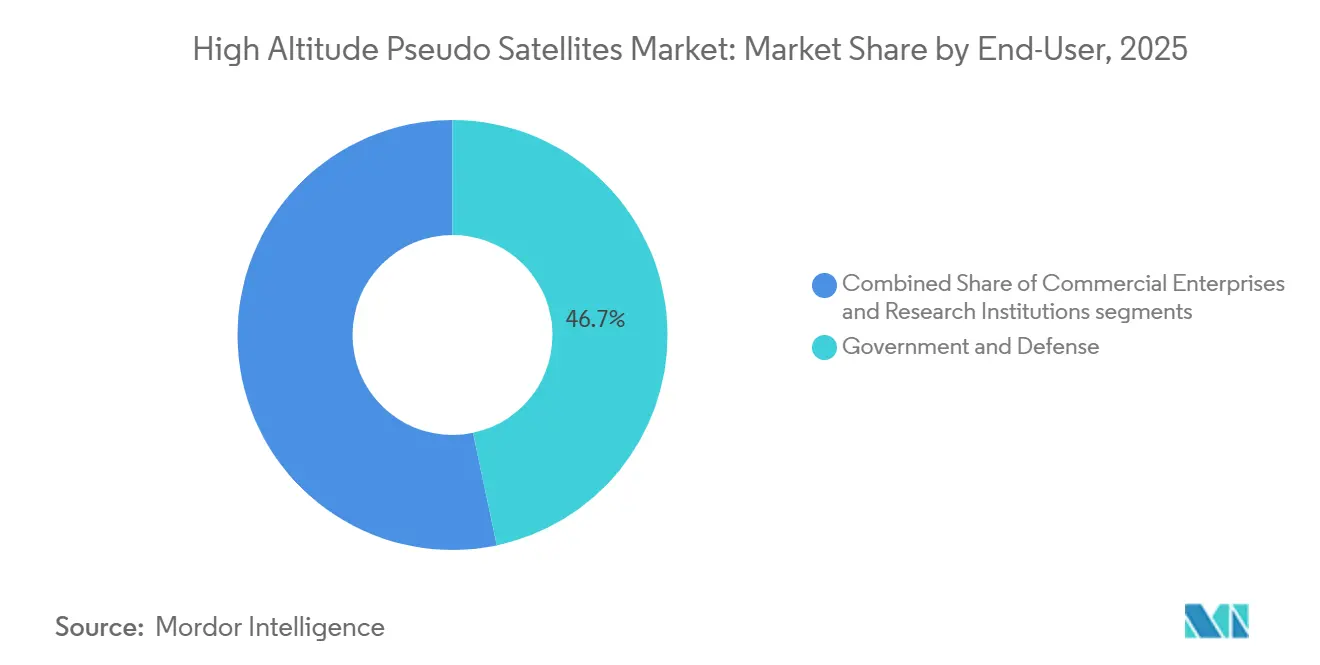
- By end-user, the government and defense sector held a 46.70% share of the high-altitude pseudo-satellites (HAPS) market size in 2025, while commercial enterprises recorded the fastest 25.50% CAGR through 2031.
- By power source, solar-electric systems accounted for 67.10% of 2025 installations, whereas hybrid hydrogen fuel cells advance at a 26.20% CAGR to 2031.
- By geography, North America led with 35.50% revenue in 2025, yet Asia-Pacific is the fastest region at a 25.70% CAGR through 2031.
Note: Market size and forecast figures in this report are generated using Mordor Intelligence’s proprietary estimation framework, updated with the latest available data and insights as of January 2026.
Market Trends and Insights
Drivers Impact Analysis of High Altitude Pseudo Satellites Market*
| Driver | (~)% Impact on CAGR Forecast | Geographic Relevance | Impact Timeline |
|---|---|---|---|
| Rapid 5G/6G NTN roll-outs | +4.5% | Global, early adoption in Japan, Kenya, EU test zones | Short term (≤ 2 years) |
| Growing ISR and persistent surveillance outlays | +3.2% | North America, Middle East, APAC border regions | Medium term (2-4 years) |
| Cost advantage over LEO constellations | +3.8% | Global rural and underserved markets | Medium term (2-4 years) |
| Advances in ultra-light solar/battery systems | +2.9% | Japan, Germany, United States | Long term (≥ 4 years) |
| Carbon-reduction mandates favoring low-emission rural backhaul | +2.1% | EU, North America, APAC spillover | Long term (≥ 4 years) |
| Stratospheric air-traffic corridors opened by regulators | +2.7% | North America, EU, ICAO guidance | Short term (≤ 2 years) |
| Source: Mordor Intelligence | |||
Rapid 5G/6G NTN Roll-Outs
Telecom operators integrate stratospheric platforms into non-terrestrial networks to extend 5G coverage into areas where traditional tower economics are insufficient. Space Compass utilized an Aalto Zephyr to serve 1,000 users across a 140 km radius in Kenya in March 2025, confirming the commercial viability of its service. [1] HAPSMobile demonstrated 38 GHz millimeter-wave connectivity in May 2024 and targets commercial service in Japan by late 2026, positioning the high-altitude pseudo-satellite (HAPS) market for early 6G integration. 3GPP Release 18 treats HAPS as a network node, allowing vendors to ship dual-mode radios through established supply chains. [2] These moves reduce integration risk, accelerate equipment certification, and anchor revenue projections for operators that prioritize rural and maritime coverage.
Growing ISR and Persistent Surveillance Outlays
Defense ministries are redirecting surveillance budgets toward stratospheric platforms that can loiter for months and cost less than crewed aircraft. The United States Army evaluates unmanned alternatives because manned ISR flights exceed USD 10,000 per hour, while platforms like BAE Systems’ PHASA-35 demonstrated 24-hour stratospheric endurance in December 2024 with a doubled payload capacity. Sceye’s NASA partnership exemplifies civil-government adoption for wildfire tracking and methane detection, further broadening the high-altitude pseudo-satellite (HAPS) market's customer base. [3] Persistent presence without refueling underpins new concepts of operation where assets remain on-station year-round, improving situational awareness.
Cost Advantage over LEO Constellations
Capital expenditure per HAPS platform ranges from USD 10 million to USD 50 million, versus USD 500 million to USD 5 billion for a replenishable low-Earth-orbit satellite constellation. Operating costs between USD 1,000 and USD 5,000 per flight hour avoid the ground-station networks and launch cycles baked into satellite economics. Platforms shift 500 km within 24 hours by harnessing stratospheric winds, offering the agility that satellites cannot match. Retrieval enables refurbishment and payload refresh instead of total loss at end-of-life, reinforcing the high-altitude pseudo-satellites (HAPS) market value proposition for both telecom and defense users.
Advances in Ultra-Light Solar/Battery Systems
Endurance depends on power density. Amprius silicon-anode batteries delivered 450 Wh/kg during Zephyr’s 67-day flight in May 2025, a 40% leap over conventional lithium packs. SoftBank and Longi’s heterojunction modules weigh 665 g/m², achieving 22.2% conversion efficiency, which enables 1.5 kW of continuous power while preserving structural margins. Perovskite research published in 2024 shows potential for 44 W/g specific power, promising to double payload capacity if commercialized by 2028. These gains lengthen night-time reserves and narrow the gap between solar and emerging hydrogen solutions.
Restraints Impact Analysis of High Altitude Pseudo Satellites Market*
| Restraint | (~)% Impact on CAGR Forecast | Geographic Relevance | Impact Timeline |
|---|---|---|---|
| High CAPEX and maintenance cost per flight-hour | -3.5% | Global, acute in price-sensitive markets | Medium term (2-4 years) |
| Spectrum and airspace regulatory complexity | -2.8% | Global, fragmented ITU regions | Short term (≤ 2 years) |
| Stratospheric wind-shear unpredictability | -1.9% | Equatorial and polar latitudes | Long term (≥ 4 years) |
| Insurance and liability gaps for >30-day unmanned sorties | -1.6% | North America and EU underwriting | Medium term (2-4 years) |
| Source: Mordor Intelligence | |||
High CAPEX and Maintenance Cost per Flight-Hour
Acquiring a single platform demands USD 10 million–USD 50 million, a hurdle for operators without sovereign backing or deep capital pools. Multi-month missions consume USD 2.16 million to USD 10.8 million in direct OPEX, and each retrieval cycle can cost an additional USD 1 million for controlled descent, hull inspection, and gas replenishment. Limited secondary markets lock in depreciation, while rapid technology advances threaten obsolescence. These economics narrow the addressable high-altitude pseudo-satellites (HAPS) market to well-funded telecom carriers and defense agencies until modular designs drive down unit prices.
Spectrum and Airspace Regulatory Complexity
HAPS fly at altitudes of 20–50 km, a zone once unregulated for persistent aircraft. Operators must juggle ITU spectrum allocations, ICAO air traffic rules, and national approvals. The United States opened 47 GHz for HAPS in 2024, while many EU states await CEPT harmonization, due by 2027. Airworthiness remains a case-by-case process, creating multi-year backlogs. Each factor erodes deployment speed, delaying revenue conversion across the high-altitude pseudo-satellites (HAPS) market pipeline.
*Our forecasts treat driver/restraint impacts as directional, not additive. The impact forecasts reflect baseline growth, mix effects, and variable interactions.
High Altitude Pseudo Satellites Market Segment Analysis
By Technology:
UAVs Lead, While Airships AccelerateUnmanned aerial vehicles controlled 59.85% of the 2025 revenue within the high-altitude pseudo-satellite market, due to their proven solar-electric designs capable of carrying 150-lb payloads and multi-month flights. Airships emerge as the fastest-growing class at a 25.45% CAGR, propelled by hull fabrics that hold helium for year-long missions without retrieval. Balloons remain the low-cost choice for sub-30-day scientific campaigns. AeroVironment’s Horus A gained FAA certification in October 2024, demonstrating a clear path to commercial ISR contracting, whereas Sceye’s 270-ft airship targets telecom backhaul with a stationary footprint over 10,000 km².
Airships leverage buoyancy to hover almost motionless, consuming minimal propulsion energy, which is an advantage for video surveillance and backhaul applications that require stable pointing. UAVs utilize continuous propeller thrust, sacrificing higher energy needs for agile repositioning when disasters or seasonal events alter demand. Balloons serve universities needing rapid launches but lack station-keeping and controllability. Taken together, these trade-offs diversify revenue channels within the high-altitude pseudo-satellite (HAPS) market, with each technology catering to specific endurance, payload, and capital expenditure (Capex) tolerances.

By Application:
Connectivity Dominates, Climate Monitoring GainsCommunication and connectivity platforms captured 42.55% of the 2025 revenue in the high-altitude pseudo-satellites (HAPS) market, and this portion is projected to grow at a 24.40% CAGR as mobile network operators embed HAPS nodes into rural 5G rollouts, reducing the need for expensive tower grids in sparsely populated areas. Intelligence, surveillance, and reconnaissance (ISR) capabilities follow, with militaries shifting from crewed patrol aircraft to persistent “eyes-in-the-sky” stratospheric assets that can loiter for weeks without refueling. Earth-observation and climate-monitoring demand is rising because NASA and USGS procure methane and wildfire data from stratospheric airships, creating a civilian revenue stream that diversifies operator income. Navigation and scientific missions remain niche but benefit from shared airtime, amortizing platform costs across multiple payload types to maintain high utilization.
The March 2025 Zephyr field trial demonstrated that one HAPS platform can cover the area typically served by approximately 50 macro towers, validating a compelling economic lever for rural telecom carriers. BAE Systems integrated a synthetic-aperture radar into its PHASA-35, demonstrating the ISR potential for border and maritime surveillance at a fraction of the cost of crewed aircraft. Sceye’s civil contracts demonstrate how environmental sensing revenues can subsidize connectivity payloads, creating blended business models. As dual-payload missions that pair broadband links with high-resolution imagery become common, operators increase flight utilization and shorten payback periods. This diversification reduces reliance on any single customer class, strengthens cash flows, and broadens the total addressable market for high-altitude pseudo-satellites (HAPS).
By End-User:
Defense Anchors, Commercial SurgesGovernment and defense agencies controlled 46.70% of the 2025 revenue in the high-altitude pseudo-satellite (HAPS) market, as ISR budgets and border-monitoring mandates are well-funded despite fiscal pressure. The ability to hover for months without refueling lets commanders replace fleets of short-endurance drones and manned turboprops, generating significant life-cycle savings. Commercial enterprises, however, are posting the fastest growth rate of 25.50% CAGR as telecom carriers deploy rural broadband links and energy firms monitor pipelines and offshore assets. Research institutions secure smaller allocations aimed at atmospheric science, but they often collaborate with commercial operators to share airtime costs. This evolving mix signals a transition from defense-led pilots to broad commercial adoption, unlocking scalable manufacturing.
SoftBank’s plan to launch stratospheric service in Japan by 2026 marks a pivotal inflection point for commercial uptake. The project integrates HAPS relays into SoftBank’s terrestrial core, extending 5G coverage into mountainous regions where traditional tower economics are ineffective. Space Compass’s paying users in Kenya prove that rural customers will subscribe when pricing and reliability match terrestrial standards. As defense agencies validate multi-month endurance, commercial players inherit proven airframes, reducing technical risk. Insurance carriers also gain confidence, widening underwriting capacity. These dynamics accelerate cross-sector scale, making the high-altitude pseudo-satellites (HAPS) market attractive to infrastructure investors that previously focused on fiber and low-Earth-orbit constellations.
By Power Source:
Solar Dominates, Hydrogen AdvancesSolar-electric designs accounted for 67.10% of 2025 installations, driven by robust photovoltaic supply chains, declining panel prices, and steady efficiency gains that minimize the mass of energy storage. Hybrid hydrogen fuel-cell systems, although still emerging, are projected to post a 26.20% CAGR because they promise double the payload capacity and longer autonomous nights that can support multi-sensor ISR suites. Battery-only variants remain essential as redundancy, offering safe-mode power during cloud-shadow or fuel-cell maintenance events. Platform developers now design modular bays that can switch between solar, hydrogen, or hybrid stacks, depending on the mission length and power draw, ensuring procurement flexibility. This adaptability attracts telecom operators focused on cost, while militaries concentrate on performance, thereby enlarging the addressable high-altitude pseudo-satellite (HAPS) market.
Amprius silicon-anode batteries enhance nighttime endurance for solar platforms by delivering 450 Wh/kg, which extends loiter time without increasing wingspan or structural requirements. Concurrently, NASA is testing an approach of 1.5 kW/kg with fuel cells, edging toward the Department of Energy’s 2.0 kW/kg target and opening the door for high-power radar payloads. Solar, therefore, remains the preferred choice for telecom and earth-observation tasks with modest power requirements, while hydrogen solutions attract ISR programs that require kilowatt-class sensors. This bifurcation shapes corporate R&D roadmaps and procurement strategies, nudging suppliers to develop standard avionics that interoperate across both power architectures.
Geography Analysis
North America High Altitude Pseudo Satellites Market
North America captured 35.50% of the 2025 revenue, buoyed by the Federal Aviation Administration's (FAA) high-altitude corridors, the Federal Communications Commission's 47 GHz spectrum allocations, and the Department of Defense's ISR budgets, which underwrite multi-year contracts. AeroVironment’s Horus A certification demonstrates that clear rules can shorten commercialization timelines, while partnerships with NASA and the USGS act as anchor tenants that de-risk cash flows. Venture capital and mature aerospace supply chains concentrate early production in the United States, fostering economies of scale that lower unit cost and expand the overall high-altitude pseudo-satellites (HAPS) market.
APAC and Africa High Altitude Pseudo Satellites Market
Asia-Pacific advances fastest at 25.70% CAGR through 2031, propelled by Japan’s scheduled commercial launches, India’s border-surveillance pilots, and China’s near-space vehicle programs. SoftBank’s late-2026 service will bridge significant coverage gaps and ensure seamless handoffs between terrestrial and stratospheric cells. Kenya’s proof-of-concept offers a template for emerging economies in Southeast Asia and Pacific islands, illustrating how HAPS enables mobile-money ecosystems and e-government services. Regional regulators in Australia and South Korea, as they evaluate spectrum releases, further widen the addressable high-altitude pseudo-satellite (HAPS) market.
EMEA and South America High Altitude Pseudo Satellites Market
Europe holds a mid-tier share but faces a regulatory lag until EASA's operational rules are finalized in 2026. BAE Systems’ PHASA-35 and DLR’s HAP-alpha flights demonstrate technical competence despite slower approvals. Middle Eastern operators deploy HAPS for oil-field connectivity under permissive airspace regimes, while Africa and South America remain embryonic, focusing on pilots in the Amazon and Sahel regions. Adoption is expected to accelerate once local regulators adopt ICAO templates, diversifying the global high-altitude pseudo-satellites (HAPS) market footprint.
Regulatory Landscape
High-altitude pseudo-satellites operate in a regulatory grey zone between civil aviation and space, so deployments rely on parallel clearances for airspace, spectrum, and operational safety. In Europe, EASA initiated work on Higher Airspace Operations (HAO) frameworks in November 2024, focusing on integrated traffic management concepts and operator responsibilities for persistent operations above conventional flight levels. At the global level, ITU Radio Regulations updated via WRC-23 entered into force in January 2025, strengthening the international basis for treating HAPS as IMT base stations and supporting cross-border spectrum coordination for connectivity payloads.
National actions continue to shape time-to-market and divergence by use case. Japan's Ministry of Internal Affairs and Communications issued Technical Requirements for HAPS in November 2025 as part of next-generation mobile communications, directly supporting telecom-led trials and certification pathways. In defense procurement, India's Defence Acquisition Council granted Acceptance of Necessity in February 2026 for an airship-based HAPS program valued at INR 15,000 crore, providing a formal acquisition route and supporting local-industry participation, while also underscoring that airworthiness, liability, and higher-airspace corridor rules remain uneven across regions.
Value Chain Analysis
The HAPS value chain begins with enabling components, including ultra-light structures, high-efficiency solar modules, power management electronics, and high-energy-density storage. It then moves through platform OEMs and integrators, covering fixed-wing solar UAVs, airships, and balloons, before reaching mission payloads such as telecom radios, ISR sensors, and environmental instruments, supported by ground infrastructure for launch and recovery, command-and-control, and air-to-ground backhaul. Battery and energy subsystems remain a key chokepoint for endurance, a differentiator for both telecom and defense programs, with silicon-anode batteries referenced (e.g., Amprius) and specialist battery pack suppliers (e.g., Lincad for PHASA-35), alongside high-efficiency solar-cell approaches used on Zephyr-class aircraft.
Downstream, service delivery depends on partnerships that link platform availability, launch operations, and network services. Airbus and NTT Docomo Space Compass illustrate this model by pairing an airframe supplier with a telecom service operator, while Airspan's January 2026 partnership with Space Compass adds 5G air-to-ground communications for maritime surveillance use cases. Operational readiness also depends on access to launch and landing sites, recovery logistics, and local regulatory coordination, reflected in AALTO's February 2026 plan to establish an AALTOPORT hub in northern Australia and in multi-geography trial activity such as Kenya. For defense-led scaling, India's 2026 Make-1 oriented projects introduce local-content and co-development dynamics that affect sourcing, qualification, and production footprints for both airships and fixed-wing HAPS platforms.
Competitive Landscape
The high-altitude pseudo-satellites (HAPS) market exhibits moderate concentration, with aircraft integrators, telecom operators, and payload manufacturers forming cross-industry partnerships. Key differentiators include demonstrated endurance, payload capacity, production readiness, and regulatory approvals. AALTO's Zephyr achieved a 67-day endurance record in May 2025, highlighting the advantages of silicon-anode batteries and establishing the company as an early supplier to telecom carriers.
Sceye's 270-ft airship, supported by USD 525 million in Series C financing, aims to provide year-long stationary coverage for oil-and-gas and climate-monitoring customers. This diversification maintains high competitive intensity and distributes risk across workforce expertise, material supply chains, and regulatory compliance.
Technological approaches vary as solar UAVs focus on telecom payloads under 2 kW, hydrogen hybrids cater to ISR clients requiring 5 kW, and airships combine buoyancy with large platforms for multi-sensor arrays. Patent filings for station-keeping algorithms leveraging stratospheric winds indicate the development of stronger intellectual property protections. Early approvals from the FCC or FAA provide first-mover advantages, granting pioneers access to spectrum and airspace, enabling them to secure anchor customers ahead of competitors. As product portfolios grow, market consolidation is expected, with smaller European balloon vendors potentially merging or shifting toward research-focused niches. Ongoing design improvements, coupled with declining component costs, are driving the high-altitude pseudo-satellites (HAPS) market toward achieving greater endurance and reducing the cost per transmitted gigabyte.
High Altitude Pseudo Satellites Industry Leaders
-
AeroVironment, Inc.
-
Thales Group
-
BAE Systems plc
-
Airbus SE
-
Aurora Flight Sciences (The Boeing Company)
- *Disclaimer: Major Players sorted in no particular order
High Altitude Pseudo Satellites Market Companies Covered in this Report
- AeroVironment, Inc.
- Airbus SE
- BAE Systems plc
- Thales Group
- Aerostar LLC
- Mira Aerospace Ltd.
- Sceye Inc.
- Stratosyst s.r.o.
- Involve Space S.R.L.
- HAPSMobile Inc. (SoftBank Corp.)
- Aurora Flight Sciences (The Boeing Company)
- Avealto Limited
- Zero 2 Infinity, S.L.
- Kea Aerospace Limited
- Stratospheric Platforms Ltd.
- Atlas LTA Advanced Technology, Ltd.
- Sierra Nevada Company, LLC.
- Maraal Aerospace Pvt. Ltd.
- Voltitude Ltd.
Market Opportunities and Future Outlook
Near-term whitespace sits where customers need persistent coverage but cannot justify satellite constellations or dense terrestrial buildouts, especially in maritime domain awareness, border surveillance, and remote connectivity backhaul. Demand signals show up across defense programs and procurement actions, including a multiyear Air Force Research Laboratory engagement for BAE Systems PHASA-35 running through April 2030 and India's 2026 procurement actions to bridge surveillance gaps. On the commercial side, telecom-centered ecosystems are forming around non-terrestrial network integration, with Space Compass trials and Airspan's January 2026 step to bring 5G air-to-ground capabilities into HAPS-enabled maritime surveillance expanding service models beyond rural-only broadband.
Technology maturation is translating into clearer productization pathways for airships and long-endurance fixed-wing platforms, creating room for multi-mission payload hosting and blended revenue streams (connectivity plus sensing). Sceye Endurance Program offers a concrete proof point in 2026, with a 12-day, 6,400-mile stratospheric flight that demonstrated repeated day-night operations and pressure and power loop closure, strengthening the case for civil-government monitoring such as wildfire and methane detection tied to NASA-aligned participation. As regulators progress higher-airspace frameworks (EASA HAO work since 2024) and spectrum rule updates are already in force at the ITU level from January 2025, operators have clearer approval routes, though harmonized airspace corridors and insurance coverage for long sorties still limit execution largely to well-capitalized telecoms, defense agencies, and a smaller set of platform primes and specialists.
Recent Industry Developments in High Altitude Pseudo Satellites Market
- July 2026: Sceye completed a 12-day, 6,400-mile stratospheric flight with its SE2 vehicle from New Mexico to Brazil as part of its Endurance Program. The mission demonstrated repeated day-night cycling and endurance-relevant system stability, supporting commercialization efforts across connectivity and environmental monitoring use cases.
- December 2025: BAE Systems PHASA-35 secured a multiyear Air Force Research Laboratory airborne surveillance contract (administered via NASA) extending through April 2030. The award reinforces defense as an anchor buyer for persistent stratospheric ISR and helps fund platform maturation and payload integration at operational tempos.
- October 2024: AeroVironment flight-tested its Horus A solar-powered aircraft aimed at stratospheric payload operations. The test activity advanced a solar-UAS HAPS pathway for ISR and communications missions by validating platform performance and autonomy improvements needed for longer-duration sorties.
High Altitude Pseudo Satellites Market Report Scope and Research Methodology
Market Definition and Coverage
This market tracks the revenue generated from high altitude pseudo satellites (HAPS), meaning unmanned stratospheric platforms that can stay aloft for long durations to deliver satellite-like services such as communications and observation.
Scope exclusions: We exclude most downstream service revenues (for example, connectivity subscriptions), routine operations support, and payload-only retrofits when they are sold separately from the platform.
Segments Covered in This Report
- By Technology
- Stratospheric Balloons
- Unmanned Aerial Vehicles
- Airships
- By Application
- Communication and Connectivity
- Intelligence, Surveillance and Reconnaissance (ISR)
- Earth Observation and Climate Monitoring
- Navigation and Positioning
- Scientific and Research Missions
- By End-User
- Government and Defense
- Commercial Enterprises
- Research Institutions
- By Power Source
- Solar-Electric
- Hybrid Hydrogen-Fuel-Cell
- Battery
- By Geography
- North America
- United States
- Canada
- Mexico
- Europe
- United Kingdom
- France
- Germany
- Italy
- Rest of Europe
- Asia-Pacific
- China
- India
- Japan
- Australia
- South Korea
- Rest of Asia-Pacific
- South America
- Brazil
- Rest of South America
- Middle East and Africa
- Middle East
- Saudi Arabia
- United Arab Emirates
- Turkey
- Rest of Middle East
- Africa
- South Africa
- Rest of Africa
- Middle East
- North America
Data Sources, Market Sizing, and Validation
Desk Research
Desk work starts with building a clear fact base on stratospheric aviation rules, spectrum availability, and procurement signals, so assumptions are grounded in public evidence. We rely on sources such as the International Telecommunication Union for spectrum context, the Federal Aviation Administration for airspace direction, EASA for safety and certification signals, NASA and NOAA for high altitude flight and weather constraints that influence endurance, and defense budget documents and tender portals for visibility into planned surveillance and communications programs.
To shape the commercial demand environment, we also review company annual reports, 10-K style filings, investor presentations, and official press releases on flight trials, partnerships, and contract awards. Where needed, a paid company financials and intelligence subscription and a patent database are used to cross-check timelines, ownership of key technologies, and readiness indicators that influence adoption timing. These examples are not exhaustive, and we used many other public sources for collection, validation, and clarification.
Primary Interviews and Surveys
Primary work focuses on confirming what is actually being purchased and delivered, and how pricing is trending as platforms move from trials into limited deployments. We spoke with a mix of platform developers, payload integrators, operators, defense users, and telecom stakeholders across major regions to validate adoption timing, typical configurations, and realistic annual delivery volumes.
Distribution of primary research fieldwork respondents
| Company type | Respondent position | Region |
|---|---|---|
| Top tier: 33% | CXOs: 13% | APAC: 52% |
| Mid tier: 51% | Functional/Unit leaders: 31% | EMEA: 29% |
| Smaller Players: 16% | Managers: 56% | Americas: 19% |
Market-Sizing & Forecasting
Sizing is built using a top-down and bottom-up blend, where disclosed delivery pipelines and procurement budgets are translated into an addressable demand pool for HAPS platforms by region, and then converted into value using configuration-based pricing. Since shipment disclosure is limited in this market, the model leans on program timelines, trial to deployment conversion rates, endurance and payload expectations, and the mix of defense versus commercial use cases to shape yearly unit volumes.
Results are then corroborated with selective bottom-up approximations, such as sampling a set of active programs, applying typical unit prices by platform type, and checking how many platforms a deployment can practically sustain given maintenance cycles and replacement needs. When gaps show up, we apply conservative assumptions first and then revisit them during interviews, especially for what is included in the platform bill of materials and how average selling prices shift as scale improves.
For forecasting, scenario analysis is used because adoption depends on airspace clearances, spectrum access, and reliability milestones that can move deployments forward or backward by a year. We build a base case first, then adjust with upside and downside paths based on expert views on commercialization pace and procurement funding stability.
Data Validation & Update Cycle
Validation is done by comparing outputs against independent signals, including public contract awards, flight test cadence, and stated production readiness targets, which help flag years that look too aggressive or too flat. Variances are reviewed in steps, first at the assumption level, then at the regional roll-up level, followed by an internal analyst review before sign-off.
If a major program slips, a new spectrum decision is announced, or a meaningful price change is signaled, the key inputs are rechecked and expert follow-ups are triggered. The report is refreshed annually, and a final pass is completed close to delivery so clients receive the latest view of market-moving events.
Mordor Intelligence's High Altitude Pseudo Satellites Market Size Compared With Other Published Estimates
Published market sizes for HAPS often differ because the market is still early, and not every publisher draws the revenue line in the same place between platform sales, payload bundles, and service-type earnings. Differences also come from which programs are treated as operational deployments versus extended trials, and from how quickly unit pricing is assumed to normalize over time.
A refresh-led driver is timing, since the currency conversion month, the year used for price baselines, and whether list prices are used instead of deal-level ranges can move a small market by a noticeable amount. Quarterly checks on program status and pricing bands are used to keep the 2025 total anchored to what is contractable, and that cadence is what keeps Mordor Intelligence aligned with the active demand pool.
Benchmark comparison
| Source | Market Size | Gaps in Research Methodology |
|---|---|---|
| Mordor Intelligence | USD 85.30 M (2025) | |
| Industry Research House A | USD 104.50 M (2024) | Uses a 2024 base year and a broader revenue framing that can mix platform revenue with adjacent commercialization activity, which can lift the current value when programs are still in pilot phases. |
| Global Publisher B | USD 86.40 M (2024) | Applies a different forecast window and pricing progression, and the lower growth path suggests more conservative assumptions on deployment conversion and unit price improvements through 2030. |
The spread becomes easier to explain once year timing, what counts as platform revenue, and the handling of early deployments are aligned consistently. By keeping scope tight and then rechecking pricing and program milestones on a regular schedule, we end up with a market value that can be traced back to clear inputs and repeatable steps.
Key Questions Answered in the Report
What is the projected value of the high-altitude pseudo-satellites (HAPS) market by 2031?
The market is forecast to reach USD 255.90 million by 2031, reflecting a 20.13% CAGR.
Which region will grow fastest in high-altitude pseudo-satellites deployment?
Asia-Pacific leads with a 25.70% forecast CAGR, driven by Japanese commercial launches and Indian border-monitoring projects.
Why do telecom operators prefer HAPS over terrestrial towers in rural zones?
A single platform can blanket a 140 km radius, equating to roughly 50 macro towers, lowering capex while meeting coverage mandates.
What technology currently dominates the power source mix?
Solar-electric systems account for 67.10% of installed platforms thanks to mature photovoltaic and battery supply chains.
How long can modern HAPS platforms remain aloft?
Endurance records reached 67 days in 2025, and year-long missions are expected once current airship programs enter service.