
Hemoglobinopathies Treatment Market Size and Share
Market Overview
| Study Period | 2020 - 2031 |
|---|---|
| Market Size (2026) | USD 11.45 Billion |
| Market Size (2031) | USD 16.72 Billion |
| Growth Rate (2026 - 2031) | 7.88 % |
| Fastest Growing Market | Asia Pacific |
| Largest Market | North America |
| Market Concentration | Medium |
Major Players *Disclaimer: Major Players sorted in no particular order Image © Mordor Intelligence. Reuse requires attribution under CC BY 4.0. | |
Hemoglobinopathies Treatment Market Analysis by Mordor Intelligence
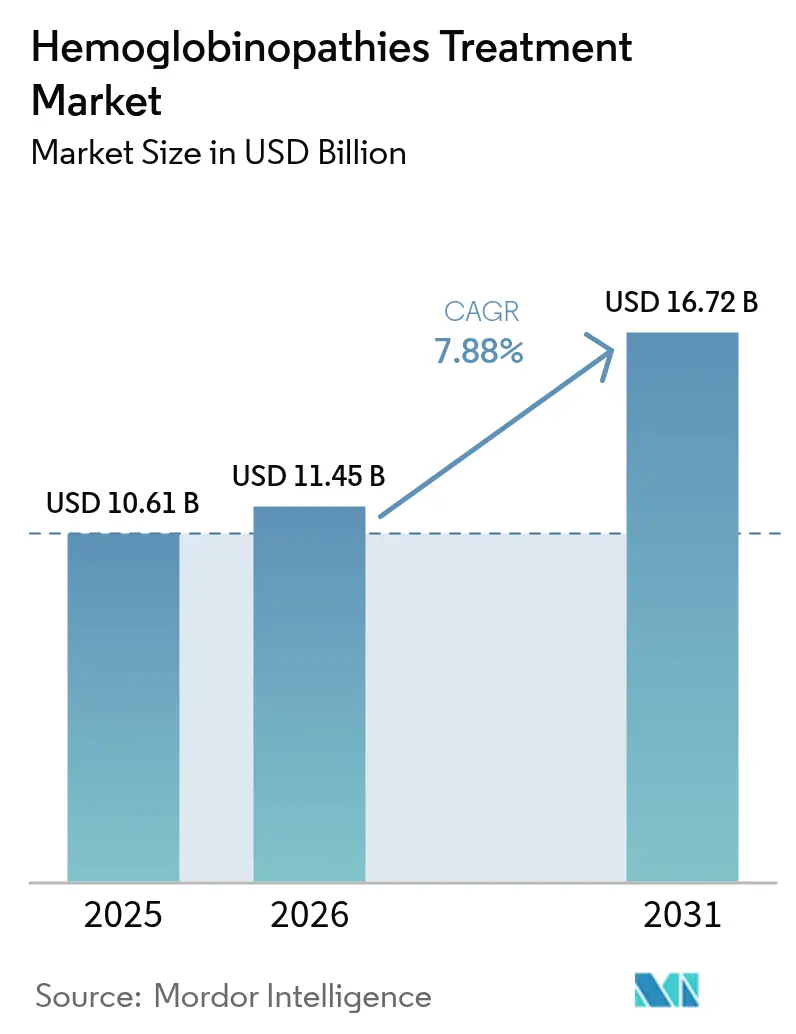
Hemoglobinopathies treatment market size in 2026 is estimated at USD 11.45 billion, growing from 2025 value of USD 10.61 billion with 2031 projections showing USD 16.72 billion, growing at 7.88% CAGR over 2026-2031. This expansion reflects rapid uptake of first-in-class gene therapies, wider newborn screening coverage, and steady investment in specialized care infrastructure. Blood transfusion therapy remains the largest treatment modality, yet physicians increasingly recommend gene-editing options as regulatory approvals build clinical confidence. Rising reimbursement support for rare-disease drugs in middle-income economies is enlarging the eligible patient pool, while artificial-intelligence diagnostics shorten time to diagnosis and treatment initiation. Regional growth differentials persist: North America captures premium revenue through early adoption of curative therapies, whereas Asia–Pacific delivers the fastest incremental volume gains on the back of government-funded screening programs.
Key Report Takeaways
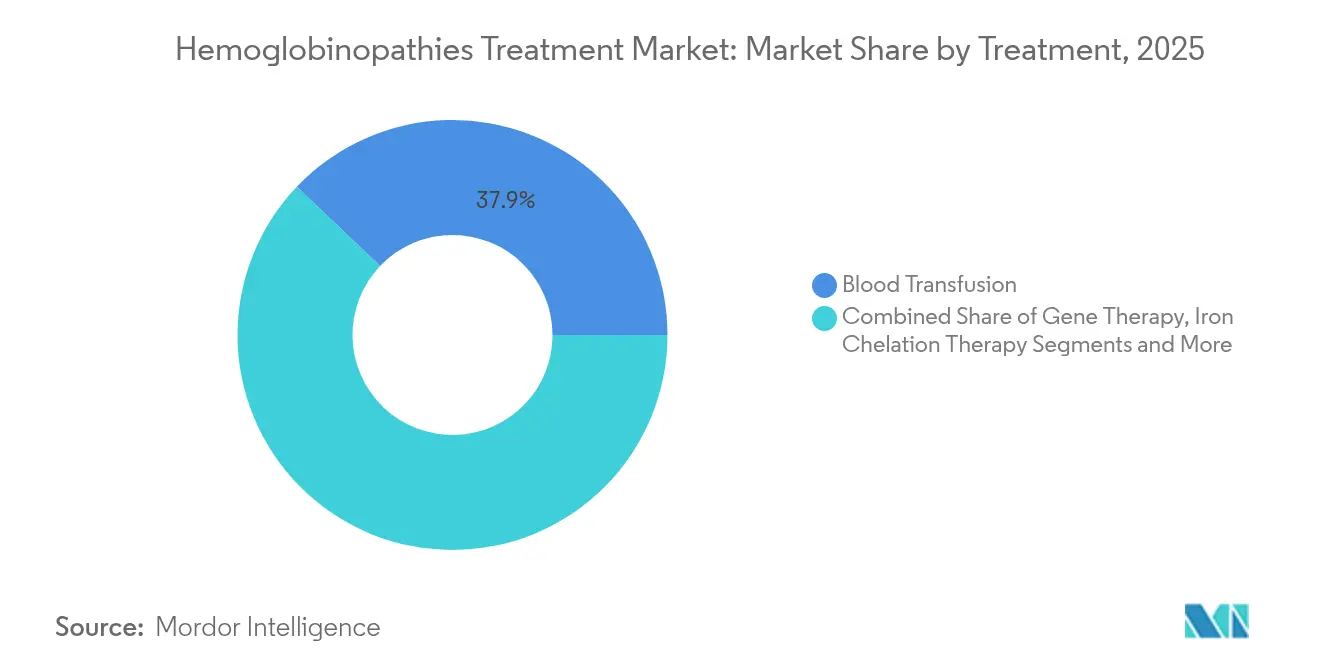
- By treatment, blood transfusion therapy led with 37.89% of hemoglobinopathies treatment market share in 2025; gene therapy is projected to record the highest 19.06% CAGR through 2031.
- By application, sickle cell disease accounted for 48.03% share of the hemoglobinopathies treatment market size in 2025, while thalassemia is forecast to expand at a 10.73% CAGR to 2031.
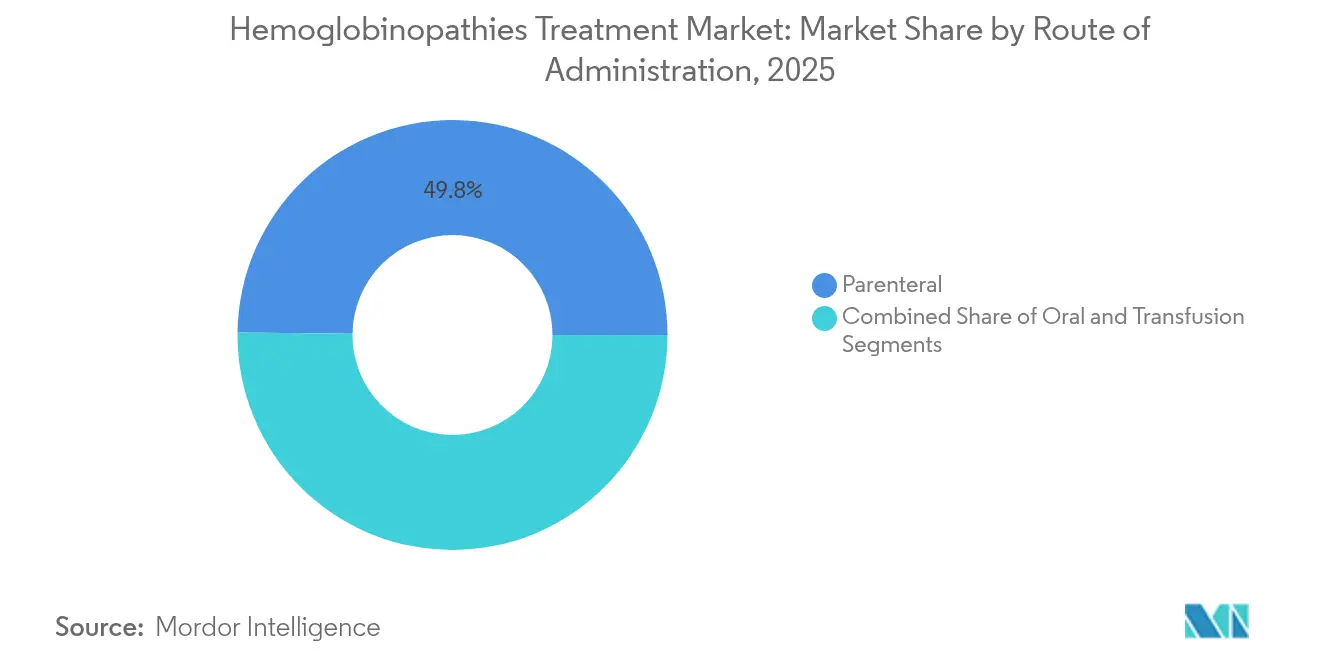
- By route of administration, parenteral formulations dominated with 49.81% share in 2025; subcutaneous and other minimally invasive routes are advancing at an 8.74% CAGR through 2031.
- By end user, hospitals captured 64.23% of hemoglobinopathies treatment market size in 2025, yet specialty clinics exhibit the fastest 9.54% CAGR through 2031.
- By geography, North America held 34.92% revenue share in 2025; Asia-Pacific is on track to post the highest 9.43% CAGR during the forecast horizon.
Note: Market size and forecast figures in this report are generated using Mordor Intelligence’s proprietary estimation framework, updated with the latest available data and insights as of 2026.
Market Trends and Insights
Drivers Impact Analysis of Hemoglobinopathies Treatment Market*
| Driver | (~) % Impact on CAGR Forecast | Geographic Relevance | Impact Timeline |
|---|---|---|---|
| Increasing prevalence of hemoglobinopathies | +1.5% | Sub-Saharan Africa, Mediterranean, Middle East | Long term (≥ 4 years) |
| Expanding newborn & antenatal screening | +2.1% | Asia–Pacific core, spill-over to MEA & South America | Medium term (2-4 years) |
| First-in-class gene-therapy approvals | +1.8% | North America & EU, early uptake in developed Asia–Pacific markets | Short term (≤ 2 years) |
| Rare-disease reimbursement roll-outs | +1.2% | Latin America, Eastern Europe, Southeast Asia | Medium term (2-4 years) |
| Decentralized blood-transfusion networks | +0.9% | Sub-Saharan Africa, pilot programs in West Africa | Long term (≥ 4 years) |
| AI-enabled point-of-care diagnostics | +0.7% | Urban centers worldwide | Short term (≤ 2 years) |
| Source: Mordor Intelligence | |||
First-in-class gene-therapy approvals accelerate adoption
FDA clearance of CASGEVY and LYFGENIA between late-2023 and early-2024 has reshaped clinician expectations around curative options. Post-approval real-world data show 94% of evaluable patients eliminating severe vaso-occlusive events within the first 18 months of follow-up. European Medicines Agency authorization widens access across 27 member states and signals a harmonized regulatory pathway for subsequent CRISPR platforms. Early clinical success is driving referral patterns toward definitive therapy, particularly among adolescents who aim to avoid lifelong transfusions and chelation. Treatment centers report rising wait-lists, prompting investments in vector-manufacturing capacity and apheresis infrastructure. The acceleration of gene-therapy uptake is expected to lift the hemoglobinopathies treatment market through premium pricing and extended survival benefits.
Expanding newborn & antenatal screening programs
Mandated screening across high-burden states in India, coupled with roll-outs in Nigeria and Brazil, is enabling earlier diagnosis and linkage to care. India’s multicentric cohort initiative spans seven tertiary hospitals and integrates digital registries for longitudinal follow-up. WHO modeling indicates universal screening could avert 70% of sickle-cell-related mortality, galvanizing donor-funded laboratory upgrades across Sub-Saharan Africa. Rapid diagnostics such as the Gazelle multispectral reader achieve 96.8% accuracy within 3 days of birth[1]HemaSphere, “Multispectral Imaging for Microchip Electrophoresis,” hemasphere.org. In advanced markets, dual-review antenatal protocols standardize result interpretation and improve counseling uptake. Earlier identification expands the candidate pool for curative therapies and supports sustainable volume growth in the hemoglobinopathies treatment market.
Rare-disease reimbursement roll-outs in middle-income nations
Outcome-based payment schemes are emerging to bridge affordability gaps for USD 2 million gene-editing products. The US CMS Cell and Gene Therapy Access Model links reimbursement to predefined clinical milestones, while Thailand and Malaysia have introduced tiered coverage linked to disease severity. Value-based price modeling suggests 80–90% list-price reductions are required for broad access in lower-income settings. Early adopter programs in Brazil include risk-sharing contracts that cap payer exposure if post-infusion transfusion independence is not achieved. These policy shifts widen the hemoglobinopathies treatment market addressable base and de-risk manufacturer revenue streams.
AI-enabled point-of-care diagnostics integration
Machine-vision algorithms embedded in microchip electrophoresis systems cut diagnostic cycle times from days to under one hour, allowing same-visit clinical decision-making. Automated venipuncture robots improve vein localization and reduce pediatric procedural anxiety. Field deployment studies in Ghana show 25% higher screening throughput versus manual approaches. Integration of electronic medical-record interfaces ensures seamless data capture for population registries, strengthening surveillance and research initiatives. Faster diagnosis feeds directly into higher therapy uptake, reinforcing growth in the hemoglobinopathies treatment market.
Restraints Impact Analysis of Hemoglobinopathies Treatment Market*
| Restraint | (~) % Impact on CAGR Forecast | Geographic Relevance | Impact Timeline |
|---|---|---|---|
| High cost of curative therapies | −1.8% | Global, sharpest in middle-income nations | Short term (≤ 2 years) |
| Donor-match scarcity for stem-cell grafts | −0.9% | Worldwide, amplified in genetically diverse populations | Long term (≥ 4 years) |
| Cold-chain gaps for biologics | −0.6% | Sub-Saharan Africa, Southeast Asia, Latin America | Medium term (2-4 years) |
| Regulatory ambiguity for CRISPR products | −0.4% | Emerging markets | Medium term (2-4 years) |
| Source: Mordor Intelligence | |||
High cost of curative therapies
List prices above USD 2 million constrain immediate uptake, prompting insurers to demand long-horizon cost-effectiveness analyses[2]Anthem, “Gene Therapy for Beta Thalassemia,” anthem.com. In several EU states, pay-for-performance models defer 70% of payment until patients remain transfusion-free for two years. Low-income settings negotiate deep discounts but still face supply-chain mark-ups tied to cold-storage logistics. Manufacturer assistance programs mitigate some patient liability yet are limited by budget caps. Until biosimilar or allogeneic off-the-shelf options emerge, sticker shock will temper the upward curve of the hemoglobinopathies treatment market.
Donor-match scarcity for stem-cell transplantation
Only 20–25% of eligible sickle cell patients locate an HLA-matched sibling donor, with the lowest match rates among individuals of African descent[3]Hassan Hammad & Rajput Sheerien, “Blood Pharming: In-Vitro Red Blood Cells,” frontiersin.org. Haploidentical grafts expand eligibility but introduce higher graft-versus-host-disease risk and conditioning toxicity. The International Hemoglobinopathy Research Network’s 45-country GWAS aims to refine eligibility criteria and potentially relax strict HLA thresholds. Meanwhile, autologous gene-editing approaches sidestep donor constraints, redirecting transplant candidates into the gene-therapy funnel and partly offsetting the restraint on the hemoglobinopathies treatment market.
*Our forecasts treat driver/restraint impacts as directional, not additive. The impact forecasts reflect baseline growth, mix effects, and variable interactions.
Hemoglobinopathies Treatment Market Segment Analysis
By Treatment:
Gene therapy disrupts traditional care modelsThe hemoglobinopathies treatment market size for gene therapy is projected to rise at a 19.06% CAGR, whereas blood transfusion maintains a 37.89% share in 2025. Regulatory wins for CRISPR-based products validate one-time curative economics and ignite global pipeline investment. Vertex-CRISPR Therapeutics intend to scale vector capacity by three times to meet US and EU demand waves. Stem-cell transplantation remains curative but is limited by donor availability and graft-versus-host risks, preserving a role for gene-edited autologous options.
Pharmacological disease-modifiers such as voxelotor and crizanlizumab preserve value in regions where reimbursement for gene therapy lags. Iron chelation therapy, indispensable for transfusion-dependent thalassemia, grows steadily alongside decentralized transfusion networks. Emerging base-editing candidates from CorrectSequence illustrate the geographic broadening of innovation as China and Singapore accelerate trial approvals. Overall, treatment-mix evolution favors technologies offering durable benefit, positioning curative platforms as the primary driver of qualitative change in the hemoglobinopathies treatment market.


By Application:
Sickle cell dominance faces thalassemia growthSickle cell disease controls 48.03% of hemoglobinopathies treatment market share in 2025 and benefits from decades of standardized care pathways in North America and Europe. Nonetheless, thalassemia’s 10.73% CAGR leads the application set, propelled by Mediterranean and South-East Asian screening mandates that convert latent carriers into managed patients. Luspatercept trials for alpha-thalassemia HbH disease highlight ongoing therapeutic diversification beyond transfusion reliance. The Thalassemia International Federation’s digital patient registry improves adherence monitoring and underpins payer negotiations for high-cost therapies. Rare variants, including hemoglobin E disorders, gain visibility through next-generation sequencing programs but remain commercialization niches. With distinct epidemiological footprints, application growth vectors hinge on regional policy implementation and culturally tailored outreach, reinforcing divergent yet complementary flows within the hemoglobinopathies treatment market.
By Route of Administration:
Parenteral dominance reflects complexityParenteral delivery retained 49.81% revenue share in 2025 as gene therapies, biologics, and exchange transfusions all rely on intravenous access. Subcutaneous innovation lowers clinic burden: Sanofi’s once-monthly fitusiran regimen in hemophilia suggests similar possibilities for anti-P-selectin antibodies in vaso-occlusive-crisis prevention. Oral hydroxyurea and chelators support chronic management but face adherence hurdles tied to gastrointestinal tolerability. Home-infusion models trialed in Germany reduce hospital days by 15% for stable transfusion-dependent adults, signaling future shift of routine care into community settings. Cold-chain resilience remains a gating factor for wider biologic adoption in tropical climates. Across the hemoglobinopathies treatment market, administration-route diversification aims to balance efficacy, safety, and patient convenience without compromising clinical oversight.
By End User:
Specialty clinics emerge as growth leadersHospitals delivered 64.23% of 2025 revenues, yet specialty clinics will rise at 9.54% CAGR as gene-therapy centers of excellence proliferate. The United Kingdom’s USD 1.9 million investment in apheresis machines across 22 National Health Service trusts exemplifies infrastructure targeting higher procedure volumes. Multidisciplinary clinics integrate hematologists, genetic counselors, and psychosocial support, enhancing adherence and outcome tracking. Academic institutes remain pivotal in early-phase trials, while home-health providers pilot remote chelation management using IoT pumps. As payer contracts transition to value-based metrics, stakeholder alignment around integrated clinics is set to lift quality-adjusted life-year performance, steering incremental revenue to the specialty segment of the hemoglobinopathies treatment market.
Geography Analysis
North America and Europe Hemoglobinopathies Treatment Market
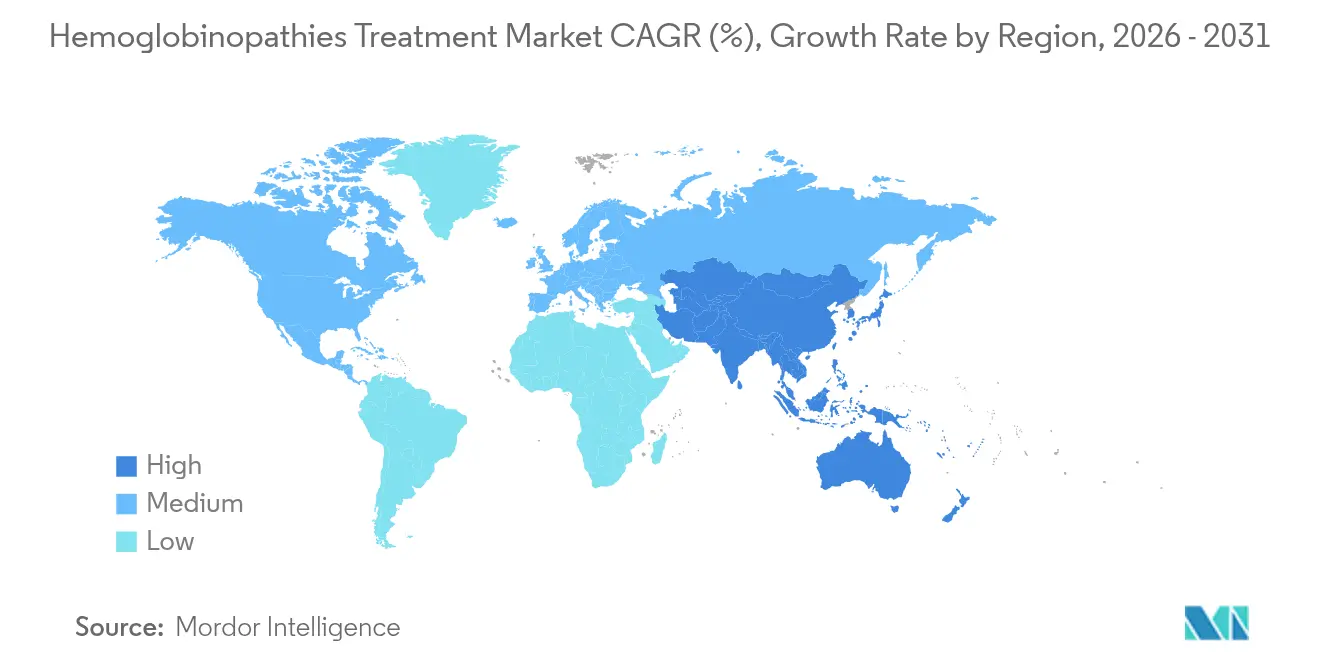
North America leads the hemoglobinopathies treatment market size with 34.92% share in 2025, benefiting from robust insurance coverage and early adoption of FDA-approved curative options. Gene-therapy infusion centers have doubled since 2023, and outcome-based reimbursement pilots underpin continued premium pricing. Europe follows, leveraging EMA regulatory cohesion and public health systems that swiftly incorporated CASGEVY into rare-disease formularies. Pan-EU joint procurement discussions aim to secure bulk-buy discounts, potentially widening hospital adoption while preserving manufacturer margins.
APAC Hemoglobinopathies Treatment Market
Asia-Pacific will post the fastest 9.43% CAGR through 2031, driven by high carrier prevalence in India, Thailand, and southern China. India’s National Health Mission funds state-level newborn screening which, coupled with public-private partnerships, funnels newly diagnosed infants into treatment pipelines. China’s National Medical Products Administration granted priority review to domestic base-editing therapies, signaling policy support for indigenous innovation and import alternatives. Southeast Asian nations expand thalassemia day-care units, concentrating transfusion services and accelerating chelation sales. Collectively these initiatives elevate both volume and complexity of care, amplifying regional influence on global supply-chain planning for the hemoglobinopathies treatment market.
MEA and South America Hemoglobinopathies Treatment Market
Middle East & Africa face infrastructural gaps: Nigeria’s national sickle-cell policy sets ambitious targets, yet cold-chain deficits limit biologic penetration. Pilot decentralized transfusion hubs in Ghana cut rural travel times by 40%, indicating scalable blueprints for broader implementation. South America maintains moderate growth; Brazil’s rare-disease ordinance and inclusion of hydroxyurea in the national formulary stimulate steady demand. Across regions, heterogeneity in healthcare financing, genetic prevalence, and technology adoption will continue to shape disparate yet interlinked trajectories for the hemoglobinopathies treatment market.

Regulatory Landscape
Regulatory oversight for hemoglobinopathies is increasingly shaped by gene-editing and gene-addition approvals, along with post-market safety surveillance. In the United States, FDA approvals for CASGEVY and LYFGENIA across late 2023 to early 2024 set a reference pathway for autologous cell-based gene therapies in sickle cell disease and transfusion-dependent beta thalassemia, and in July 2026 the FDA approved expanded use of CASGEVY for patients aged 2 years and older for these indications. The expansion broadens the labeled pediatric population and increases the importance of long-term follow-up requirements.
In Europe, regulators tightened scrutiny on benefit-risk monitoring for chronic pharmacologic agents, highlighted by EMA CHMP recommending the suspension of Oxbryta in September 2024 based on emerging safety signals, followed by a European Commission legally binding decision confirming EU-wide suspension in December 2025. Payer and coverage frameworks are also becoming more closely tied to regulation for high-cost curative therapies, such as the CMS Cell and Gene Therapy Access Model initiated in January 2025 for sickle cell disease. At the country level, national guidelines and programs, including India (National Health Mission operational guidance) and Nigeria (Federal Ministry of Health national guideline issued in 2025), are standardizing screening and care pathways that affect diagnosis rates and treatment initiation.
Competitive Landscape
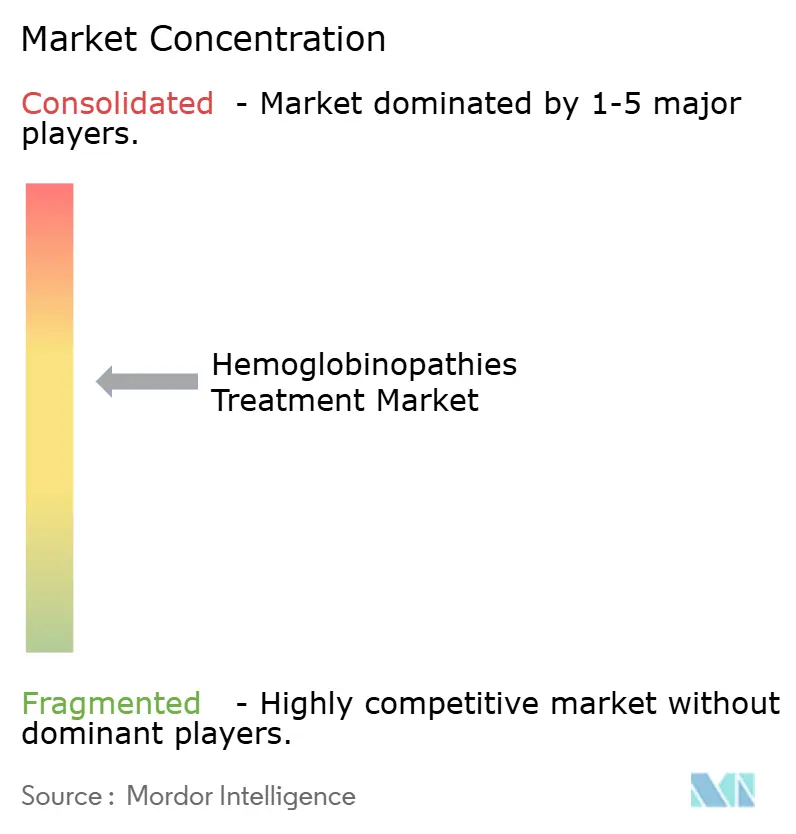
The hemoglobinopathies treatment industry comprises legacy pharma, niche biotech, and emerging gene-editing start-ups, yielding moderate fragmentation. Novartis markets hydroxyurea and voxelotor while reinvesting profits into CRISPR alliances. Bluebird bio and Vertex leverage proprietary lentiviral and CRISPR platforms, respectively, positioning themselves as category leaders in curative therapy. Sanofi’s pipeline integrates mRNA-based silencers targeting erythroid maturation regulators, illustrating incumbent diversification beyond small-molecule franchises.
Strategic partnerships proliferate: CSL Behring collaborates with Apellis on complement pathway inhibitors to mitigate transfusion side-effects, and Pfizer co-funds AI-powered diagnostic ventures to capture upstream patient identification. Geographic expansion remains a core tactic; Chinese biotech CorrectSequence partners with Singaporean hospitals to accelerate regional pivotal trials. Manufacturing scalability constitutes a major differentiator: companies owning in-house vector capacity secure shorter turnaround times, an advantage under high-demand scenarios.
Competitive intensity is heightened by payer scrutiny of cost-effectiveness. Firms thus emphasize long-term transfusion independence data and real-world evidence repositories to strengthen value propositions. As curative therapies gain traction, follow-on products face higher efficacy benchmarks, leading to a consolidation wave where capital-rich pharmas acquire late-stage start-ups. Overall, technology leadership, manufacturing agility, and payer engagement will separate winners and laggards within the hemoglobinopathies treatment market.
Hemoglobinopathies Treatment Industry Leaders
Sanofi SA
Novartis AG
Pfizer Inc.
bluebird bio
CSL Behring
- *Disclaimer: Major Players sorted in no particular order
Hemoglobinopathies Treatment Market Companies Covered in this Report
- Sanofi
- Novartis
- Pfizer
- bluebird bio
- Vertex Pharmaceuticals
- CRISPR Therapeutic
- Sangamo Therapeutics
- Gamida Cell
- Emmaus Life Sciences
- CSL Behring
- Agios Pharmaceuticals
- Editas Medicine
- Intellia Therapeutics
- Rocket Pharmaceuticals
- Acceleron Pharma
- Silence Therapeutics
- Vifor Pharma
- Bioverativ (Genzyme unit)

Market Opportunities and Future Outlook
The opportunity set is expanding around earlier eligibility and higher throughput for curative therapies as regulators broaden labels and health systems formalize access models. The July 2026 FDA label expansion for CASGEVY to patients aged 2 years and older in sickle cell disease and transfusion-dependent beta thalassemia increases the addressable pediatric pool and puts additional emphasis on scaling apheresis, cell processing, and longitudinal monitoring capacity across hospitals and specialty clinics. At the same time, reimbursement structures are shifting from one-time billing toward outcome-linked arrangements, anchored by the CMS Cell and Gene Therapy Access Model launched in 2025, which provides a clearer contracting template for manufacturers and Medicaid programs and supports broader multi-state participation in outcomes-based agreements.
R&D whitespace is concentrated on reducing institutional burden and toxicity that constrain global adoption of ex vivo autologous gene therapies. Trial activity remains active, including NCT06647979 (Phase 1 BCL11A enhancer gene editing in HSPCs for severe sickle cell disease or beta-thalassemia), with recruitment initiated in December 2025. In 2026 academic assessments, the gene-editing trial landscape is described as prioritizing non-genotoxic conditioning and in vivo delivery approaches to simplify administration and expand center eligibility. These technical priorities map to needs in high-burden regions where cold-chain, transplant infrastructure, and specialist availability limit uptake, creating room for platforms that shorten vein-to-vein timelines, reduce chemotherapy dependence, and support decentralized diagnostic-to-referral pathways.
Recent Industry Developments in Hemoglobinopathies Treatment Market
- July 2026: The US FDA approved expanded use of Vertex and CRISPR Therapeutics' CASGEVY (exagamglogene autotemcel) to include patients aged 2 years and older with sickle cell disease or transfusion-dependent beta thalassemia. The broader label increases the pediatric addressable pool and raises near-term pressure on certified centers to expand apheresis, cell processing, and long-term follow-up capacity.
- June 2025: Sanofi reported that the US FDA granted orphan drug designation to rilzabrutinib for sickle cell disease, positioning the oral BTK inhibitor as an inflammation-focused option aimed at reducing vaso-occlusive crises. The designation strengthens the programs' regulatory profile and supports continued clinical development and partnering interest in non-curative disease modifiers that can be deployed outside specialized gene-therapy centers.
- May 2024: bluebird bio announced completion of the first commercial cell collection for LYFGENIA (lovotibeglogene autotemcel) in sickle cell disease. The milestone signaled operational readiness for routine apheresis and chain-of-custody workflows, reinforcing the importance of scalable cell-collection networks for commercial gene-therapy delivery.


Hemoglobinopathies Treatment Market Report Scope and Research Methodology
Market Definition and Coverage
For this study, the hemoglobinopathies treatment market is defined as revenues from therapies and care pathways used to manage inherited hemoglobin disorders in clinical settings, including drug therapy, transfusion-related care, iron overload management, and curative approaches where applicable.
Scope exclusions: Diagnostic-only testing products, screening programs as standalone services, and general blood banking operations not directly tied to patient treatment were excluded.
Segments Covered in This Report
- By Treatment
- Stem Cell Transplantation
- Blood Transfusion
- Iron Chelation Therapy
- Pharmacological Agents
- Gene Therapy
- Other Supportive Treatments
- By Application
- Thalassemia
- Sickle Cell Disease
- Other Hemoglobinopathies
- By Route of Administration
- Oral
- Parenteral
- Transfusion
- By End User
- Hospitals
- Specialty Clinics
- Academic & Research Institutes
- Others
- Geography
- North America
- United States
- Canada
- Mexico
- Europe
- Germany
- United Kingdom
- France
- Italy
- Spain
- Rest of Europe
- Asia-Pacific
- China
- Japan
- India
- South Korea
- Australia
- Rest of Asia-Pacific
- Middle East and Africa
- GCC
- South Africa
- Rest of Middle East and Africa
- South America
- Brazil
- Argentina
- Rest of South America
- North America
Data Sources, Market Sizing, and Validation
Desk Research
Desk research is used to set the disease and treatment context before values are modeled. We rely on public health and clinical references such as CDC publications, NIH and NCBI resources, WHO guidance, and peer reviewed articles indexed in PubMed to understand treated populations and care pathways.
To align the model with real world access and utilization, we also review sources such as national health statistics portals, hospital and payer policy documents where available, and customs or trade summaries for relevant blood products and consumables. Company filings, investor presentations, and reputable press releases help confirm therapy launches, label expansions, and pricing direction. In addition, we use paid subscriptions focused on company financials and intelligence, and also patent databases to track innovation signals. These sources are illustrative and not exhaustive, and other references are used for data collection, cross checks, and clarification.
Primary Interviews and Surveys
Primary work is used to validate uptake and pricing logic where public data is thin, especially across thalassemia and sickle cell care settings. We speak with a mix of clinicians, hospital pharmacy and procurement teams, payers, distributors, and industry participants across the Americas, EMEA, and APAC, so assumptions can be pressure tested against local patient access realities and care pathway differences.
Distribution of primary research fieldwork respondents
| Company type | Respondent position | Region |
|---|---|---|
| Top tier: 33% | CXOs: 16% | APAC: 44% |
| Mid tier: 51% | Functional/Unit leaders: 26% | EMEA: 29% |
| Smaller Players: 16% | Managers: 58% | Americas: 27% |
Market-Sizing & Forecasting
Sizing starts with a top-down build where epidemiology and treated-pool assumptions are combined with care pathway splits to reconstruct demand. We then convert this demand into value using therapy mix and typical annual cost ranges. Since access varies by region, we layer practical filters such as diagnosis and screening penetration, treatment eligibility, transfusion frequency patterns, and adherence to iron chelation protocols.
To keep totals grounded, we corroborate with selective bottom-up checks, including sampled price points by therapy class and volume signals from hospital channel discussions, then adjust where gaps appear. Where therapy level volumes cannot be directly observed, we use conservative ranges and then narrow them using interview feedback on switching, persistence, and reimbursement constraints. Forecasts are built using scenario analysis tied to inputs such as therapy approvals and label changes, expected price evolution, and expansion of specialty center capacity, and the scenarios are aligned to timing that respondents consider realistic.
Data Validation & Update Cycle
Outputs are checked against independent signals, including regional treatment access indicators, published prevalence references, and consistency with the implied spend per treated patient. Variances are reviewed in steps, first revisiting assumptions and then replacing or reweighting inputs if they look outdated or inconsistent.
If a key input shifts materially, such as a reimbursement change, a safety warning, or a major launch affecting utilization, we re-contact relevant respondents to confirm direction and magnitude. Reports are refreshed annually, and interim updates are made when events can move the market meaningfully. Before delivery, a final analyst pass is completed so the view reflects the latest available information.
Mordor Intelligence's Hemoglobinopathies Treatment Market Size Versus Other Published Estimates
Published market sizes for hemoglobinopathies treatments often differ because the market boundary is not always consistent. Some estimates blend treatment revenues with adjacent services. Differences also show up when the base year is not the same, when pricing is assumed to rise faster than reimbursement allows, or when uptake of gene therapy is modeled as faster than specialist capacity can support.
The table shows a clear spread versus other published figures. In Mordor Intelligence's model, values are tied to treatment revenues across key modalities (including transfusion care and iron chelation) and then validated with treated-pool logic and region-specific access checks. Some external estimates rely more on broad service definitions or older base-year assumptions.
Benchmark comparison
| Source | Market Size | Gaps in Research Methodology |
|---|---|---|
| Mordor Intelligence | USD 11.45 B (2026) | |
| Trade Publisher A | USD 9.85 B (2025) | Uses an earlier base year and a factory-gate framing that can understate downstream treatment delivery economics, and it may not fully separate treated access limitations by region when projecting near-term uptake. |
| Industry Publisher B | USD 7.01 B (2025) | Starts from a lower 2025 base and applies a longer horizon with a more conservative treated-population build, and it can miss near-term shifts in therapy mix and price progression across hospital and specialty clinic settings. |
Taken together, the gap is mainly explained by scope alignment and how treated demand is converted into value. By linking spend to treated cohorts, therapy mix, and practical access constraints, the approach stays traceable to inputs that a reader can follow and re-check over time.


Key Questions Answered in the Report
What is the current size of the hemoglobinopathies treatment market?
The hemoglobinopathies treatment market size reached USD 11.45 billion in 2026 and is projected to hit USD 16.72 billion by 2031.
Which treatment segment is growing the fastest?
Gene therapy is the fastest-growing segment, forecast to expand at a 19.06% CAGR through 2031 thanks to recent CRISPR-based approvals.
Why is Asia–Pacific the most rapidly expanding region?
Asia-Pacific’s 9.43% CAGR stems from government-funded newborn screening, high carrier prevalence, and rising reimbursement support for advanced therapies.
How do high therapy costs affect market growth?
Prices exceeding USD 2 million per patient slow adoption in middle-income nations, moderating the global CAGR by an estimated 1.8 percentage points.
What role do specialty clinics play in future care delivery?
Specialty clinics combine multidisciplinary expertise and dedicated infrastructure, enabling them to deliver complex gene-therapy protocols and achieve the segment’s leading 9.54% CAGR.
Page last updated on:


 Your data is secure and never sold or shared.


