
Hemodialysis Market Size and Share
Market Overview
| Study Period | 2020 - 2031 |
|---|---|
| Market Size (2026) | USD 38.94 Billion |
| Market Size (2031) | USD 49.37 Billion |
| Growth Rate (2026 - 2031) | 4.86 % |
| Fastest Growing Market | Asia Pacific |
| Largest Market | North America |
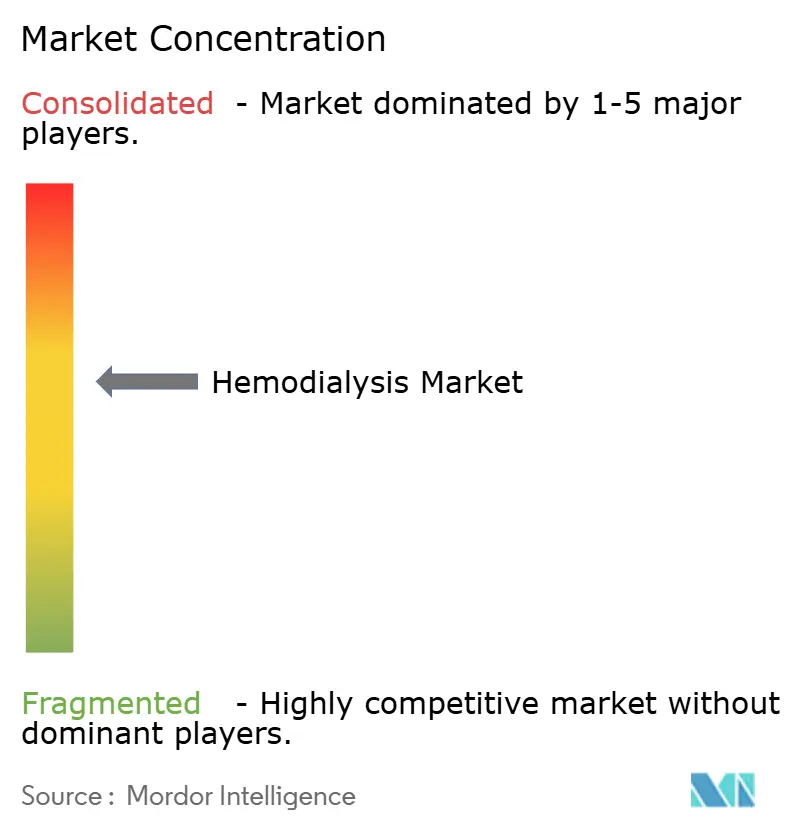
| Market Concentration | Medium |
Major Players *Disclaimer: Major Players sorted in no particular order Image © Mordor Intelligence. Reuse requires attribution under CC BY 4.0. | |
Hemodialysis Market Analysis by Mordor Intelligence
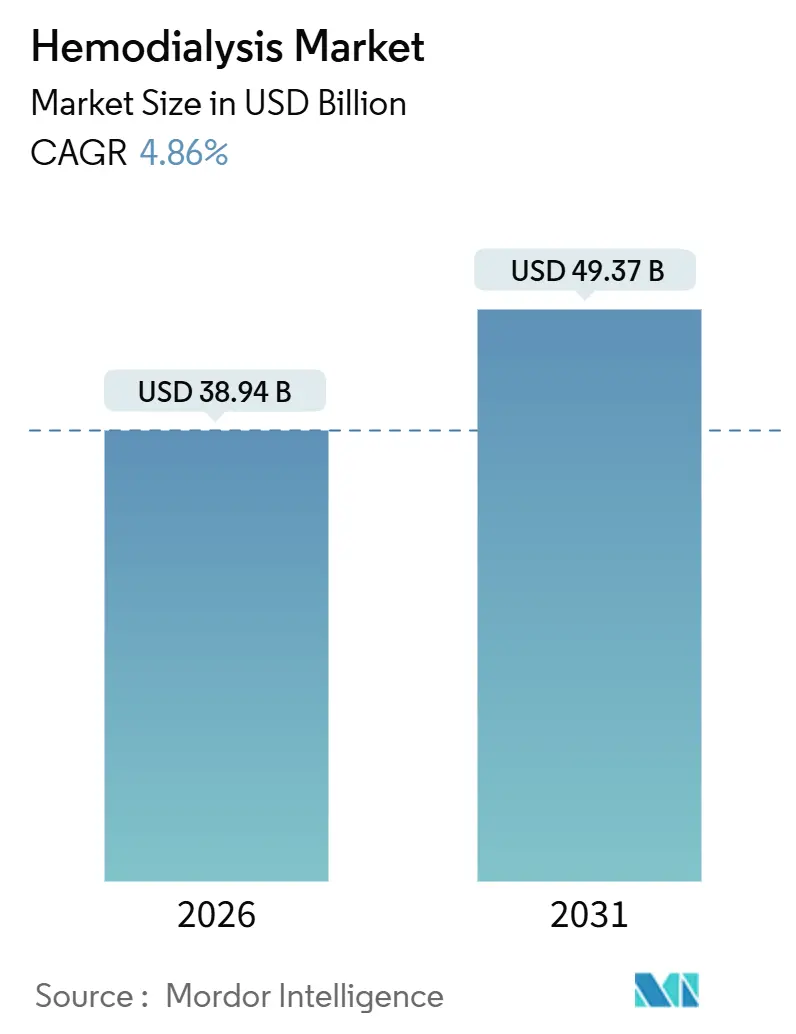
The Hemodialysis Market size is estimated at USD 38.94 billion in 2026, and is expected to reach USD 49.37 billion by 2031, at a CAGR of 4.86% during the forecast period (2026-2031).
Steady prevalence growth of end-stage renal disease, stronger reimbursement incentives for home care, and continual equipment-plus-consumable business models are the primary forces sustaining revenue expansion. Multinational providers are deepening localization programs in Asia to offset price pressure from emerging Chinese vendors. At the same time, integrated tele-nephrology systems that feed real-time patient data to clinicians are cutting emergency admissions, proving the business case for digital add-ons. Heightened regulatory attention on water efficiency and breakthrough portable-kidney devices remains a long-horizon risk, but recurring consumables demand still secures predictable cash flows for investors.
Key Report Takeaways
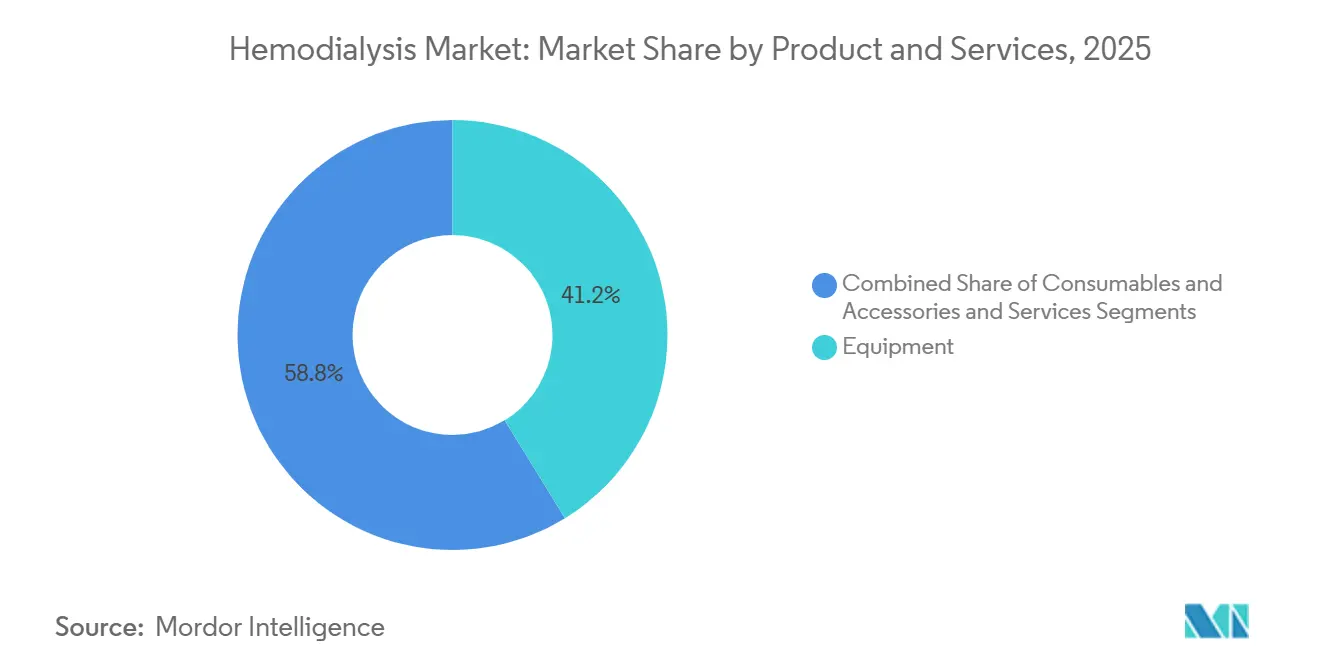
- By products and services, equipment led with a 41.24% revenue share in 2025; consumables and accessories are forecast to expand at an 8.34% CAGR through 2031.
- By modality, conventional long-hour treatments captured 64.55% of volumes in 2025, while short daily sessions are advancing at a 7.46% CAGR to 2031.
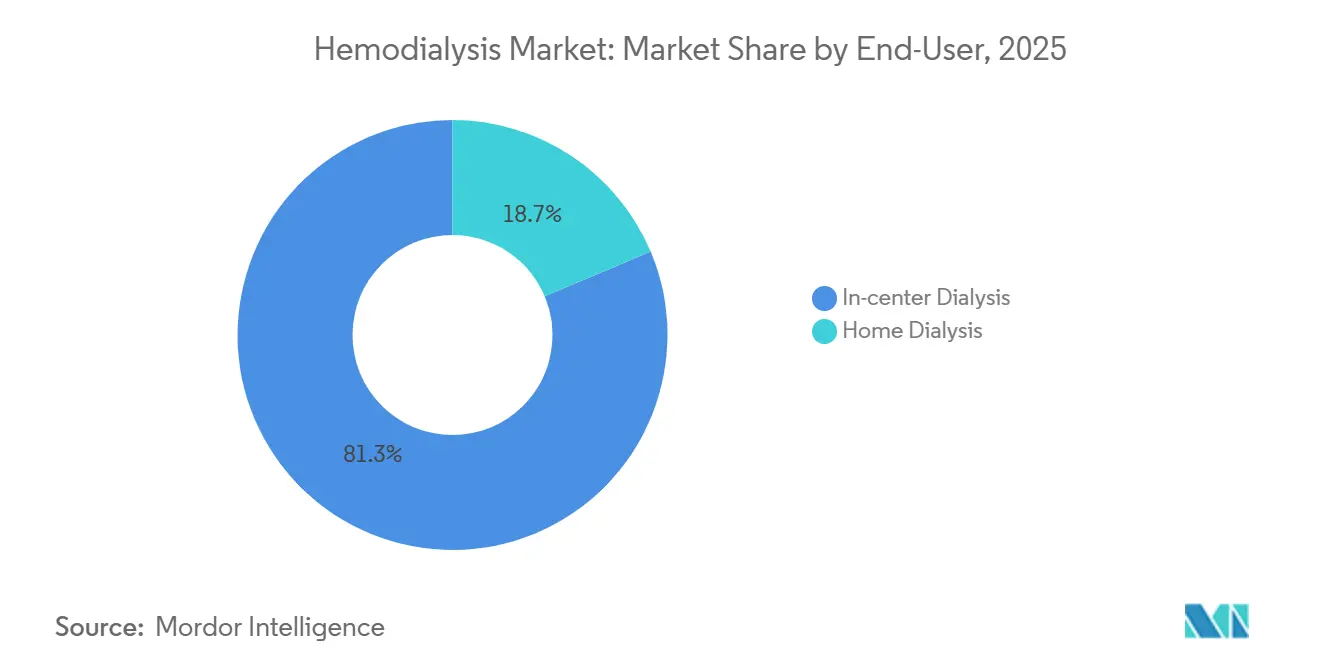
- By end user, in-center dialysis accounted for 81.34% of the hemodialysis market share in 2025; home dialysis is projected to grow at a 6.37% CAGR over the same period.
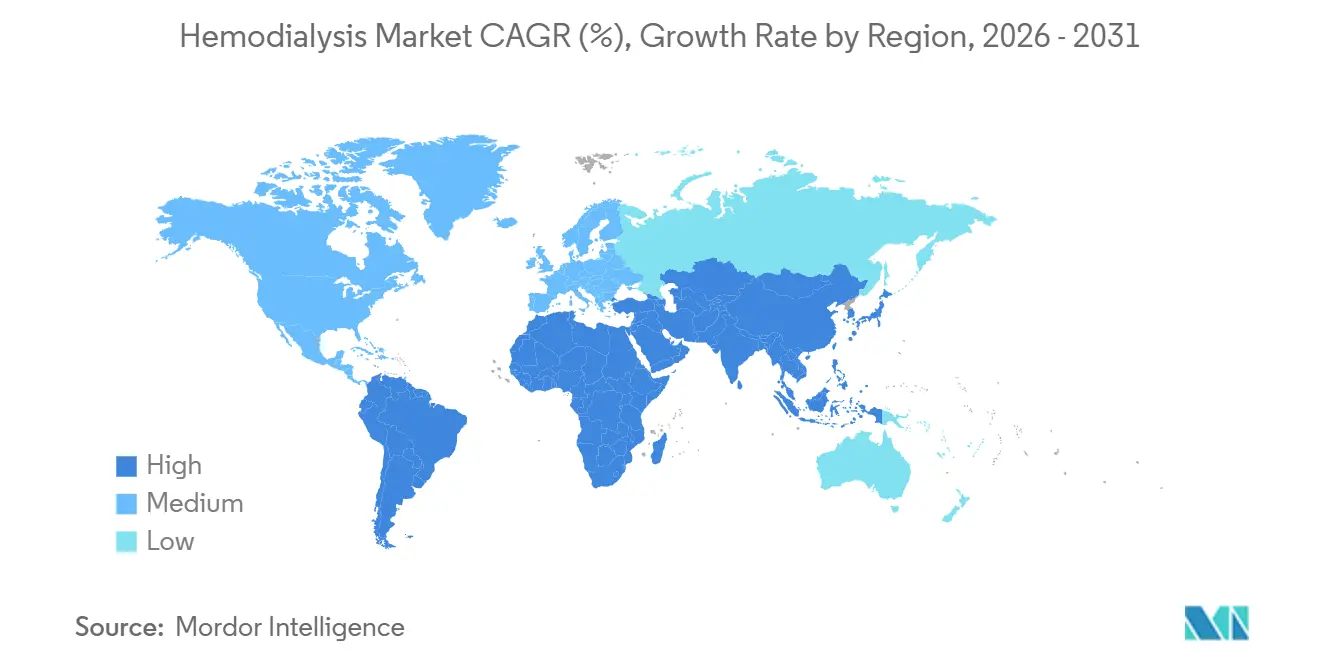
- By geography, North America contributed 38.54% of 2025 revenue, whereas Asia-Pacific is set to register the fastest 7.02% CAGR to 2031.
Note: Market size and forecast figures in this report are generated using Mordor Intelligence’s proprietary estimation framework, updated with the latest available data and insights as of January 2026.
Market Trends and Insights
Drivers Impact Analysis of Hemodialysis Market*
| Driver | (~) % Impact on CAGR Forecast | Geographic Relevance | Impact Timeline |
|---|---|---|---|
| Rising global prevalence of end-stage renal disease | +1.2% | North America, Asia-Pacific | Long term (≥ 4 years) |
| Growing adoption of home hemodialysis | +0.9% | North America, Australia, select EU markets | Medium term (2-4 years) |
| Reimbursement expansions in major markets | +0.8% | United States, Germany, Japan, South Korea | Short term (≤ 2 years) |
| Technological innovations in high-flux dialyzers | +0.7% | Global | Medium term (2-4 years) |
| Integration of tele-nephrology monitoring | +0.6% | North America, Western Europe, urban Asia-Pacific | Short term (≤ 2 years) |
| Public-private dialysis roll-outs in LMICs | +0.5% | India, Indonesia, Philippines, Sub-Saharan Africa | Long term (≥ 4 years) |
| Source: Mordor Intelligence | |||
Rising Global ESRD Prevalence
Global dialysis incidence keeps rising, exemplified by 130,754 new U.S. patients in 2024 and Japan’s total pool exceeding 350,000 by 2025. Diabetes and hypertension explain most cases, yet chronic kidney disease of unknown etiology in agricultural belts of Central America and South Asia is accelerating demand.[2] Rural expansion programs, such as China’s USD 1.2 billion county-level build-out, widen the addressable base. Because ESRD is non-elective, these demographics underpin secular volume growth that insulates the hemodialysis market from economic cycles. As incidence rises, providers must scale staff and infrastructure, cementing equipment and consumable pull-through.
Growing Adoption of Home Hemodialysis
Home penetration reached 12.8% of U.S. dialysis patients by mid-2025, buoyed by Medicare incentives that reward nephrologists for prescribing home therapy.[3] Systems like Outset Medical’s Tablo remove separate water-treatment needs, slashing setup costs by 40%. Australia leads OECD peers with 22% of new patients starting at home thanks to 85% equipment subsidies and caregiver training mandates. Workforce shortages—nephrology nurse vacancy rates stood at 18% in 2025—push stakeholders toward self-care pathways. Coupled with user-friendly interfaces and remote troubleshooting, home programs are positioned to win younger, working-age cohorts.
Reimbursement Expansions in Major Markets
The 2025 Medicare fee schedule lifted the bundled payment for home dialysis by 4.7%, narrowing the differential with clinic sessions. Germany’s G-BA added a new code for tele-nephrology visits, trimming mandatory in-person checks to quarterly. Japan passed its first dialysis tariff increase in four years, easing capital upgrade burdens on public centers. South Korea extended high-flux dialyzer coverage to all residual-function patients, enlarging the eligible cohort by 28,000. These policy moves safeguard provider margins and affirm dialysis as essential healthcare, accelerating the hemodialysis market’s revenue certainty.
Technological Innovations in High-Flux Dialyzers
High-flux membranes represented 61% of global shipments in 2025, up from 54% two years earlier. Asahi Kasei’s APS-EA dialyzer cuts dialysis-related amyloidosis by 22% through superior β-2 microglobulin removal. Nipro’s hydrophilic-coated FIX series extends reuse cycles to 18 sessions, trimming per-treatment costs by USD 3.50. Cardiovascular mortality benefits associated with middle-molecule clearance strengthen payer appetite for such upgrades. Providers therefore accept a 15% price premium, reinforcing equipment makers’ shift toward outcome-oriented product positioning.
Restraints Impact Analysis of Hemodialysis Market*
| Restraint | (~) % Impact on CAGR Forecast | Geographic Relevance | Impact Timeline |
|---|---|---|---|
| High treatment costs versus peritoneal dialysis | -0.6% | Global, especially cost-sensitive LMICs | Medium term (2-4 years) |
| Vascular-access infections and complications | -0.5% | North America, Europe | Short term (≤ 2 years) |
| Emerging wearable artificial-kidney substitutes | -0.3% | North America, Western Europe | Long term (≥ 4 years) |
| Water-scarcity regulations on ultrapure water | -0.2% | Middle East, North Africa, Western United States | Medium term (2-4 years) |
| Source: Mordor Intelligence | |||
High Treatment Costs Versus Peritoneal Dialysis
Annual in-center hemodialysis spending averages USD 89,000 in the United States versus USD 62,000 for peritoneal dialysis, prompting PD-first mandates in Canada, the U.K., and Australia. Hong Kong achieved 78% PD initiation in 2025 by paying nephrologists a premium for PD oversight. Escalating nurse pay—up 8.2% annually from 2023-25—amplifies this cost gap. While hemodialysis remains vital for patients unable to handle PD logistics, value-based purchasing schemes highlight its relative expense, moderating uptake in some health systems.
Vascular-Access Infections and Complications
Central venous catheter infections generate 18% of all dialysis hospitalizations, costing USD 22,000 per episode and extending stay by up to 10 days. U.S. infection rates have not improved since 2023 despite stricter protocols. AV fistula maturation failure persists at 25-30% among elderly diabetics. Medtronic’s antibiotic-eluting graft lowers infection risk but carries a USD 1,200 premium, limiting uptake. These complications reduce patient quality of life and raise payer outlays, tempering enthusiasm for hemodialysis in risk-sharing reimbursement models.
*Our forecasts treat driver/restraint impacts as directional, not additive. The impact forecasts reflect baseline growth, mix effects, and variable interactions.
Hemodialysis Market Segment Analysis
By Products and Services:
Recurring Consumables Drive GrowthConsumables and accessories are projected to expand at an 8.34% CAGR to 2031, surpassing equipment’s 41.24% share in the hemodialysis market as of 2025. Razor-and-blade strategies, such as Nikkiso’s USD 500 monthly subscription machine, bundle bloodlines, concentrates, and service into one predictable fee. Global shipments of bloodlines and tubing surpassed 1.2 billion units in 2025, reflecting their single-use necessity.
High-flux therapy protocols raise bicarbonate-dialysate demand, adding USD 3 per treatment in concentrate revenue. Antimicrobial-coated catheters captured 22% of the North American subsector, demonstrating clinicians' willingness to invest in infection mitigation. Services, from maintenance to on-site water-system management, grow 5.2% annually as independent clinics outsource biomedical engineering tasks. This consumables-heavy mix insulates the hemodialysis market size from capital-budget cycles while anchoring manufacturers to patient retention metrics.

By Modality:
Short Daily Sessions Improve Workforce ProductivityConventional thrice-weekly schedules still dominate with 64.55% of 2025 volume, yet short daily hemodialysis is climbing at a 7.46% CAGR, powered by employer clinics that cut absenteeism by 22 days per year. Meta-analysis shows 16% fewer cardiovascular events with the 5-6-day regimen, supporting payer coverage. Retail giants like Amazon host on-site units, signaling broader corporate health adoption. Fresenius shipped 18,000 NxStage System One devices in 2025, indicating convergence between short daily and home settings. Meanwhile, nocturnal therapy holds only 4.2% share due to patient reluctance and staffing hurdles. As outcome-based payment expands, short daily options are poised to capture incremental hemodialysis market share alongside home platforms.
By End User:
Home Dialysis Gains on Policy ParityIn-center facilities represented 81.34% of 2025 sessions, but reimbursement parity is lifting home uptake at a 6.37% CAGR through 2031. The ETC Model pushed participant practices to 13.2% home prevalence in 2025, up from 8.9% in 2022. Outset Medical’s dual-setting Tablo allows seamless migration, easing training costs and CAPEX risk. Hospital divestitures—47 U.S. units closed in 2024—are sending volumes to specialized clinic chains. Rural mobile units funded by FEMA keep growth steady in underserved zones. Australia tops peers at 22% home penetration owing to subsidies, whereas Japan lags below 3% due to cultural preferences and limited tariffs. Infection-avoidance remains a post-pandemic driver cited by 38% of surveyed home patients. As digital monitoring narrows the clinical-outcome gap, payers increasingly endorse home pathways that lower long-term costs and expand the hemodialysis market size for remote-capable devices.
Geography Analysis
North America Hemodialysis Market
North America contributed 38.54% of 2025 revenue, anchored by Medicare’s USD 240 per-session clinic payment and a 550,000-patient base. Incident ESRD growth slowed to 1.8% in 2024, yet mortality fell to 16.2%, reflecting cardiovascular-care improvements. Canada’s British Columbia achieved 28% home penetration via compulsory education and nephrologist bonuses. Mexico’s Seguro Popular now funds twice-weekly treatments, adding 18,000 slots by 2027.
Europe Hemodialysis Market
Europe captured 29% of global revenue, led by Germany’s 1,350 per-million prevalence under generous tariffs. France’s pre-emptive transplant rate hit 18%, tempering volume growth but improving outcomes. The U.K. mandate that suitable patients start at home lifted national home prevalence to 19% in 2025. Spain and Italy leverage European Investment Bank financing to modernize rural centers.
APAC Hemodialysis Market
Asia-Pacific is the fastest-growing segment at a 7.02% CAGR, propelled by China’s 820,000-patient population yet low 570 per-million penetration. India expanded district-hospital dialysis to 680 sites through public-private concessions. Japan recorded its first dialysis decline, down 0.8% in 2025 after aggressive CKD screening. Tele-nephrology deployments in South Korea and Australia reduce hospitalizations by 14% among 12,000 monitored home patients.
MEA Hemodialysis Market
The Middle East and Africa held 6.2% of revenue, with Saudi Arabia’s Vision 2030 expanding capacity to 42,000 patients in 2025. UAE water mandates force centers to install recycling systems, raising CAPEX yet improving efficiency. Solar-powered pilots in Kenya lower energy costs by 30%, offering a blueprint for rural Sub-Saharan Africa.
South America Hemodialysis Market
South America made up 4.8% of revenue, dominated by Brazil’s 144,000 publicly funded patients under SUS despite tariff stagnation since 2018. Argentina’s currency pressures triggered operator exits in 2025, whereas Chile’s 12% tariff hike revived investment. Colombia opened 35 rural centers in 2024 through municipal programs.
Regulatory Landscape
Hemodialysis equipment is regulated as medical devices in major markets. In the United States, classification and controls are defined under FDA device regulations, including 21 CFR Part 876 for relevant device categories, with manufacturers implementing the FDA Quality Management System Regulation (QMSR) changes effective February 2026 to align with ISO 13485 style design, production, and post-market controls, particularly for connected dialysis platforms and safety-critical extracorporeal therapy devices.
In Europe, MDR compliance continues to elevate technical documentation, clinical evidence, labeling, and vigilance requirements, with the European Commission Implementing Decision EU 2026/1231 adopted in June 2026. Early 2026 updates on EUDAMED modules influence registrations and post-market reporting by manufacturers and authorized representatives. For core disposables, ISO 8637-1:2024 published in 2024 provides updated benchmarks that inform documentation refreshes for dialyzer product lines.
Value Chain Analysis
The hemodialysis value chain spans upstream polymer inputs, membranes, and precision components, followed by sterile manufacturing of single-use consumables (dialyzers, bloodlines, concentrates) and logistics to hospital and clinic purchasing channels. The market remains consumables-led, with high-volume items like bloodlines anchoring revenue, while OEM service, water treatment, and clinic biomedical maintenance contribute recurring revenue. Vertical integration around key membrane components remains a strategic lever for supply assurance.
Recent supply-chain events underline ecosystem sensitivity. In March 2025, the FDA added hemodialysis bloodlines to its Medical Device Shortages List following production and labor constraints. In April 2026, regional reporting in Southeast Asia highlighted distributor concerns about dialyzer availability amid shipping delays and elevated freight costs. Downstream, providers and OEMs are integrating hardware with digital infrastructure to streamline prescription management and remote monitoring; for example Fresenius Medical Care reported in May 2026 that its 5008X CAREsystem was operating in about 100 US clinics with more than 100,000 treatments performed, illustrating how platforms, training, and IT integration influence installed-base conversion.
Competitive Landscape
Fresenius Medical Care and DaVita manage more than 8,500 global clinics, treating around 450,000 patients, yet the top five equipment suppliers hold slightly more than half of dialyzer shipments, marking medium concentration. Chinese entrants slash prices up to 30% in tender markets, pushing incumbents to localize and offer volume discounts. Fresenius’s 2025 AI-diagnostics acquisition strengthens its predictive-analytics edge for vascular-access risk. Outset Medical’s Tablo has already seized 18% of U.S. home-equipment sales by removing water-treatment barriers.
Digital integration is the new differentiator: Baxter’s Sharesource monitored 60,000 patients worldwide in 2025, cutting unplanned admissions by 19%. Quanta Dialysis’s SC+ earned CE Mark for disaster-response uses, nudging equipment toward portability. Wearable-kidney patent filings rose 34% across 2024-25, with Xcorporeal and the Kidney Project leading innovations that could redefine the hemodialysis market in the next decade. ISO 13485 quality standards and EU MDR compliance increase fixed-cost hurdles, advantaging established manufacturers. Private-equity roll-ups totaled USD 1.8 billion across 23 clinic deals in 2025, spotlighting the segment’s defensive cash flow.
Hemodialysis Industry Leaders
-
Asahi Kasei Corporation
-
B Braun Melsungen AG
-
Fresenius Medical Care AG & Co. KGaA
-
Baxter International Inc.
-
Nipro Corporation
- *Disclaimer: Major Players sorted in no particular order
Hemodialysis Market Companies Covered in this Report
- Allmed Medical GmbH
- Asahi Kasei Medical
- B. Braun
- Baxter
- Dialife SA
- Fresenius
- Guangdong Future Dialysis Tech.
- JMS Co., Ltd
- Kawasumi Laboratories
- Medivators Inc. (Cantel)
- Medtronic
- Nikkiso Co., Ltd.
- Nipro
- Outset Medical
- Quanta Dialysis Technologies
- Rockwell Medical
- Shanwaishan Medical Group
- SWS Hemodialysis Care Co., Ltd.
- Toray Medical Co., Ltd.
- WEGO Group
Market Opportunities and Future Outlook
Home hemodialysis enablement is a clear whitespace for device makers and service providers, with reimbursement and usability improvements translating into adoption. In the United States, home penetration reached 12.8% by mid-2025, supported by Medicare incentives and expanded parity for home pathways, while connected platforms are being commercialized to reduce clinician workload and support remote troubleshooting. Fresenius Medical Care launched kinexus globally in June 2026 as a unified digital platform for home dialysis programs, reinforcing opportunities for OEMs to monetize software-enabled monitoring, prescription workflows, and interoperability with clinic systems alongside equipment and consumables.
A second opportunity track is upgrade cycles around high-volume hemodiafiltration and related therapy enhancements in in-center settings, where device conversions require capital equipment, disposables, and IT connectivity as bundled propositions. Fresenius Medical Care reported progress on its US rollout of the 5008X CAREsystem, reaching around 100 clinics and surpassing 100,000 treatments by May 2026, showing active conversion activity and the operational playbook needed to scale. In addition, supply resilience and compliance-by-design are emerging as competitive differentiators: the FDA's March 2025 to June 2026 period of listing hemodialysis bloodlines as a shortage item and subsequent removal in June 2026 highlights demand for redundant sourcing, localized manufacturing options, and design choices that reduce dependency on constrained components, while also aligning connected devices to cybersecurity and quality-system expectations.
Recent Industry Developments in Hemodialysis Market
- May 2026: Fresenius Medical Care expanded the 5008X CAREsystem rollout to approximately 100 US clinics, surpassing 100,000 treatments. The deployment demonstrates scale and integration with clinic workflows and IT systems.
- June 2025: Nipro introduced the LiniXia reverse-osmosis pure-water dialysis system at the ERA 2025 congress in Vienna, addressing infrastructure bottlenecks for in-center dialysis expansion and modernization.
- May 2024: Baxter presented cohort study data at the ERA-EDTA Congress showing Theranova dialyzer use associated with improved outcomes and reduced mortality risk over four years.
Hemodialysis Market Report Scope and Research Methodology
Market Definition and Coverage
This market covers the value generated from hemodialysis treatment, including the key equipment used to deliver therapy, routine consumables needed per session, and service revenue earned by providers across in-center and home settings.
Scope exclusions: We exclude peritoneal dialysis, transplant medicines, and vascular grafts from this sizing.
Segments Covered in This Report
- By Products and Services
- Equipment
- Hemodialysis Machines
- Dialysate Delivery Systems
- Others
- Consumables and Accessories
- Bloodlines & Tubing Sets
- Concentrates & Solutions
- Hemostasis Devices
- Catheters & Fistula Needle
- Other consumables and accessories
- Services
- Equipment
- By Modality
- Conventional Long-hour Hemodialysis
- Short Daily Hemodialysis
- Nocturnal Hemodialysis
- By End User
- In-center Dialysis
- Hospitals
- Others
- Home Dialysis
- In-center Dialysis
- By Geography
- North America
- United States
- Canada
- Mexico
- Europe
- Germany
- France
- United Kingdom
- Italy
- Spain
- Rest of Europe
- Asia-Pacific
- China
- Japan
- India
- South Korea
- Australia
- Rest of Asia-Pacific
- Middle East & Africa
- GCC
- South Africa
- Rest of Middle East & Africa
- South America
- Brazil
- Argentina
- Rest of South America
- North America
Data Sources, Market Sizing, and Validation
Desk Research
For the starting structure of the model, we relied on public health and population data that helps explain the dialysis demand pool and how it is changing over time. Sources used include, such as, CDC kidney disease statistics, United States Renal Data System publications, World Health Organization databases, World Bank demographic indicators, and OECD health statistics for system-level checks.
To shape assumptions that are hard to see in pure public datasets, we also reviewed company annual reports, investor presentations, regulatory and reimbursement updates, and procurement and tender notices where available. In a few places, paid subscriptions were used for company financials and intelligence, patent databases, and an import export shipment-level database to cross-check device and consumable activity by region. This desk research list is not exhaustive, and many other public sources were reviewed to validate, clarify, and fill gaps in the data.
Primary Interviews and Surveys
Primary inputs came from interviews and structured surveys with dialysis center operators, hospital procurement teams, clinicians, distributors, and component suppliers who understand utilization patterns and pricing behavior. Because this is a global market, we ensured coverage across APAC, EMEA, and the Americas so we could sanity-check regional reimbursement conditions, home dialysis adoption, and equipment replacement cycles with people close to the decisions.
Distribution of primary research fieldwork respondents
| Company type | Respondent position | Region |
|---|---|---|
| Top tier: 27% | CXOs: 19% | APAC: 43% |
| Mid tier: 51% | Functional/Unit leaders: 27% | EMEA: 34% |
| Smaller Players: 22% | Managers: 54% | Americas: 23% |
Market-Sizing & Forecasting
Sizing starts with a top-down demand pool build based on treated patient counts and average annual sessions per patient, which are then adjusted for modality mix (conventional, short daily, nocturnal) and the split between in-center and home care. Once the treated base is set, we translate activity into value using typical session pricing and the expected consumables load per treatment, and then we add capital equipment value using replacement cycles and installation trends.
To keep the totals grounded, the outputs are corroborated with selective bottom-up approximations, including sampled ASP x volume checks for dialyzers, bloodlines, and concentrates, along with supplier and channel feedback on shipment direction and inventory movement. Key inputs that were used as signals (illustrative) include chronic kidney disease burden, end-stage renal disease incidence, dialysis penetration within the eligible population, reimbursement rate direction, machine utilization at centers, and import intensity of core disposables in markets with limited local production. For forecasting, scenario analysis was used so we could reflect different adoption paths for home hemodialysis and different funding environments, and then the selected path was aligned to what primary respondents described as realistic for the next few years. Where data was thin for smaller countries, per-capita treated prevalence and proxy utilization benchmarks were applied, and the assumptions were revisited during validation calls.
Data Validation & Update Cycle
Validation is done through cross-checks that connect the model to independent signals, such as treated patient totals, installed base logic, and the implied spend per patient per year. Large variances are reviewed in steps, starting with unit checks, then price checks, and then a final review that tests whether growth rates match known reimbursement, capacity, and access constraints.
When an outlier persists, we re-contact relevant interviewees and re-check the secondary inputs that drive the specific line item. Reports are refreshed annually, and interim updates are triggered when material events occur, such as major reimbursement changes or supply disruptions that can shift utilization or pricing. Before delivery, a fresh analyst pass is completed so the view reflects the most recent public releases and confirmed market signals.
Mordor Intelligence's Hemodialysis Market Sizing Compared With Other Published Estimates
Published market values for hemodialysis can look far apart because firms do not count the same revenue streams and they also anchor their models to different utilization and pricing inputs. Differences usually show up around whether services are included, how treatment frequency is assumed, and whether adjacent renal therapies are quietly mixed into the same number.
Some published figures roll hemodialysis into a broader renal replacement therapy spending view, and the total can rise quickly when nearby modalities or wider care services are added. In the Mordor Intelligence sizing approach, we limit the scope to hemodialysis equipment, related consumables, and fee-based treatment sessions, and we exclude peritoneal dialysis and transplant-related spending so the value stays tied to a clear treated-session demand pool.
Benchmark comparison
| Source | Market Size | Gaps in Research Methodology |
|---|---|---|
| Mordor Intelligence | USD 38.94 B (2026) | |
| Trade Publisher A | USD 95.52 B (2025) | Uses a wider revenue frame that can blend provider revenues and related hemodialysis goods across more end-user settings, and it is not always clear how much non-hemodialysis renal care is filtered out. The base year and currency timing also differ, which changes the implied pricing level versus a 2026 start point. |
| Global Consultancy B | USD 102.10 B (2023) | Reports a combined market that includes peritoneal dialysis alongside hemodialysis, which expands the counted demand and lifts the total. It also anchors on an earlier base year, and the growth path is sensitive to how services are valued and how modality shares are projected forward. |
The spread in values is mainly explained by scope choices and the year used for pricing and utilization assumptions. When the counted revenue is kept consistent to hemodialysis sessions plus directly linked equipment and consumables, the model becomes easier to audit using treated-patient volumes, session frequency, and replacement cycles, which are checks that can be repeated as the market updates.
Key Questions Answered in the Report
How large is the hemodialysis market in 2026?
The hemodialysis market size is USD 38.94 billion in 2026 and is forecast to rise to USD 49.37 billion by 2031.
What is the expected growth rate for hemodialysis to 2031?
Revenue is projected to expand at a 4.86% CAGR through 2031.
Which product segment is growing fastest?
Consumables and accessories are pacing the field with an 8.34% CAGR owing to razor-and-blade sales models.
Why is home hemodialysis gaining traction?
Reimbursement parity, simplified machines, and infection-avoidance mindsets lifted home penetration to 12.8% in the United States by mid-2025.
Which region is expanding quickest?
Asia-Pacific posts the highest 7.02% CAGR as China, India, and Southeast Asia roll out subsidized dialysis programs.
What technologies are shaping future competition?
High-flux dialyzers, tele-nephrology platforms, and early-stage wearable artificial kidneys are the key innovation themes influencing strategic investment.