
Heavy Duty Trucks Market Size and Share
Market Overview
| Study Period | 2019 - 2031 |
|---|---|
| Market Size (2026) | USD 232.57 Billion |
| Market Size (2031) | USD 301.23 Billion |
| Growth Rate (2026 - 2031) | 5.31 % |
| Fastest Growing Market | Asia Pacific |
| Largest Market | Asia Pacific |
| Market Concentration | Medium |
Major Players *Disclaimer: Major Players sorted in no particular order Image © Mordor Intelligence. Reuse requires attribution under CC BY 4.0. | |
Heavy Duty Trucks Market Analysis by Mordor Intelligence
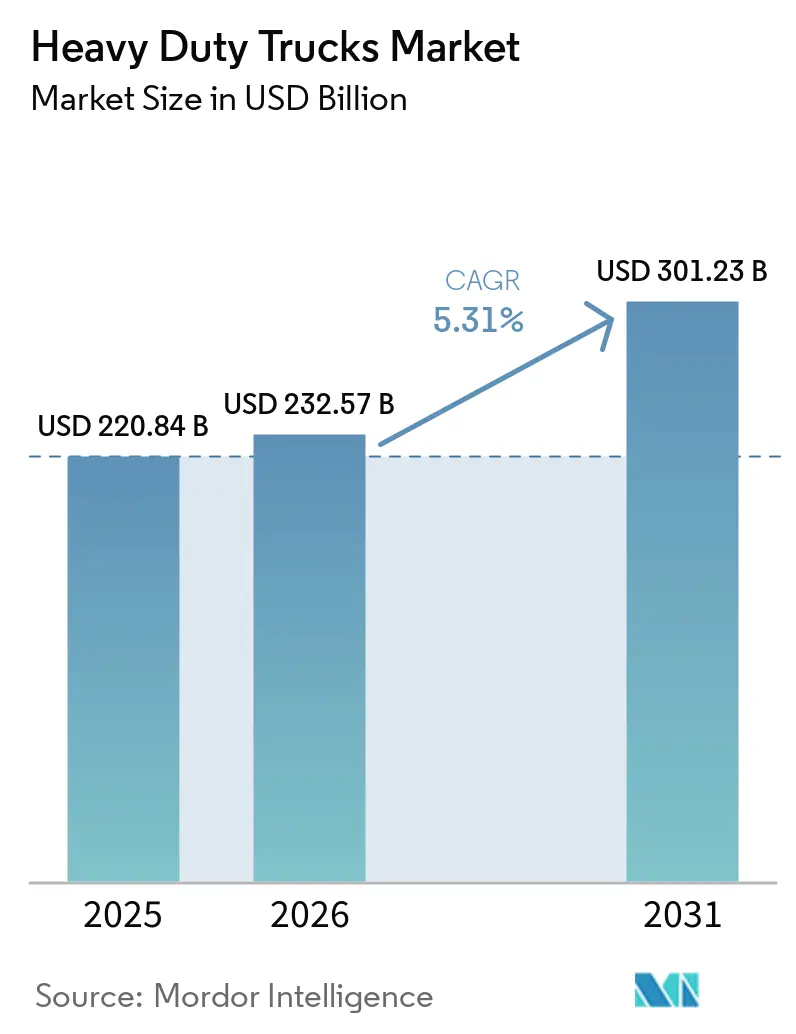
The heavy-duty trucks market size is expected to grow from USD 220.84 billion in 2025 to USD 232.57 billion in 2026 and is forecast to reach USD 301.23 billion by 2031 at a 5.31% CAGR over 2026–2031. Robust e-commerce freight volumes, accelerated fleet renewal under tightening emission rules, and the first commercial deployments of battery-electric and hydrogen fuel-cell tractors are reshaping competitive dynamics. Diesel powertrains continued to dominate deliveries in 2025, yet regulatory cliffs are driving total-cost-of-ownership parity for zero-emission models earlier than many operators expected. Battery-electric variants, benefiting from falling pack prices and overnight depot charging, are recording the fastest take-rate in urban and regional haulage. OEMs are reacting by expanding vertical integration into batteries and software, while fleet managers experiment with leasing to de-risk residual values.
Key Report Takeaways
By tonnage type, the more than 15 T segment held 61.40% share in 2025, while the 10–15 T band is projected to expand the fastest at a 9.50% CAGR through 2031.
By class, Class 8 vehicles led with a 70.80% share in 2025; Class 7 models show the highest growth outlook at an 8.30% CAGR for 2026–2031.
By propulsion type, diesel dominated with an 83.90% share in 2025, whereas battery-electric trucks are set to grow at a 38.50% CAGR, the steepest in the forecast period.
By application, freight and logistics commanded a 55.70% share in 2025 and was also the fastest-growing use case, advancing at an 11.69% CAGR to 2031.
By truck body type, tractor-trailers accounted for 48.60% of 2025 revenue and are expected to register a 10.90% CAGR, the quickest among body configurations.
By sales channel, OEM/first-purchase transactions represented 74.10% share in 2025 and are projected to post a 12.10% CAGR, the highest within channel options.
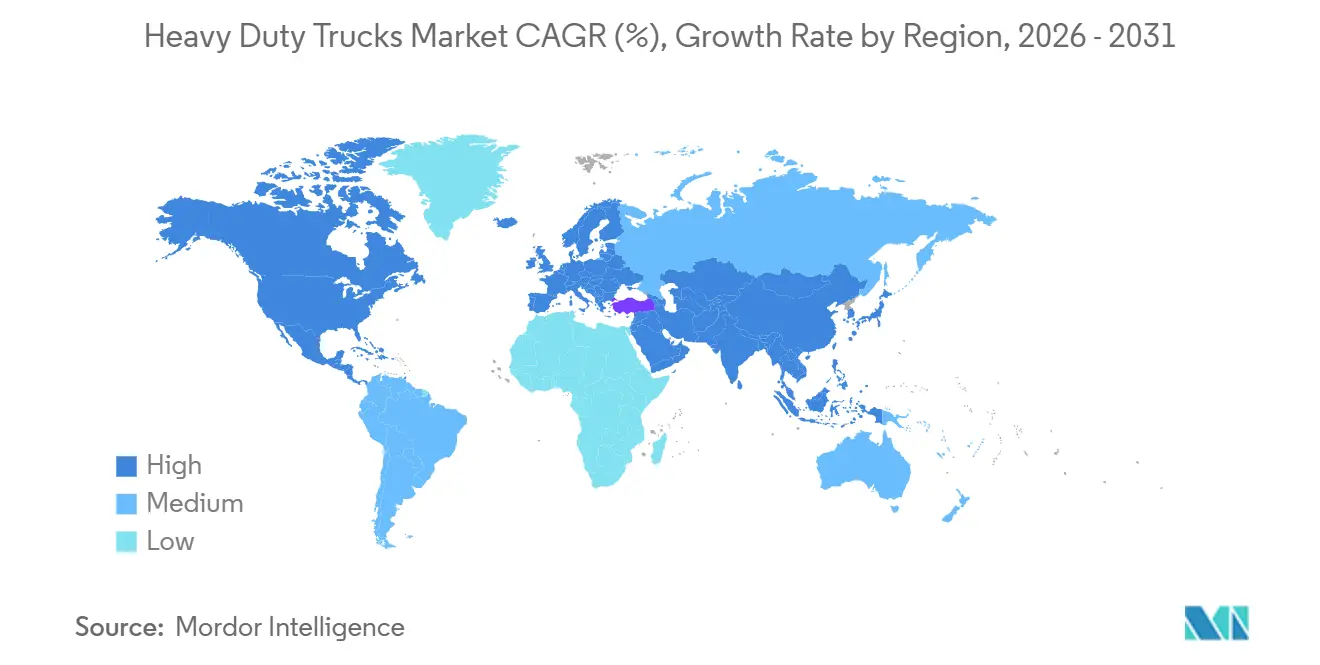
By region, Asia Pacific captured 47.21% of global revenue in 2025 and is forecast to grow at a 9.30% CAGR, topping all regional growth rates.
Note: Market size and forecast figures in this report are generated using Mordor Intelligence’s proprietary estimation framework, updated with the latest available data and insights as of January 2026.
Market Trends and Insights
Drivers Impact Analysis of Heavy Duty Trucks Market*
| Driver | (~) % Impact on CAGR Forecast | Geographic Relevance | Impact Timeline |
|---|---|---|---|
| Expanding E-Commerce | +1.2% | Global, with concentration in North America and Asia-Pacific | Medium term (2–4 years) |
| Strict Global Emission Mandates | +0.9% | Global, led by EU and California, expanding to Asia-Pacific | Long term (≥ 4 years) |
| Infrastructure Stimulus Packages | +0.7% | North America and EU primarily, spillover to emerging markets | Medium term (2–4 years) |
| Hydrogen Corridor Pilot Programs | +0.4% | Asia-Pacific core, early adoption in Japan and India | Long term (≥ 4 years) |
| OTA-Enabled TCO Optimization for Fleet Managers | +0.3% | Global, faster adoption in developed markets | Short term (≤ 2 years) |
| Mining Sector Electrification Commitments | +0.2% | South America and Australia, expansion to Africa | Medium term (2–4 years) |
| Source: Mordor Intelligence | |||
Expanding E-commerce Freight Volumes
E-commerce freight expansion drives heavy-duty trucks market demand through last-mile delivery optimization and regional distribution network densification. The surge in online retail creates demand for medium-duty electric trucks in urban environments, where zero-emission mandates increasingly restrict diesel operations[1]. Parcel and less-than-truckload shipments are reshaping fleet composition as online retail penetration deepens. The American Trucking Associations projects U.S. freight tonnage will rise from 11.27 billion tons in 2024 to 13.99 billion tons by 2035, placing sustained pressure on regional haul assets. Zero-emission zones in California, New York, and several European cities push operators toward Class 7 and lighter Class 8 tractors, duty cycles that align with the current battery range of 200-300 kilometers. Amazon’s pledge to field 100,000 electric delivery vehicles by 2030 illustrates early-adopter willingness to absorb capital premiums for compliance and brand positioning. Operators also benefit from premium freight rates on time-sensitive cargo, partially offsetting higher vehicle prices. The shift toward higher-value goods further incentivizes investments in telematics and predictive maintenance that maximize uptime.
Strict Global Emission Mandates Driving Fleet Renewal
Regulatory frameworks across major markets create unprecedented pressure for fleet electrification, with the EPA's Phase 3 standards requiring 50% of vocational vehicles to be zero-emission by 2032[2]. Regulators are compressing replacement cycles by tightening NOx and CO₂ limits. The U.S. EPA Clean Trucks Plan stipulates that zero-emission models must reach 40% of new Class 8 tractor sales by model year 2032, with interim steps beginning in 2027. Euro VII standards entering force in 2027 impose real-world testing and onboard diagnostics that add 10-15% to diesel engine costs, narrowing the price gap with battery-electric alternatives. Fleets delaying electrification risk stranded assets as resale values for older diesels fall in restricted zones, a trend amplified by California’s Advanced Clean Trucks rule. China's rapid adoption of zero-emission heavy-duty vehicles, with over 80% of global electric truck sales, demonstrates how policy can accelerate market transformation[3].
Infrastructure Stimulus Packages
Government spending is expanding charging and refueling corridors. The U.S. Infrastructure Investment and Jobs Act allocates USD 7.5 billion for nationwide EV charging, supporting megawatt systems suited to long-haul trucks. Europe’s TEN-T upgrade funds cross-border stations along priority freight axes, while China’s Belt and Road projects include battery swap depots for logistics parks. These programs shorten range-anxiety payback periods, thereby reinforcing heavy-duty trucks market fleet renewal mandates. Suppliers of charging hardware and grid services benefit from predictable project pipelines that enable scale economies.
Hydrogen Corridor Pilot Programs in Asia Pacific
Japan’s Fukushima Hydrogen Highway links Tokyo to the northeast with 12 fueling stations, enabling Toyota and Hino fuel-cell rigs to cover 600 kilometers without range compromise. South Korea has earmarked KRW 500 billion to deploy 50 hydrogen stations by 2027, targeting 10,000 fuel-cell trucks in service. Australia’s Queensland Hydrogen Highway aims to decarbonize mining haulage through projects backed by Fortescue Metals Group. These pilots validate high-density energy carriers for payload-sensitive or multi-shift operations, although green hydrogen costs of USD 5-7 per kilogram remain a barrier for the heavy-duty trucks market.
Restraints Impact Analysis of Heavy Duty Trucks Market*
| Restraint | (~) % Impact on CAGR Forecast | Geographic Relevance | Impact Timeline |
|---|---|---|---|
| High Upfront Cost of Zero-Emission Heavy Trucks | -1.1% | Global, most acute in price-sensitive emerging markets | Medium term (2-4 years) |
| Volatile Diesel Price Environment Impacting Purchase Cycles | -0.6% | Global, with regional variations in fuel taxation | Short term (≤ 2 years) |
| Semiconductor Shortages Delaying ADAS/EV Production | -0.4% | Global, concentrated in Asia Pacific manufacturing hubs | Short term (≤ 2 years) |
| Stricter EU Axle-Weight Rules Limiting Payload Economics | -0.3% | Europe primarily, with spillover to export markets | Medium term (2-4 years) |
| Source: Mordor Intelligence | |||
High Upfront Cost of Zero-emission Heavy Trucks
Battery-electric Class 8 tractors still cost two to three times more than diesel equivalents, with 2025 list prices of USD 350,000-400,000 versus USD 150,000-180,000 for conventional units. Subsidies such as California’s HVIP vouchers, which can reach USD 240,000 per truck, ease but do not eliminate the premium. In price-sensitive economies, cash-flow constraints prevent smaller fleets from absorbing even subsidized differentials. Financiers also demand higher interest spreads to compensate for uncertain residual values and battery degradation beyond year 7 in the heavy-duty trucks market.
Volatile Diesel Price Environment Impacting Purchase Cycles
Sharp swings in fuel prices complicate payback calculations for electric trucks. When diesel spot rates fall below USD 3 per gallon, fleet managers may defer replacement or shift to lower-capex natural-gas options. Conversely, price spikes above USD 4.50 accelerate orders but also inflate operating costs for diesel units awaiting delivery, compressing margins and limiting balance sheet flexibility in the heavy-duty trucks market.
*Our forecasts treat driver/restraint impacts as directional, not additive. The impact forecasts reflect baseline growth, mix effects, and variable interactions.
Heavy Duty Trucks Market Segment Analysis
By Tonnage Type:
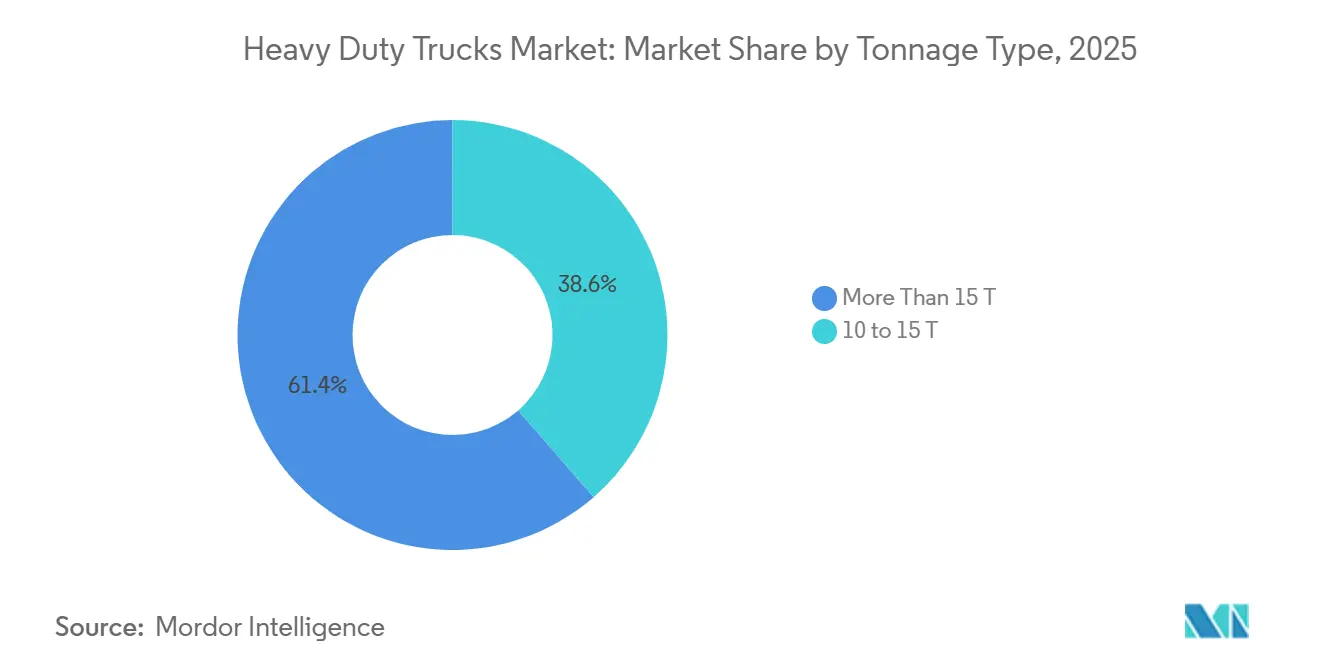
Heavier Segments Drive ElectrificationThe heavy-duty trucks market size for vehicles above 15 tons stayed dominant with a 61.40% revenue share in 2025, reflecting the still-critical role of long-haul and construction logistics. The segment continues to grow, supported by infrastructure spending but tempered by higher battery mass penalties. Conversely, the 10-15 ton bracket is advancing at a 9.50% CAGR; cities granting delivery privileges to lighter gross vehicle weights foster this outperformance. Europe’s proposed 1-ton allowance for battery-electric rigids aims to preserve payload parity and is catalyzing OEM portfolio additions.
Operators report that the “Goldilocks” mid-weight class balances range, payload, and chassis cost. Daimler’s eActros 300 achieved a 220-kilometer real-world range in Swiss pilots, covering a full double-shift with overnight charging. Battery prices nearing USD 110 per kilowatt-hour in 2026 are making mid-weight electrification financially attractive within three-year payback windows. Policy signals in California and Paris that prohibit diesels over 12 tons inside city limits after 2030 further anchor demand. As a result, the 10-15 ton segment is set to raise its share of the heavy-duty trucks market to roughly 30% by 2031.
By Class:
Class 8 Dominance Faces Medium-duty ChallengeClass 8 maintained a commanding 70.8% presence in 2025, driven by interstate haulage and heavy construction. With an 8.30% CAGR forecast, Class 7 gains from duty cycles of 150-200 miles that match current battery ranges without en-route charging. CARB requires 40% zero-emission sales for Class 7 tractors by 2032, accelerating OEM roadmaps.
Mack’s MD Electric offers a 150-kilowatt-hour pack and 140-mile range, succeeding in beverage and food-service fleets where predictable routes enable scheduled charging. Class 8 electrification remains experimental but promising; megawatt chargers rolling out on U.S. I-5 and German Autobahns enable 45-minute turnarounds. The heavy-duty trucks market share for Class 8 is projected to slip below 68% by 2031 as medium-duty adoption accelerates.
By Propulsion Type:
Diesel Dominance Meets Electric DisruptionDiesel retained an 83.90% share in 2025; however, its portion is forecasted to drop to 66-68% by 2031. Battery-electric vehicles are scaling at a 38.50% CAGR, propelled by falling pack costs and emissions regulations. Volvo’s FH Electric, featuring a 540-kilowatt-hour battery, entered series production in 2024, supporting 600-kilometer routes for customers aiming for 2027 compliance.
Fuel-cell trucks are well-suited for applications where payload or duty cycles exceed battery capability. Alternative fuels, such as renewable natural gas and biodiesel, demonstrate healthy growth, offering immediate CO₂ reductions where electric infrastructure lags behind. Diesel’s longevity in mining and long-haul African corridors indicates a multi-propulsion landscape through the next decade.
By Application:
Freight Logistics Leads TransformationFreight logistics represented 55.70% of overall demand in 2025 and is growing at an 11.69% CAGR. E-commerce service levels necessitate time-definite delivery, justifying higher capex on connected, zero-emission trucks. Anglo American’s hydrogen haul truck at Mogalakwena validated 290-ton payloads, signalling mining’s pathway to decarbonization. Construction and mining follow at 28% share but adopt at slower rates due to remote-site charging challenges.
Municipal fleets, holding 12%, pivot to battery-electric refuse and utility rigs for city climate pledges. Volvo’s FE Electric refuse truck now serves Stockholm waste routes with zero tailpipe emissions. Specialized applications such as refrigerated logistics are experimenting with hybridized diesel-electric modules, underscoring that one propulsion does not yet fit all.
By Truck Body Type:
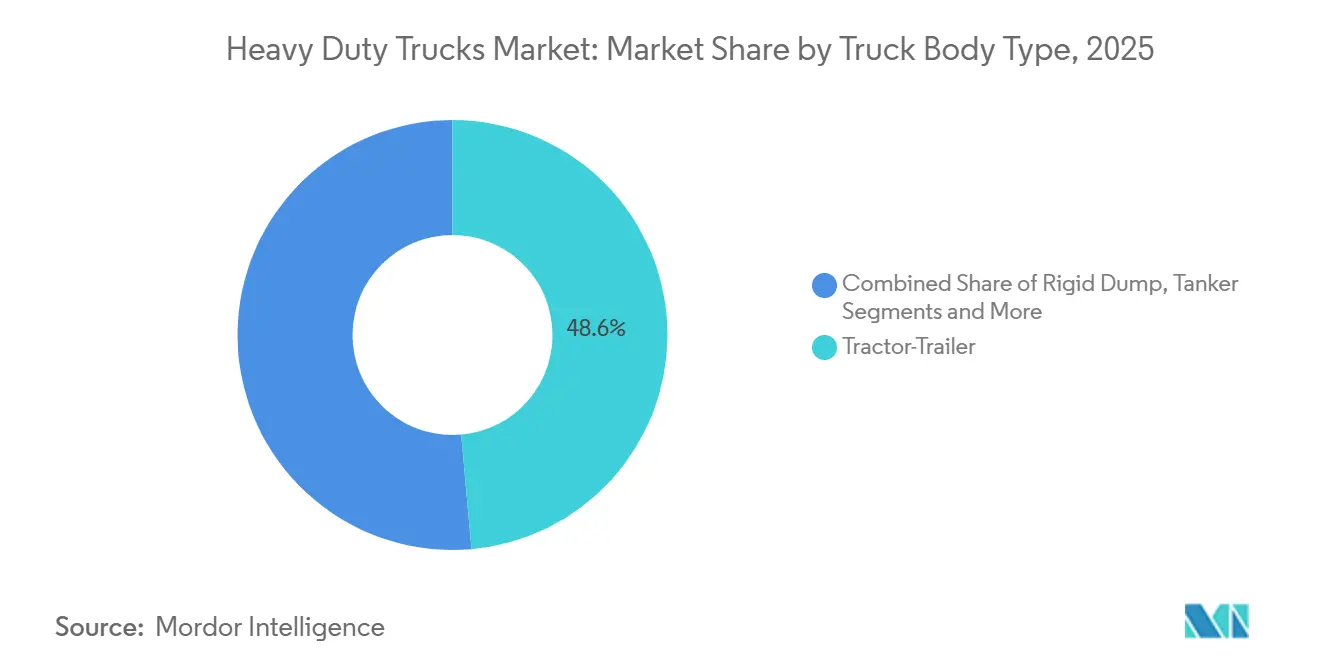
Tractor-trailers Maintain LeadershipTractor-trailers dominated with a 48.60% share and a 10.90% CAGR through 2031. Their high utilization rates support investment in megawatt charging and autonomous-ready chassis. PACCAR’s Kenworth T680E delivers 250 miles of range, enabling port-to-warehouse shuttle loops on the U.S. West Coast. Rigid dump trucks stay relevant in mining but lag in electrification due to duty cycle severity.
Tankers at 14% share are early adopters for city fuel distribution, capitalizing on nighttime depot charging. Flatbeds, reefers, and other specialized bodies explore modular packs that can be swapped in under 10 minutes. By 2031, tractor-trailers will still command the largest slice of the heavy-duty trucks market, yet rigid electrification in mining could close the gap if payload-neutral battery chemistries emerge.

By Sales Channel:
OEM Dominance Reflects Fleet PreferencesOEM direct sales absorbed 74.10% of unit volumes in 2025, reflecting fleet trust in factory warranties for complex electrified systems; this channel is projected to post a 12.10% CAGR, the highest within channel options. Leasing and rental channels let operators avoid upfront premiums and hedge technology risk. Ryder’s 2025 battery-electric leasing bundle includes guaranteed buy-back and depot charger financing, smoothing cash flow.
Aftermarket retrofits are gaining traction, driven by California fleets converting older trucks to battery-electric drivetrains to retain access to zero-emission zones. Lightning eMotors has already modified more than 500 Class 6-7 units since 2024. As battery costs fall, direct sales will hold the majority share, yet leasing is positioned to expand fastest as lenders grow comfortable underwriting residuals.
Geography Analysis
APAC Heavy Duty Trucks Market
Asia-Pacific led with a 47.21% revenue share in 2025 and is projected to grow at a 9.30% CAGR to 2031, buoyed by China’s manufacturing scale and regional hydrogen corridors. Sinotruk, FAW, and Dongfeng captured over 60% of regional volumes as the National VI standard and municipal incentives in Beijing and Shanghai accelerated urban electrification. India’s Tata Motors launched the Prima EV in 2024, addressing metropolitan freight and select mining customers, while state subsidies in Delhi and Maharashtra target 8,000 zero-emission trucks by 2028. Japan’s Fukushima Hydrogen Highway underpins fuel-cell pilots, and Australia’s Fortescue Metals Group invests in hydrogen haulage to cut Scope 1 emissions.
North America and Europe Heavy Duty Trucks Market
North America held a 28% share, animated by the U.S. EPA Clean Trucks Plan and federal charging grants. California’s Advanced Clean Trucks rule and incentives reaching USD 240,000 per vehicle sustain the nation’s largest zero-emission fleet pipeline. Canada’s up-to-CAD 200,000 rebates drive uptake along the Windsor-Quebec corridor, while Mexico’s cross-border carriers electrify to maintain California access. Europe contributed 18% in 2025, with Euro VII standards and Germany’s Autobahn megawatt chargers catalyzing adoption. The United Kingdom mandates 10% zero-emission truck sales by 2030, scaling to 100% by 2040. France and Italy support LNG as a bridge fuel, whereas Scandinavia pushes battery-electric solutions across all classes.
MEA and LATAM Heavy Duty Trucks Market
The Middle East and Africa collectively accounted for 7%, with Dubai and Riyadh piloting Chinese battery-electric rigs for urban deliveries. Extreme temperatures necessitate advanced thermal management, slowing broader adoption. Latin America’s mining belts in Chile and Peru represent early hydrogen fuel-cell demand, but broader market growth is constrained by financing costs and infrastructure gaps.
Mordor Intelligence provides coverage of the heavy duty trucks market across other key regional markets, including Europe and Africa, each with their regulatory frameworks and demand patterns. Detailed country-level analysis extends to United States, Mexico, and Saudi Arabia incorporating local coverage and market participation, as required.
Regulatory Landscape
Emissions and GHG rules are tightening in the United States, Europe, and China, compressing fleet replacement cycles and increasing compliance requirements for new Class 7-8 platforms. In the United States, EPA heavy-duty engine and vehicle standards require more stringent criteria-pollutant controls beginning no later than model year 2027, while the Heavy-Duty Phase 3 final rule sets greenhouse-gas standards for model years 2028-2032 with phase-in starting in model year 2027. In July 2026, EPA issued a proposal to amend compliance provisions and test procedures for model year 2027 and later heavy-duty highway engines, including updated nonconformance penalties that influence how OEMs manage certification and in-production variability.
In Europe, Regulation (EU) 2024/1257 (Euro 7) sets new type-approval requirements, with compliance deadlines at 48 months after entry into force for new heavy-duty vehicle types and 60 months for all new heavy-duty vehicles. This timeline pushes OEMs to prioritize real-world durability and diagnostics alongside tailpipe controls. China continues to refine China VI for diesel heavy-duty vehicles; SAMR/SAC issued GB 17691-2018/XG1-2026 in April 2026, effective May 1, 2026, strengthening the compliance baseline for domestic production and influencing export-spec calibrations for China-facing platforms.
Value Chain Analysis
The value chain covers raw materials and castings/forgings, powertrain and aftertreatment systems (diesel, gas, and zero-emission variants), batteries and fuel-cell stacks, chassis and body integration, software and telematics, final assembly, and distribution through OEM direct sales, dealers, and leasing providers. As zero-emission programs scale, batteries and power electronics take up a larger share of bill-of-materials influence, which is driving OEM moves into vertical integration and joint ventures. For example, Accelera by Cummins, Daimler Truck, and PACCAR formed a joint venture targeting a 21 GWh U.S. battery cell factory to localize supply for commercial vehicles.
Upstream sourcing and cross-border content rules are also shaping manufacturing footprints and supplier selection. In North America, USMCA regional value content requirements (64% today, rising to 70% in 2027) and Section 232 tariffs (including 25% tariffs on imported heavy-duty truck parts) are prompting OEMs and suppliers to rebalance sourcing across the United States, Mexico, and Canada. Operationally, component availability remains a constraint for complex builds, as shown by delivery impacts from sub-component shortages such as the mirror shortage that delayed Navistar truck deliveries in Q2 2024. Downstream, fleets are adding charging and hydrogen logistics into procurement decisions, with collaborations such as Savage and Symbio North America (April 2025) targeting drayage deployments that illustrate how infrastructure and powertrain partners are becoming part of the effective go-to-market chain.
Competitive Landscape
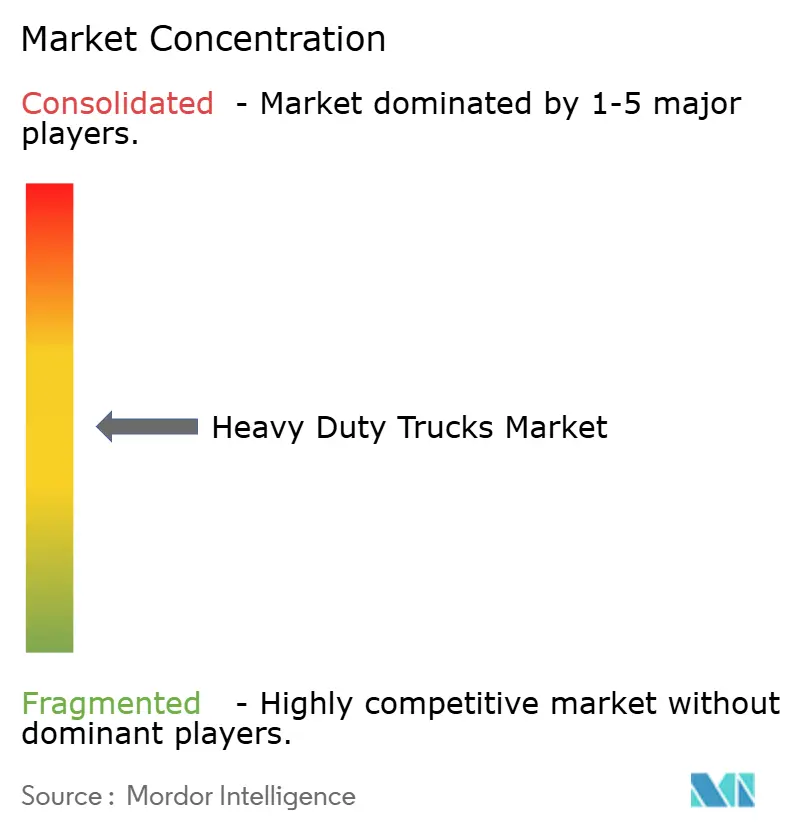
Global market concentration remains moderate: the top five OEMs - Daimler Truck, Volvo Group, PACCAR, Traton, and China National Heavy Duty Truck - held a significant share in 2025. Daimler and Volvo formed a EUR 1 billion software joint venture in 2024 to accelerate autonomous and over-the-air capabilities. PACCAR’s USD 400 million Texas battery facility, announced in 2025, demonstrates OEM moves to control critical supply and capture pack margins.
Chinese producers expand into Southeast Asia, Latin America, and Africa with aggressively priced battery-electric models that undercut Western peers by 15-20%. Intellectual-property leadership remains with incumbents, which hold 70% of solid-state battery and hydrogen stack patents filed through 2025. Start-ups such as Nikola pivot toward hydrogen corridor infrastructure to differentiate, yet production ramp challenges and cash-flow constraints limit share gains.
Aftermarket retrofits and fleet-as-a-service models present white-space opportunities. Lessors bundle vehicles, charging, and maintenance into predictable monthly fees, addressing the residual-value uncertainty that hinders direct purchase in cost-sensitive fleets. Differentiation increasingly revolves around battery thermal management, megawatt charging compatibility, and predictive maintenance algorithms that compress operating costs.
Heavy Duty Trucks Industry Leaders
-
PACCAR Inc.
-
Tata Motors Limited
-
Volvo Group
-
Traton SE
-
Daimler Truck Holding AG
- *Disclaimer: Major Players sorted in no particular order
Heavy Duty Trucks Market Companies Covered in this Report
- Daimler Truck Holding AG
- Traton SE
- Volvo Group
- PACCAR Inc.
- Dongfeng Motor Corporation
- Tata Motors Ltd.
- FAW Group Corp.
- CNHTC (Sinotruk)
- Ashok Leyland Ltd
- Isuzu Motors Ltd.
- Hino Motors Ltd.
- Navistar International
- Iveco Group N.V.
- Hyundai Motor Co.
- Nikola Corporation
- JAC Motors
- Kamaz PJSC
- Foton Motor Co. Ltd.
Market Opportunities and Future Outlook
Regulatory deadlines and compliance flexibility are broadening the addressable solution set beyond a single propulsion pathway, allowing OEMs and suppliers to package diesel, gas, battery-electric, and hydrogen-based offerings with software and service contracts. EPA actions around model year 2027 and later heavy-duty engines, including the July 2026 proposal covering compliance provisions and nonconformance penalties, keep certification strategy, warranty coverage, and useful-life obligations at the center of product planning and can favor OEMs with stronger calibration, aftertreatment, and data-driven compliance toolchains. In parallel, Europe is working through the Euro 7 implementation timeline under Regulation (EU) 2024/1257, reinforcing demand for onboard diagnostics, real-world durability validation, and fleet management integration that reduces compliance risk during everyday operations.
Long-haul zero-emission adoption remains a key whitespace where product availability and industrialization milestones are becoming more visible, shifting the opportunity from pilots to scalable offerings in selected lanes. DAF commenced series production of its XG Electric and XG+ Electric long-haul models in June 2026, and MAN Truck & Bus reported 1,300 electric heavy-series trucks produced at its Munich plant since series production began in 2025. These updates indicate expanding OEM capacity to supply high-utilization fleets. Battery and powertrain supply localization is also supporting rollout economics, as reflected in the Accelera by Cummins, Daimler Truck, and PACCAR battery cell joint venture targeting a 21 GWh U.S. facility. On the fleet demand-creation side, programs such as the Center for Green Market Activation RFP (December 2024) to deploy about 250 Class 8 zero-emission trucks using book-and-claim procurement point to structured mechanisms that aggregate demand and help address early-market premium and infrastructure coordination barriers.
Recent Industry Developments in Heavy Duty Trucks Market
- July 2026: Daimler Truck entered a partnership with KEYOU to develop and commercialize hydrogen internal combustion engine trucks based on Mercedes-Benz Actros L 1848 units. The partnership adds a hydrogen pathway that leverages familiar ICE manufacturing and service ecosystems, supporting fleets that need fast refueling and payload continuity where battery-electric charging buildout is constrained.
- June 2025: Daimler Truck and Toyota finalized the merger of Hino Motors and Mitsubishi Fuso truck subsidiaries under a new holding company. The transaction consolidates scale in powertrains and advanced technology development, strengthening the combined platform strategy for emissions compliance and electrified heavy-duty roadmaps.
- May 2024: Panasonic Energy began supplying lithium-ion batteries for Hexagon Purus and Hino Trucks Tern brand Class 8 battery-electric tractors, with a plan to transition production to a new Kansas facility. This supply arrangement supports localization of battery availability and underpins OEM and upfitter efforts to industrialize Class 8 battery-electric tractor programs.
Heavy Duty Trucks Market Report Scope and Research Methodology
Market Definition and Coverage
This market is the value of new heavy-duty trucks sold globally, counted at the point of first sale, and used for freight movement and heavy vocational work like construction, mining, and municipal services.
Scope exclusions: Used truck resales, trailers, medium-duty trucks, and aftermarket parts are excluded from this sizing.
Segments Covered in This Report
- By Tonnage Type
- 10 to 15 T
- More Than 15 T
- By Class
- Class 7
- Class 8
- By Propulsion Type
- Diesel
- Battery-Electric
- Fuel-Cell Electric (FCEV)
- Alternative Fuels (CNG, LNG, Biodiesel)
- By Application
- Construction and Mining
- Freight and Logistics
- Municipal and Utilities
- Others
- By Truck Body Type
- Tractor-Trailer
- Rigid Dump
- Tanker
- Others
- By Sales Channel
- OEM/First Purchase
- Lease and Rental
- After-market Retrofit
- By Geography
- North America
- United States
- Canada
- Rest of North America
- South America
- Brazil
- Argentina
- Rest of South America
- Europe
- Germany
- United Kingdom
- France
- Italy
- Russia
- Rest of Europe
- Asia-Pacific
- China
- India
- Japan
- South Korea
- Australia and New Zealand
- Rest of Asia-Pacific
- Middle East and Africa
- Saudi Arabia
- United Arab Emirates
- Egypt
- Turkey
- South Africa
- Rest of Middle East and Africa
- North America
Data Sources, Market Sizing, and Validation
Desk Research
Desk research was used to set clean boundaries for what counts as a heavy-duty truck and to build the basic demand picture by region and application. We relied on public data series that can be checked and updated, such as vehicle registration and parc releases from transport ministries, road freight and industrial output indicators from sources such as the World Bank and national statistics offices, and trade or shipment signals from customs authorities.
To convert activity signals into a market value view, we also reviewed sources such as industry and dealer association publications, safety and emissions rulebooks from regulators, and manufacturer public filings and investor decks that discuss production, capacity, and pricing direction. Where needed, paid subscriptions for company financials and patent databases were used to confirm ownership changes, technology shifts, and product cycle timing. The desk sources listed here are illustrative only, and many other public and paid sources were reviewed for collection, validation, and clarification.
Primary Interviews and Surveys
Primary work was used to stress test what we saw in public data and to fill gaps around mix shifts, pricing behavior, and timing of fleet replacement. We spoke with OEM and body-builder stakeholders, dealer and leasing channels, fleet operators, and component ecosystem experts across APAC, EMEA, and the Americas, and then we used follow-up questions when a data point looked inconsistent with production or registration signals.
Distribution of primary research fieldwork respondents
| Company type | Respondent position | Region |
|---|---|---|
| Top tier: 36% | CXOs: 14% | APAC: 47% |
| Mid tier: 47% | Functional/Unit leaders: 31% | EMEA: 34% |
| Smaller Players: 17% | Managers: 55% | Americas: 19% |
Market-Sizing & Forecasting
Sizing starts from a top-down build where production, sales, and trade related signals are used to reconstruct the yearly pool of new heavy-duty truck demand, and then it is allocated by region and main use cases. The totals are corroborated with selective bottom-up checks, such as sampled average selling prices by truck class and body type, plus channel feedback on order intake and delivery backlogs, which are then used to adjust unrealistic mixes.
Key model inputs include heavy-duty truck registrations and replacement cycles, road freight activity and construction output, infrastructure and mining capex direction, emissions and safety rule timing that can pull forward purchases, and powertrain mix shifts that change realized pricing. For forecasting, scenario analysis was used around macro indicators and policy timing, and the final path was aligned to what interviewees expected for fleet budgets, build rates, and pricing over the next few years. When a country level data series was missing, proxy indicators (like freight activity and import patterns) were applied and then reviewed again during validation.
Data Validation & Update Cycle
We validate the model in multiple passes by comparing outputs against independent signals such as OEM build commentary, registration momentum, and trade flows, so the final value does not depend on one data stream. If a region shows an unusual jump or a sudden price step-up, it is flagged, recalculated, and checked again with a fresh outreach to clarify whether it is a timing issue, a mix change, or a currency effect.
Before sign-off, another analyst reviews the assumptions, calculations, and year-on-year movements, and then the final dataset is rechecked for internal consistency across regions and applications. Reports are refreshed annually, and interim updates are made when major policy changes, sharp demand swings, or supply disruptions materially shift the outlook. Right before delivery, the model is rerun with the latest available public releases so clients receive an updated view.
Mordor Intelligence's Heavy Duty Trucks Market Size Measured Against Other Published Estimates
Published market sizes for heavy-duty trucks do not always match because groups define the truck boundary differently and they also time their pricing and currency assumptions in their own way. It is common to see spreads driven by whether the estimate is limited to Class 7-8 new truck sales, or whether lighter commercial classes and related services get pulled into the same number.
By tracking registration based demand signals and refresh timing for price and currency inputs, Mordor Intelligence keeps the heavy-duty truck total tied to new Class 7-8 sales (GVWR above 26,000 lb) and avoids mixing in adjacent classes or resale values that can inflate the headline.
Benchmark comparison
| Source | Market Size | Gaps in Research Methodology |
|---|---|---|
| Mordor Intelligence | USD 232.57 B (2026) | |
| Trade Publisher A | USD 229.16 B (2024) | Uses a factory-gate framing that can include related services sold by manufacturers, and the class boundary is not consistently kept to only new Class 7-8 in all regions, which shifts the total even before forecasting assumptions are applied. |
| Global Consultancy B | USD 230.11 B (2025) | Expands the class scope to include Class 5 and Class 6 alongside Class 7-8, and it also applies a higher growth trajectory into 2035, which can pull the base year and pricing mix in a different direction. |
The comparison shows that most of the gap comes from scope and counting rules, not from arithmetic. When the boundary is kept to new Class 7-8 trucks and pricing is updated in step with mix changes and currency timing, the market value stays easier to trace back to observable demand drivers and repeatable checks.
Key Questions Answered in the Report
What is the current size of the heavy duty trucks market?
The market was valued at USD 232.57 billion in 2026 and is projected to reach USD 301.23 billion by 2031 at a 5.31% CAGR.
Which propulsion technology is growing fastest?
Battery-electric trucks post a 38.50% CAGR to 2031, the highest among all power-train options.
How dominant is Asia Pacific in this sector?
Asia Pacific holds 47.21% of global revenue and recorded the fastest 9.30% CAGR through 2031.
How are regulators influencing fleet renewal cycles?
Mandates such as U.S. EPA Phase 3 standards and the EU’s 90% CO₂-reduction target compel fleets to replace or retrofit equipment ahead of normal life cycles, creating regulatory-driven demand surges.