
Heat-Resistant Coatings Market Size and Share
Market Overview
| Study Period | 2020 - 2031 |
|---|---|
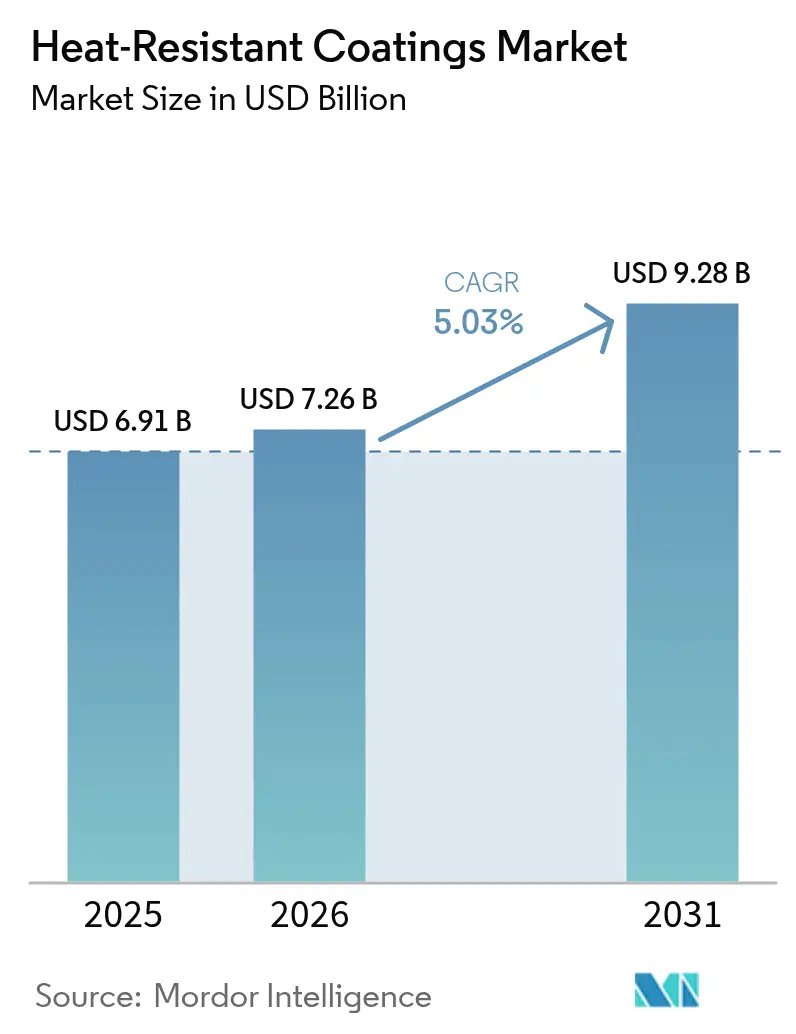
| Market Size (2026) | USD 7.26 Billion |
| Market Size (2031) | USD 9.28 Billion |
| Growth Rate (2026 - 2031) | 5.03 % |
| Fastest Growing Market | Asia Pacific |
| Largest Market | Asia Pacific |
| Market Concentration | High |
Major Players *Disclaimer: Major Players sorted in no particular order Image © Mordor Intelligence. Reuse requires attribution under CC BY 4.0. | |
Heat-Resistant Coatings Market Analysis by Mordor Intelligence
The Heat-Resistant Coatings market size is expected to grow from USD 6.91 billion in 2025 to USD 7.26 billion in 2026 and is forecast to reach USD 9.28 billion by 2031 at 5.03% CAGR over 2026-2031. Rising global infrastructure investments, tighter fire-safety rules and the aerospace sector’s push for reusable spacecraft continue to widen demand. Asia-Pacific retains scale advantages through government-led building programs and manufacturing expansion, while North America and Europe emphasize high-performance solutions that meet stricter environmental rules. Technology adoption shows two clear tracks: water-borne systems hold volume leadership owing to lower VOC emissions, and UV/EB-curable chemistries post the fastest gains by combining rapid cure with minimal environmental impact. Silicone-based resins dominate both scale and growth because of unmatched stability above 600 °C, and emerging power-generation projects are shifting volume toward energy infrastructure where thermal management is critical. Raw-material price swings and a shortage of certified applicators remain counterweights, yet sustained innovation in sustainable formulations and automated spray systems keeps the long-term outlook positive.
Key Report Takeaways
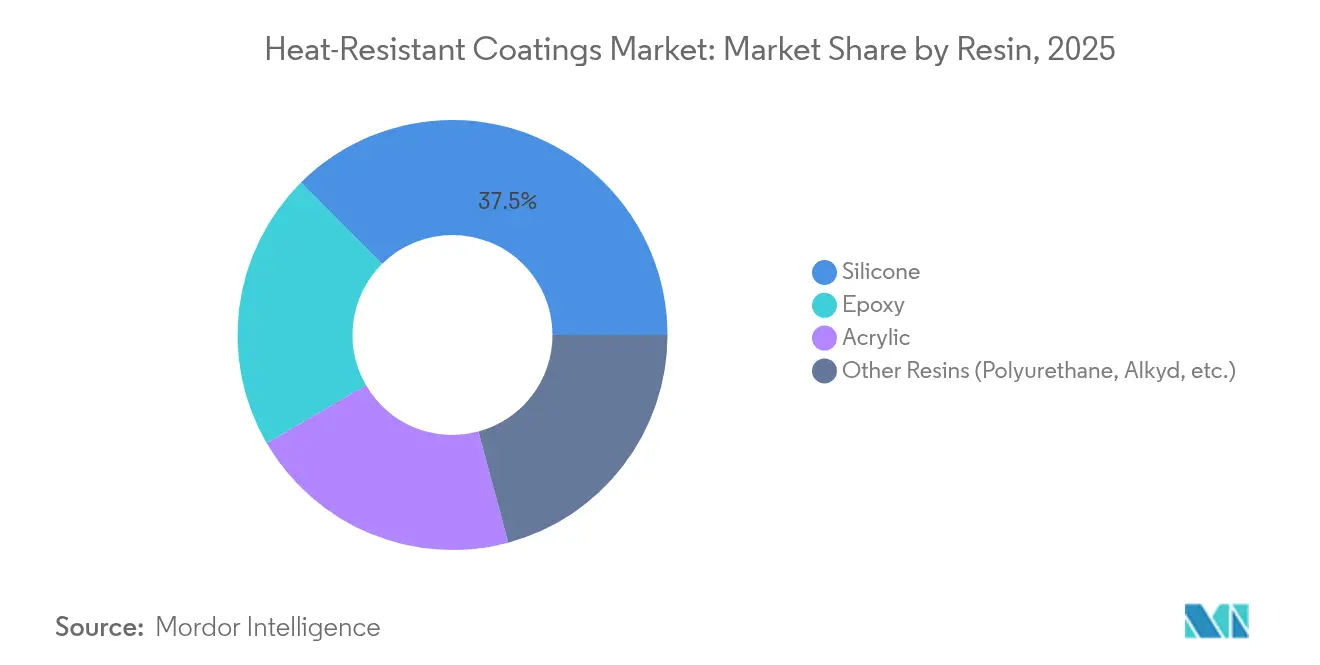
- By resin, silicone commanded 37.45% heat-resistant coatings market share in 2025 and is growing at 8.78% CAGR, the fastest among all chemistries.
- By technology, waterborne systems captured 38.74% of the 2025 heat-resistant coatings market share, while UV/EB-curable systems are advancing at 7.08% CAGR.
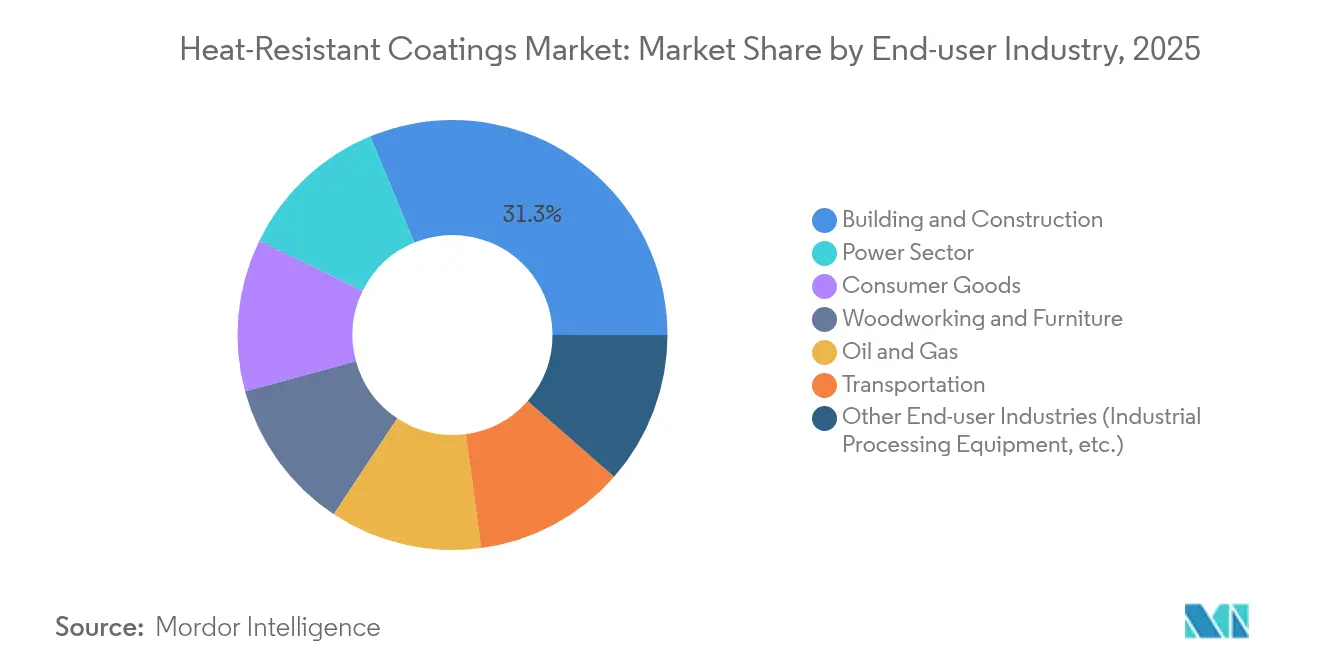
- By end-user industry, building and construction accounted for 31.25% of 2025 revenue; the power sector is the fastest-growing end-use at 9.55% CAGR.
- By geography, Asia-Pacific led with 47.12% of 2025 revenue and is expanding at a 7.35% CAGR through 2031.
Note: Market size and forecast figures in this report are generated using Mordor Intelligence’s proprietary estimation framework, updated with the latest available data and insights as of 2026.
Market Trends and Insights
Drivers Impact Analysis of Heat-Resistant Coatings Market*
| Drivers | (~) % Impact on CAGR Forecast | Geographic Relevance | Impact Timeline |
|---|---|---|---|
| Surge in global infrastructure spending | 1.5% | Global, with APAC leading | Medium term (2-4 years) |
| Stricter global fire-safety regulations | 0.8% | North America and EU, expanding to APAC | Short term (≤ 2 years) |
| Growing demand from the aerospace industry | 1.2% | North America, Europe, and emerging in APAC | Long term (≥ 4 years) |
| Rising awareness toward fire protection equipment | 0.6% | Global, with faster adoption in developed markets | Medium term (2-4 years) |
| Reusable spacecraft and space-tourism vehicles | 0.4% | North America, Europe | Long term (≥ 4 years) |
| Source: Mordor Intelligence | |||
Surge in Global Infrastructure Spending
Governments are funding record levels of infrastructure aimed at climate resilience and urban growth. The United States Infrastructure Investment and Jobs Act earmarked USD 225 million for updated energy codes that influence coating specifications[1]. Emerging Asia-Pacific economies add momentum as Indonesia, India, and China accelerate airport, bridge, and smart-city projects that specify high-temperature barrier films. Public-private partnerships in transport tunnels and district-heating lines further widen demand for long-cycle thermal coatings.
Stricter Global Fire-Safety Regulations
Fire-code revisions raise minimum performance thresholds for ignition resistance, smoke toxicity, and end-use surface temperature. The International Fire Code 2024 introduces updated flame-spread benchmarks that immediately affect coating formulations. California’s Fire Code Chapter 24 mandates automatic extinguishing systems and specialized ventilation for coating booths handling heat-resistant products. EU directives continue to shrink allowed solvent content, pushing builders toward low-VOC silicone-acrylic hybrids. Retrofits of high-rise facades and transportation hubs create demand spikes as owners bring assets into compliance. Manufacturers that certify products above the new baseline win specification priority and reduce the need for costly rework.
Growing Demand from the Aerospace Industry
Gas-turbine and spacecraft programs rely on coatings able to tolerate extreme thermal cycling without spallation. Honeywell expanded its thermal-barrier coating line in South Carolina to support next-generation engines that operate above 1,300 °C. Ytterbium-silicide research from the Tokyo University of Science targets higher oxidation resistance for jet engines, signaling future commercial adoption. Qualification cycles are long, but once approved, suppliers secure premium, multi-year contracts. European airframers aim to cut fuel burn by 15% through hotter core temperatures, further enlarging the addressable heat-resistant coatings market. Asia-Pacific suppliers are entering joint ventures to localize production as regional aircraft projects mature.
Rising Awareness Toward Fire Protection Equipment
Corporate risk programs now bundle passive and active fire-safety measures, elevating the role of intumescent and ceramic-filled coatings. AI-enabled monitoring systems require coatings that remain stable at sensor interface points and can self-report degradation. Insurance carriers in North America and Europe offer premium discounts when structures apply listed passive fire-protection films, strengthening the value proposition. Museums and heritage trusts deploy low-gloss, non-yellowing silicone topcoats on artifacts, widening the industry’s cultural-asset segment. The combination of regulatory pressure and financial incentives sustains expansion even in lower-growth construction markets.
Restraints Impact Analysis of Heat-Resistant Coatings Market*
| Restraints | (~) % Impact on CAGR Forecast | Geographic Relevance | Impact Timeline |
|---|---|---|---|
| Volatile silicone and epoxy prices | -0.7% | Global, with Asia-Pacific supply concentration | Short term (≤ 2 years) |
| VOC limits on solvent-borne systems | -0.5% | North America and the EU, expanding globally | Medium term (2-4 years) |
| Applicator skill shortage for multi-layer systems | -0.3% | Global, acute in developed markets | Long term (≥ 4 years) |
| Source: Mordor Intelligence | |||
Volatile Silicone and Epoxy Prices
A United States International Trade Commission ruling found certain epoxy imports were sold below fair value, tightening domestic supply and raising costs. Simultaneous outages in key Asian silicone plants amplified volatility. Smaller formulators lacking long-term contracts faced double-digit cost spikes that eroded margins and triggered product repricing. Producers hedge by dual-sourcing precursors and expanding in-house monomer capacity, but capital outlays delay immediate relief. Although raw-material swings are cyclical, they compress cash flow and hinder research and development spending in the short term.
VOC Limits on Solvent-Borne Systems
Revisions to NSF/ANSI/CAN 600 sliced allowable xylene, ethylbenzene, and toluene levels in potable-water coatings to near-trace amounts. South Coast AQMD Rule 1151 in California imposes lower-toxicity targets that paradoxically raise VOC if manufacturers swap exempt solvents, complicating compliance. Global majors accelerate water-reducible and powder development, but line-conversion costs and certification hurdles weigh on profitability. Regional patchworks of VOC caps obligate suppliers to maintain multiple formulations, swelling inventory complexity.
*Our forecasts treat driver/restraint impacts as directional, not additive. The impact forecasts reflect baseline growth, mix effects, and variable interactions.
Heat-Resistant Coatings Market Segment Analysis
By Resin:
Silicone Dominance Drives InnovationSilicone resins accounted for 37.45% of the 2025 heat-resistant coatings market share, reflecting the chemistry’s ability to tolerate temperatures above 600 °C without losing adhesion. That leadership is matched by the fastest segment CAGR of 8.78% through 2031, making silicone the pivotal growth engine of the heat-resistant coatings market. Demand spans exhaust stacks, flare stacks, bake ovens, and aerospace parts where failure is unacceptable. Epoxies retain relevance in mid-temperature zones but face cost headwinds and regulatory scrutiny on bisphenol-A derivatives. Acrylics fill price-sensitive applications in consumer goods where surface temperature peaks are lower.

By Technology:
Water-Borne Leadership Amid UV InnovationWater-borne systems secured 38.74% of 2025 revenue, underscoring wide acceptance in OEM and maintenance cycles. Formulators have solved early issues around humidity sensitivity, producing films that equal or exceed solvent-borne corrosion resistance. UV/EB-curable chemistries clock a 7.08% CAGR, fueled by near-instant curing and elimination of bake ovens. Powder coatings continue stable uptake in pipelines and appliance parts owing to 100% solids content and minimal waste, while solvent-borne technologies lose share under tightening VOC laws.
By End-User Industry:
Construction Stability Versus Power GrowthBuilding and construction generated 31.25% of the 2025 demand, providing the largest volume base for the heat-resistant coatings market. Continuous retrofits of curtain walls, fire doors, and structural steel keep orders steady. At the other end, the power sector posts a 9.55% CAGR through 2031, driven by higher-temperature turbines and peak-load balancing plants that run hotter for efficiency gains. Oil and gas remains another core user segment, applying ceramic-filled films to process pipes and flare stacks that see thermal shock.
The U.S. Department of Energy’s ultra-high-temperature TBC program for gas turbines targets operation above 1,300 °C, directly raising coating performance bars. Transportation applications, especially electric vehicles, demand lightweight coatings that dissipate battery heat while surviving possible thermal runaway events. Specialty applications in consumer goods, such as high-end cookware, extend the market’s breadth without materially shifting volume totals.
Geography Analysis
APAC Heat-Resistant Coatings Market
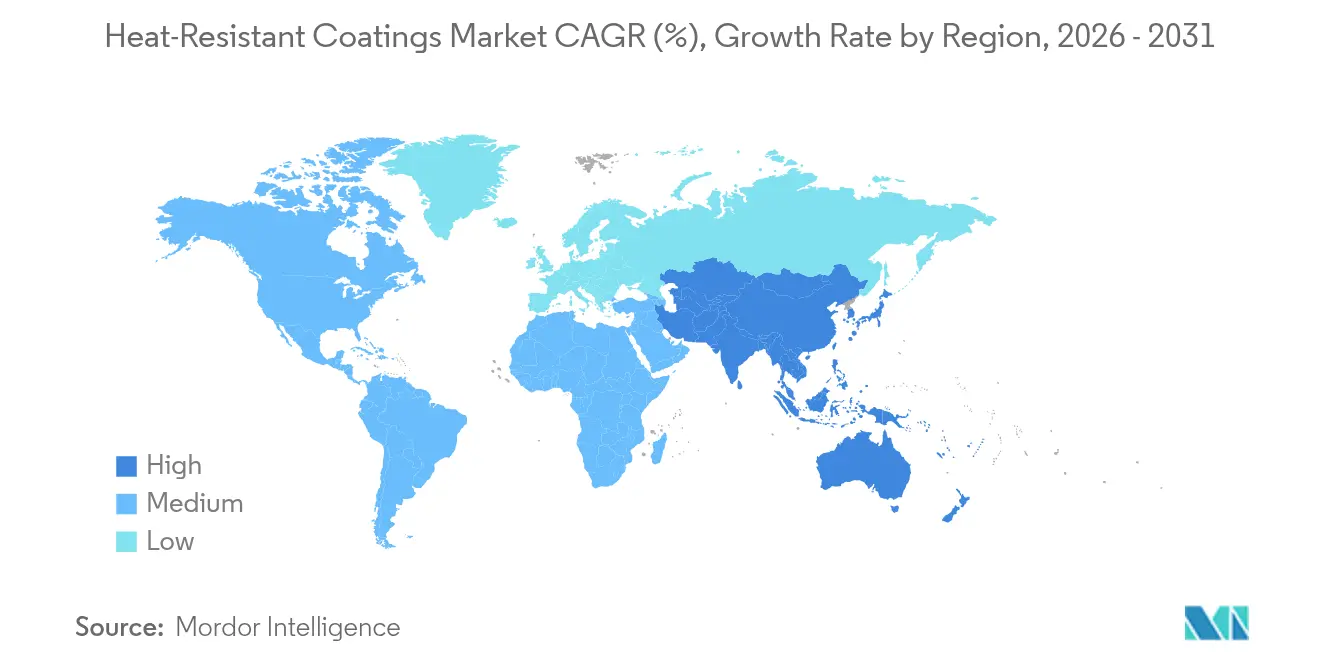
Asia-Pacific led with 47.12% of 2025 revenue and advances at 7.35% CAGR, powered by megaprojects in transport, housing, and energy. China’s Belt and Road corridors require heat-resistant primers for bridges and tunnels exposed to wildfire and chemical spill risks. India, under its Make in India vision, expands domestic manufacturing of cookstoves, boilers, and industrial ovens that all specify heat-stable films.
North America Heat-Resistant Coatings Market
North America remains an innovation center. Aerospace primes in the United States and Canada specify metallic and ceramic barrier coats qualified to MIL standards. Federal infrastructure outlays replace aging bridges and improve energy grids, each project mandating low-VOC, high-temperature finishes.
EMEA and South America Heat-Resistant Coatings Market
Europe emphasizes sustainability. EU VOC ceilings tighten yearly, pushing builders to waterborne silicones and powder options. Automotive platforms in Germany, France, and Italy integrate lightweight metal components coated with nano-structured ceramic films for thermal regulation. Markets in South America, the Middle East and Africa grow from a smaller base yet benefit from technology transfer and the adoption of international safety codes, widening the total addressable heat-resistant coatings market.
Regulatory Landscape
Heat-resistant coatings sit at the intersection of VOC control, hazardous-substance restrictions, and performance certification. In the United States, EPA requirements under 40 CFR 59.402 set VOC-content limits that shape architectural and maintenance coating formulations, reinforcing the market shift toward water-borne and other low-emission chemistries reflected in 2025-2026 procurement. Along with VOC rules, sector-specific qualification regimes influence demand in high-temperature aerospace and defense applications, where compliance with NASA specifications (for example, PRC-4002 and center-level specifications such as KSC-SPEC-F-0006 and MSFC-PROC-3747) can determine which thermal and corrosion-control coating suppliers get specified.
In Europe, compliance is increasingly driven by REACH and labeling requirements. The European Commission is progressing its restrictions work program in 2026, and the European Parliament and Council reached a June 2026 political agreement under the Omnibus VI package to simplify chemical labeling, including digital label allowances for small containers and defined timelines for label updates after reclassification. This direction tightens substance screening and documentation for industrial coatings placed on the EU market, raising compliance overhead for importers and formulators while encouraging substitution away from restricted chemistries. Standardization also plays a larger role, with ISO updates such as ISO 21452:2025 (thermal spray coatings) and ISO 15104:2025 (environmental testing for thermal control materials) providing reference points for qualifying coatings used in high-heat service environments.
Value Chain Analysis
The value chain starts with upstream feedstocks and specialty inputs, including silicone and epoxy intermediates, pigments and ceramic fillers, and additives plus solvents or water-based co-solvents. It then moves through resin synthesis, formulation and dispersion, testing and certification, packaging, and distribution into OEM and maintenance channels. Heat-resistant products also depend on application know-how, including surface preparation, multi-layer build design, curing control (ambient, bake, or UV/EB), and inspection practices, which often determine whether coatings meet fire-safety, corrosion, and thermal-cycling requirements. Market dynamics in 2025-2026 point to two bottlenecks inside this chain, price volatility in key resin families and an applicator skill shortage for multi-layer systems, both of which can lengthen lead times and increase installed-cost risk for asset owners.
Downstream, the chain is shaped more by service models and compliance milestones than by pure product shipment. Industrial end users in oil and gas, power, and processing prioritize coating systems that reduce corrosion under insulation and simplify maintenance cycles, encouraging suppliers to pair materials with application services and qualified contractor networks. Recent commercialization of advanced technologies reflects this shift, with new spray-applied thermal insulative coatings and emerging graphene-enhanced products moving through performance validation and, in some cases, regulatory clearance for distribution. Testing, approvals, and distributor-applicator partnerships increasingly function as value-capture points beyond formulation.
Competitive Landscape
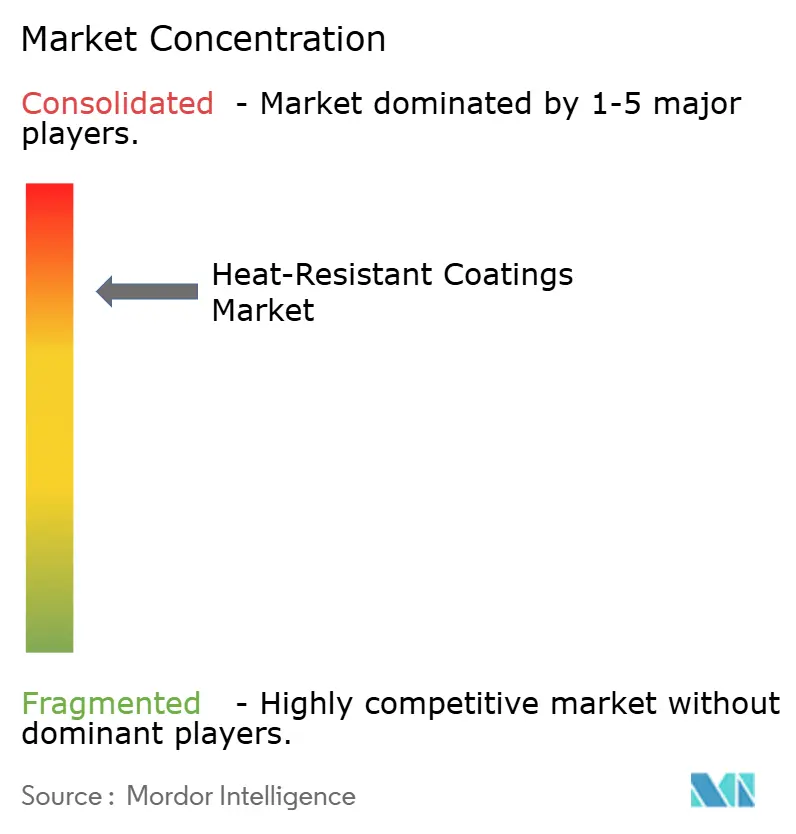
The sector remains highly consolidated. PPG Industries leverages global resin synthesis and local blending sites to shorten lead times. Sherwin-Williams balances a broad architectural footprint with specialized industrial coatings such as the Heat-Flex range, giving it scale plus niche depth. Technology investments center on robotic applications, digital inspection, and green chemistry. Suppliers embed sensors in film builds to track in-service temperature and signal maintenance needs.
Heat-Resistant Coatings Industry Leaders
-
Jotun
-
Akzo Nobel N.V.
-
PPG Industries, Inc.
-
The Sherwin-Williams Company
-
Kansai Paint Co. Ltd.
- *Disclaimer: Major Players sorted in no particular order
Heat-Resistant Coatings Market Companies Covered in this Report
- 3M
- Advanced Industrial Coatings
- AkzoNobel N.V.
- Aremco
- Arkema
- Axalta Coating Systems LLC
- BASF
- Belzona International Ltd.
- Hempel A/S
- Jotun
- Kansai Paint Co. Ltd.
- KCC Corporation
- Momentive
- PPG Industries Inc.
- Teknos Group
- The Sherwin-Williams Company
- Wacker Chemie AG
Market Opportunities and Future Outlook
Regulatory pressure on emissions and hazardous substances continues to open whitespace for water-borne, high-solids, powder, and UV/EB-curable heat-resistant systems that preserve high-temperature performance while simplifying compliance. In the United States, EPA VOC limits under 40 CFR 59.402 reinforce reformulation and line conversion activity across architectural and industrial maintenance categories. In Europe, REACH compliance and evolving labeling rules intensify substance-screening and documentation needs for coatings sold into the region. This environment supports opportunities for suppliers that can offer compliant, globally harmonized product families, along with the certification packages needed by owners operating multi-region asset fleets.
Performance-driven end markets are also expanding the addressable opportunity set toward multifunctional coatings that combine thermal management, corrosion protection, and easier application. Evidence of technology movement in 2026 includes commercialization steps for graphene-enhanced coatings, for example Graphene Manufacturing Group reporting large-scale corrosion-test milestones and progressing distribution into North America, and new spray-applied insulation-replacement coatings positioned to mitigate corrosion under insulation in industrial steel assets, for example Sherwin-Williams Heat-Flex AEB. In parallel, high-temperature materials research activity, including advances in bond coats and self-healing ceramic concepts reported in 2026, indicates a pipeline of next-generation solutions that can later translate into differentiated coating systems for turbines, petrochemical equipment, and aerospace thermal-cycling environments as qualification and scale-up hurdles are cleared.
Recent Industry Developments in Heat-Resistant Coatings Market
- July 2026: Seaforth Holdings confirmed the successful acquisition of Indestructible Paint Limited, a specialist supplier of high-endurance coatings used in aerospace and defense applications. The deal expands Seaforths exposure to heat-resistant and low-friction coating technologies and consolidates capability in a niche, qualification-heavy segment.
- November 2025: Jotun launched an intumescent fire-protection coatings line targeted at oil and gas applications. The introduction broadens product options for operators aligning passive fire protection with tighter fire-safety requirements in high-risk industrial environments.
- August 2024: PPG Industries launched PPG PITT-THERM 909 spray-on insulation, a silicone-based coating aimed at high-heat oil, gas, and petrochemical assets. The product positions coatings as an alternative to traditional insulation assemblies, aligning thermal management with durability needs in corrosive service.
Heat-Resistant Coatings Market Report Scope and Research Methodology
Market Definition and Coverage
For this methodology, the heat resistant coatings market includes protective coating materials formulated to withstand sustained high temperatures and thermal cycling, and then applied on substrates in industrial, infrastructure, and transportation settings to reduce heat damage and corrosion.
Scope exclusions: We exclude heat-resistant insulating boards and wraps, refractories, and standalone thermal barrier ceramic systems that are not sold as coatings.
Segments Covered in This Report
- By Resin
- Silicone
- Epoxy
- Acrylic
- Other Resins (Polyurethane, Alkyd, etc.)
- By Technology
- Solvent-borne
- Water-borne
- Powder
- UV/EB-curable
- By End-user Industry
- Building and Construction
- Oil and Gas
- Power Sector
- Transportation
- Woodworking and Furniture
- Consumer Goods
- Other End-user Industries (Industrial Processing Equipment, etc.)
- By Geography
- Asia-Pacific
- China
- India
- Japan
- South Korea
- Rest of Asia-Pacific
- North America
- United States
- Canada
- Mexico
- Europe
- Germany
- United Kingdom
- France
- Italy
- Rest of Europe
- South America
- Brazil
- Argentina
- Rest of South America
- Middle-East and Africa
- Saudi Arabia
- South Africa
- Rest of Middle-East and Africa
- Asia-Pacific
Data Sources, Market Sizing, and Validation
Desk Research
Desk research was used to set the market boundaries, build a clean list of demand centers, and collect the baseline indicators that explain coating demand by end use. We referenced public sources such as US Census Bureau construction and manufacturing data, USGS minerals and metals notes tied to industrial output, International Energy Agency power and fuel statistics, and Eurostat industrial production series, which helped anchor the pace of activity in key consuming industries.
To convert those activity signals into coating demand, we also leaned on sources such as UN Comtrade trade flows for relevant chemical and coating categories, patent databases for high-temperature resin and additive focus areas, plus company annual reports, investor presentations, and association publications for capacity additions and product mix commentary. Where needed, paid database subscriptions were used for company financials, news screening, and shipment-level import or export checks tied to coatings and raw material intermediates. These desk research sources are illustrative, and other public and paid references were also consulted to collect, validate, and clarify the final inputs.
Primary Interviews and Surveys
Primary work was used to test assumptions that are hard to read directly from public data, especially average selling price movement, technology mix shifts (water-borne versus solvent-borne), and the replacement cycle in hot-zone assets. We spoke with manufacturers, formulators, distributors, applicators, and large end users across major regions so gaps from desk research could be closed and key inputs cross-checked before finalizing the model.
Distribution of primary research fieldwork respondents
| Company type | Respondent position | Region |
|---|---|---|
| Top tier: 33% | CXOs: 15% | APAC: 47% |
| Mid tier: 51% | Functional/Unit leaders: 38% | EMEA: 31% |
| Smaller Players: 16% | Managers: 47% | Americas: 22% |
Market-Sizing & Forecasting
Sizing started with a top-down build where industrial output, construction activity, and energy asset additions were translated into a coated-area demand pool, then linked to typical coating usage rates and replacement intensity. Those totals were corroborated through selective bottom-up checks, including sampled supplier revenue reviews, channel discussions on volume direction, and spot validation of typical price bands by resin and technology.
Key inputs tracked in the model included power generation build and refurbishment activity, oil and gas and process industry maintenance intensity, transportation production trends, resin mix share (such as silicone versus epoxy), and the shift toward lower-VOC technologies that affects price points and adoption rates. Forecasting relied mainly on scenario analysis supported by a light multivariate regression view, where macro indicators and industry capex signals were adjusted using the consensus from expert interviews. Where bottom-up coverage was incomplete, gaps were handled using proxy usage rates from adjacent end uses, and then re-checked with primary feedback before being scaled into regional totals.
Data Validation & Update Cycle
Model outputs were validated through triangulation across independent signals, including regional industrial production trends, trade movement cues, and the direction of price changes for key resins and additives. Outliers were reviewed in steps, first by checking whether a scope boundary or unit conversion caused the variance, and then by re-checking the underlying demand driver with fresh desk research or a follow-up call.
Before sign-off, the work is reviewed by another analyst to confirm that assumptions remain consistent across regions and end uses, and that growth rates do not break known capacity, regulatory, or supply constraints. Reports are refreshed annually, with interim updates triggered when material events occur, such as sharp raw material swings, major shutdowns, or meaningful regulatory changes. A final pass is completed right before delivery so clients receive the most current market view.
Mordor Intelligence's Heat Resistant Coatings Market Size Compared With Other Published Estimates
Published market sizes for heat resistant coatings can differ even when the topic sounds identical, mainly because the product boundary, the year used for sizing, and the way prices are converted into USD are not handled the same way. Differences also show up when some studies mix adjacent categories (like ceramic thermal barriers or insulation products) into the same total, or when they project aggressive adoption without checking the replacement-driven part of demand.
By tracking technology mix shifts and end-use demand indicators, Mordor Intelligence ties the estimate to defined coating use cases, and this keeps the 2026 total aligned with realistic consumption and pricing behavior instead of being widened by neighboring materials.
Benchmark comparison
| Source | Market Size | Gaps in Research Methodology |
|---|---|---|
| Mordor Intelligence | USD 7.26 B (2026) | |
| Trade Research Group A | USD 6.80 B (2024) | Uses a different base year and can understate the 2026 level if price progression and post-2024 project restarts are not carried forward consistently across regions. |
| Industry Publisher B | USD 7.38 B (2025) | The scope can lean broader in practice if some high-heat surface protection materials are counted alongside coatings, and currency timing can shift the USD total when regional price inflation is high. |
The spread in the table is mostly explained by year alignment and by how tightly the boundary is kept around coating products versus adjacent heat protection materials. When the demand pool is rebuilt from end-use activity and then checked with realistic price and mix movement, the resulting number is easier to trace and repeat across updates.
Key Questions Answered in the Report
What is the current size of the heat-resistant coatings market?
The market stands at USD 7.26 billion in 2026 and is projected to hit USD 9.28 billion by 2031 on a 5.03% CAGR.
Which region leads the heat-resistant coatings market?
Asia-Pacific holds 47.12% of 2025 revenue and is also the fastest-growing region at 7.35% CAGR through 2031.
Why are silicone-based coatings growing so fast?
Silicone commands 37.45% market share and grows at 8.78% CAGR because it withstands temperatures above 600 °C without losing adhesion, making it ideal for high-heat industrial and aerospace uses.
How are VOC regulations affecting technology choices?
Tighter VOC caps in North America and Europe shift buyers toward water-borne and UV-curable systems, reducing reliance on solvent-borne coatings and driving innovation in low-emission chemistries.
Which end-user industry will grow the quickest?
The power sector shows the fastest expansion at 9.55% CAGR as utilities upgrade turbines and adopt higher operating temperatures to improve efficiency.