Global Healthcare Mobility Solutions Market Size and Share
Market Overview
| Study Period | 2020 - 2031 |
|---|---|
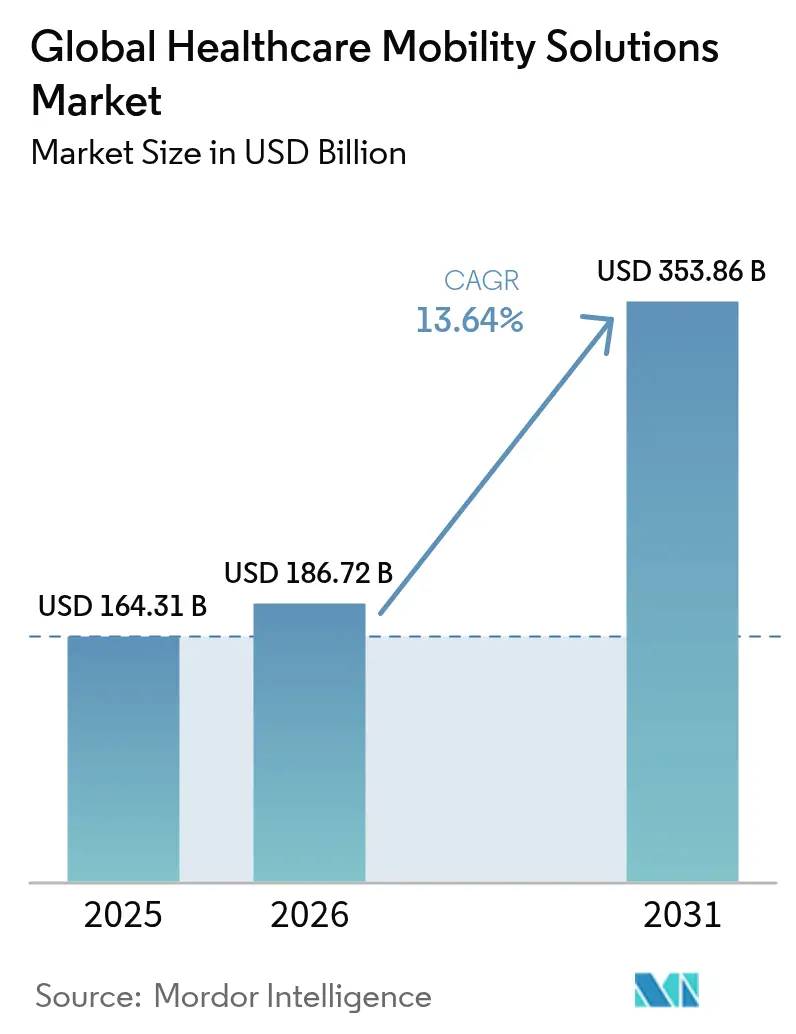
| Market Size (2026) | USD 186.72 Billion |
| Market Size (2031) | USD 353.86 Billion |
| Growth Rate (2026 - 2031) | 13.64% CAGR |
| Fastest Growing Market | Asia-Pacific |
| Largest Market | North America |
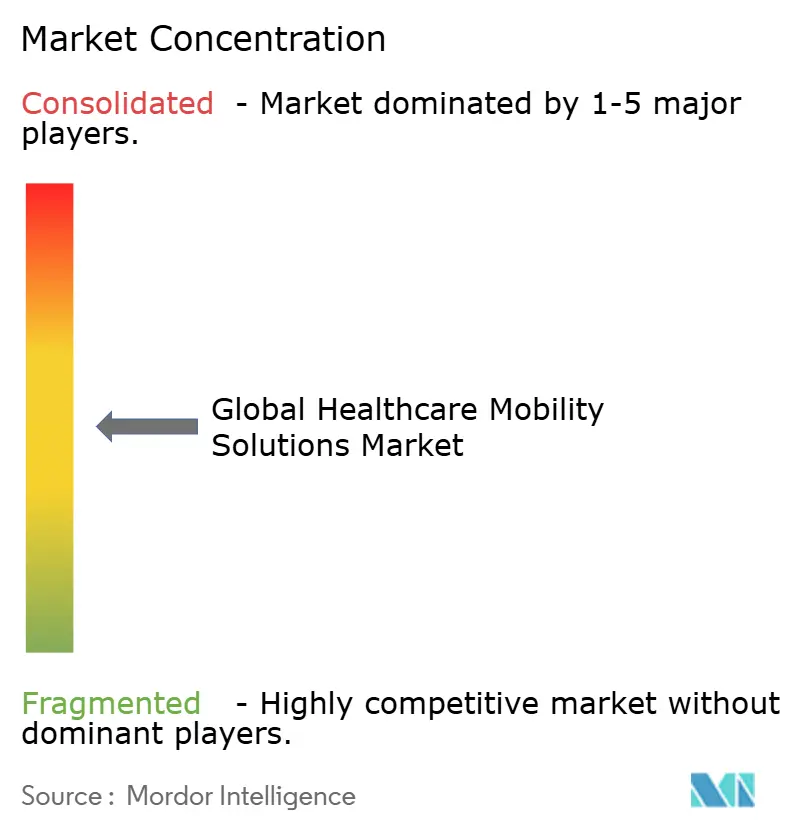
| Market Concentration | Medium |
Major Players *Disclaimer: Major Players sorted in no particular order Image © Mordor Intelligence. Reuse requires attribution under CC BY 4.0. | |
Global Healthcare Mobility Solutions Market Analysis by Mordor Intelligence
Healthcare mobility solutions market size in 2026 is estimated at USD 186.72 billion, growing from 2025 value of USD 164.31 billion with 2031 projections showing USD 353.86 billion, growing at 13.64% CAGR over 2026-2031. Across the forecast horizon, hospitals, clinics, payers, and technology firms invest in mobile platforms that improve care coordination, enable real-time monitoring, and shift services into homes and community settings. 5G private networks, edge AI, and cloud interoperability combine to support latency-sensitive applications such as remote surgery and continuous glucose monitoring, while new FDA guidance for AI-enabled devices provides a clearer commercialization pathway. Vendors that deliver secure, HIPAA-compliant architectures gain an immediate advantage as ransomware activity pushes cybersecurity to the top of procurement criteria[1]Compliance Cosmos, “HIPAA Security Rule Overview,” compliancecosmos.org. Clinician shortages further accelerate adoption, because mobile tools automate documentation and workforce scheduling, lowering operating costs and reducing burnout.
Key Report Takeaways
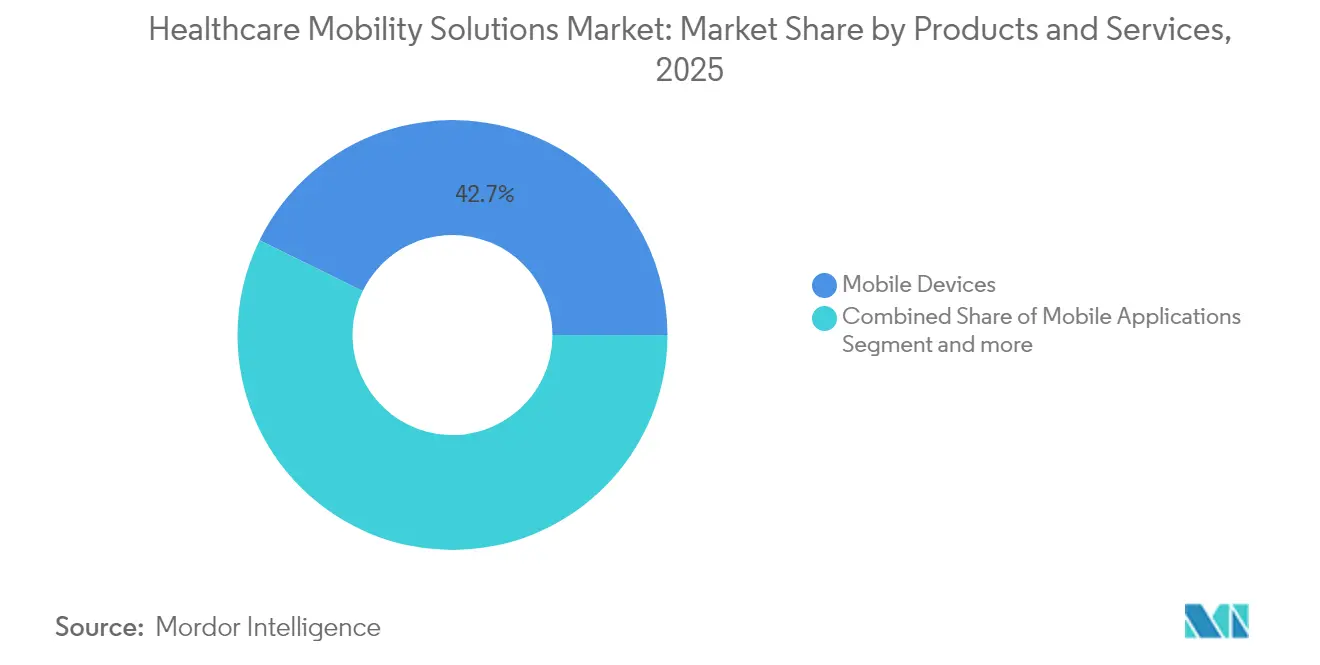
- By product, Mobile Devices held 42.73% of healthcare mobility solutions market share in 2025; Mobile Applications expand fastest at a 14.22% CAGR through 2031.
- By application, Enterprise Solutions accounted for 61.88% revenue share in 2025, whereas mHealth Applications advance at 14.28% CAGR to 2031.
- By deployment model, cloud platforms captured 50.74% share in 2025 and are set to grow at 13.87% CAGR.
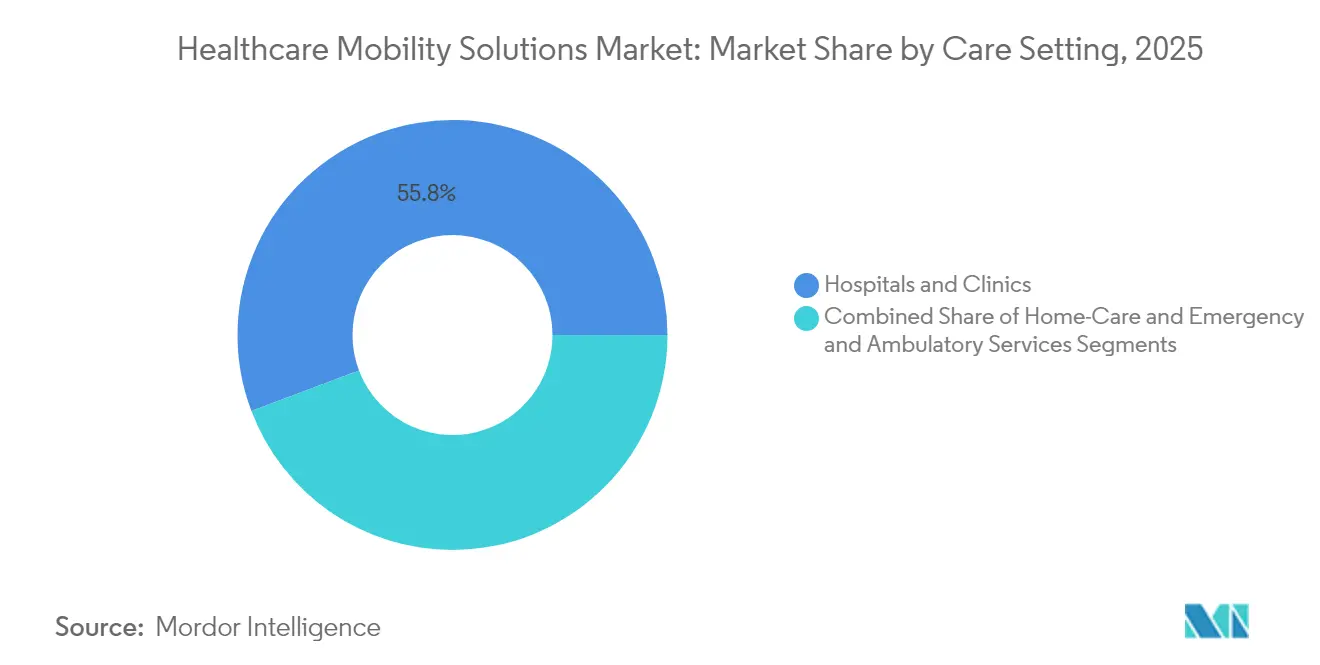
- By care setting, Hospitals & Clinics retained 55.76% share in 2025, while Emergency & Ambulatory Services expand most quickly at a 14.12% CAGR.
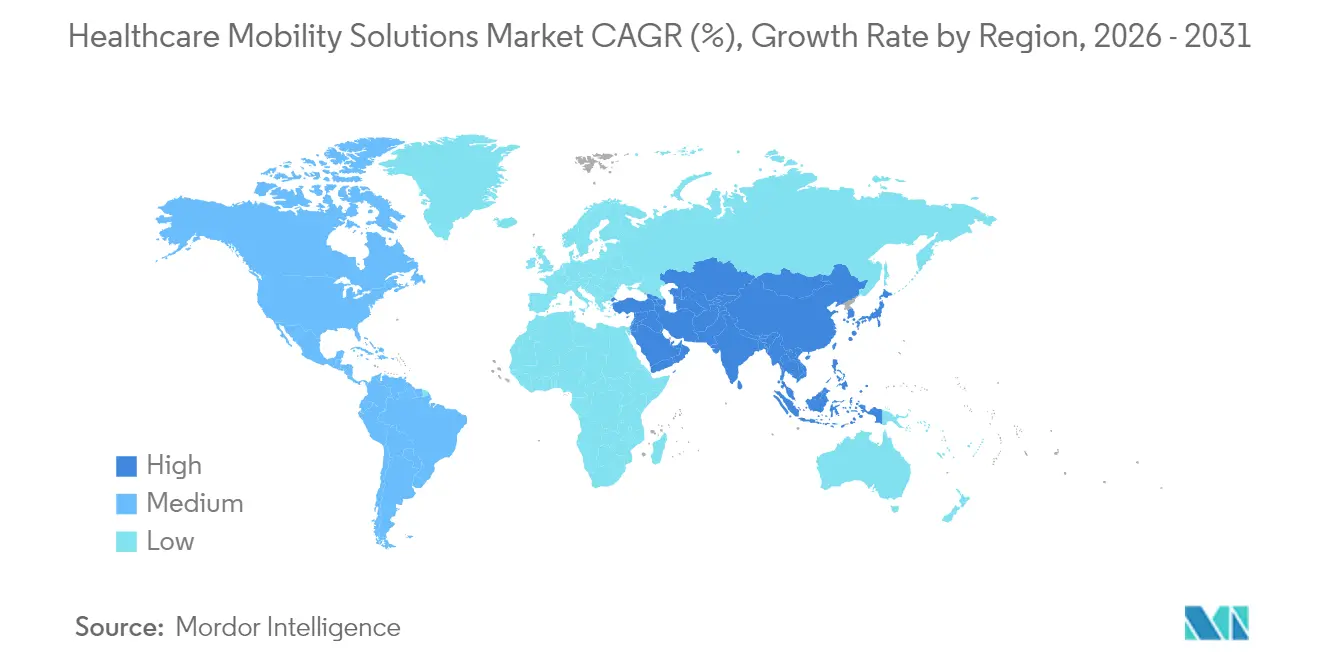
- By geography, North America led with 42.11% share in 2025; Asia-Pacific registers the strongest regional CAGR of 14.37%.
Note: Market size and forecast figures in this report are generated using Mordor Intelligence’s proprietary estimation framework, updated with the latest available data and insights as of 2026.
Global Healthcare Mobility Solutions Market Trends and Insights
Drivers Impact Analysis*
| Driver | ~ % Impact on CAGR Forecast | Geographic Relevance | Impact Timeline |
|---|---|---|---|
| Tele-medicine and RPM expansion | +2.8% | Global, rural North America and emerging APAC markets | Short term (≤ 2 years) |
| Rising smartphone & wearable adoption | +2.1% | Global, strongest in Asia-Pacific and North America | Medium term (2-4 years) |
| Need to cut clinical workflow costs | +2.0% | North America and EU, growing in APAC | Medium term (2-4 years) |
| Hospital-at-home roll-outs | +1.9% | North America leading, early EU and Australia uptake | Medium term (2-4 years) |
| 5G private networks for low-latency mobility | +1.7% | Urban centers in North America, EU, China, Japan | Long term (≥ 4 years) |
| Spatial-computing AR surgical apps | +1.4% | Advanced markets in North America, EU, select APAC | Long term (≥ 4 years) |
| Source: Mordor Intelligence | |||
Expansion of Tele-medicine & RPM Programs
US patient participation in remote patient monitoring (RPM) is projected to reach 70.6 million in 2025, up from 29 million in 2020. Mayo Clinic’s Advanced Care at Home model has treated more than 2,000 patients with infection rates below inpatient norms and lower readmissions. CMS waivers now let 320-plus hospitals deliver acute care at home, moving hospital-level services into living rooms . Cleveland Clinic’s AI-based virtual triage system has reached 94% diagnostic accuracy and eased emergency department congestion. Hybrid, “click-and-brick” models that blend video, messaging, and in-person follow-ups stretch fixed resources and raise patient satisfaction.
Rising Adoption of Smartphones & Wearables
More than 80% of adults in Asia-Pacific now own a smartphone, enabling hospitals to deliver coaching, medication reminders, and biometrics directly to patients. Researchers at the University of Hong Kong have demonstrated organic electrochemical transistors that turn soft microelectronics into standalone AI wearables capable of on-skin analytics. The FDA’s 2025 clearance of the Stelo continuous glucose monitor for retail purchase illustrates the shift from prescription-only devices to consumer channels. As consumer devices gain clinical accuracy, data flows seamlessly into electronic records, allowing clinicians to spot trends before adverse events occur. Predictive insights generated on-device reduce emergency visits and make chronic-care economics more sustainable.
Need to Cut Clinical Workflow Costs
Administrative overhead consumes 25% of total US health spending, so executives target mobile tools that trim documentation time. Epic’s Rover app lets nurses complete bedside tasks in 8.7 minutes versus 94.5 minutes at desktop stations, while medication errors fall by one-third. Mercy saved USD 30.7 million in 2023 using AI scheduling that reduced agency staff needs. Microsoft and Epic are developing voice-driven charting that captures clinician-patient conversations automatically. Real-time location systems combined with mobile alerts shorten average patient wait time and raise bed turnover by double-digit percentages.
Hospital-at-home Roll-outs
Mass General Brigham plans to move 10% of medical admissions to in-home settings, aiming for lower costs and higher patient comfort. Mayo Clinic reports 30-day readmissions of 11.2% and mortality of 1.8%, matching inpatient safety while cutting total episode cost by up to 30%. The FDA’s Home as a Health Care Hub initiative promotes at-home diabetes programs that rely on continuous mobile monitoring. Kaiser Permanente’s service has scaled to cover 9% of its daily census, trimming average length of stay by almost two days. Mobile dashboards that coordinate supplies, labs, and nurse visits are indispensable to these distributed clinical networks.
Restraints Impact Analysis*
| Restraint | ~ % Impact on CAGR Forecast | Geographic Relevance | Impact Timeline |
|---|---|---|---|
| Cyber-security and HIPAA/GDPR risks | -1.8% | Global, stricter in EU and North America | Short term (≤ 2 years) |
| Shortage of digital-health talent | -1.6% | Global, acute in North America and mature APAC markets | Medium term (2-4 years) |
| Legacy EMR vendor lock-in to mobile APIs | -1.1% | Global | Medium term (2-4 years) |
| Battery & ruggedisation costs for medical devices | -0.7% | Emerging cost sensitive regions | Medium term (2-4 years) |
| Source: Mordor Intelligence | |||
Cyber-security & HIPAA/GDPR Risks
Cybercriminals increasingly target mobile endpoints, forcing providers to harden authentication, encryption, and patch management. Many hospital networks run legacy operating systems that cannot support modern zero-trust strategies, making full compliance difficult. EU regulators have begun levying sizeable fines for GDPR violations involving unencrypted mobile data transfers. Rural facilities flagged mobile security as a prerequisite for new telehealth grants awarded in 2025. Balancing tight security with clinician usability remains a central adoption barrier during the next two years.
Shortage of Digital-health Talent
Demand for engineers, data scientists, and clinical informaticists outstrips supply, delaying go-lives at many health systems. Budget limits reduce the ability to compete with Big Tech salaries, leading CIOs to rely on external integrators and managed services. Continuous platform updates require frequent retraining that frontline staff struggle to absorb amid heavy patient loads. Resistance grows when benefits are unclear, so change-management programs that show time savings are critical. Workforce development partnerships with universities and community colleges begin to expand the pipeline, but impact will take several years to materialize.
*Our forecasts treat driver/restraint impacts as directional, not additive. The impact forecasts reflect baseline growth, mix effects, and variable interactions.
Segment Analysis
By Products & Services: Mobile Applications Drive Innovation
Mobile Applications post the fastest 14.22% CAGR through 2031, even though Mobile Devices commanded 42.73% of 2025 revenue. The FDA’s 2024 decision to classify digital therapeutics for ADHD as Class II devices widened reimbursement pathways, making software-only products commercially viable. Enterprise platforms from Epic and Oracle Cerner now bundle secure messaging, single-sign-on, and device tracking, simplifying rollouts. The healthcare mobility solutions market repeatedly rewards vendors that leverage existing consumer smartphones instead of specialized hardware, reducing capital expenditure for providers.
Mobile Devices stay relevant for infection-resistant casings, battery hot-swap, and barcode medication administration. Yet the declining price of rugged consumer tablets narrows the gap, slowing hardware growth. Platform vendors that combine device agnosticism with tight EHR integration gain share by limiting IT complexity. AI-infused applications extend beyond vital-sign dashboards into medication titration, opioid stewardship, and rehabilitation coaching, pushing software front and center in purchasing decisions.


By Application: Enterprise Solutions Dominate While mHealth Surges
Enterprise Solutions represented 61.88% of 2025 spending thanks to long-standing procurement cycles and bundled EHR contracts. Guthrie Clinic’s virtual care hub saved USD 7 million in wages and cut nurse turnover by half, proving the financial upside of mobility at scale. Automated note capture, ambient dictation, and real-time analytics are now staples of enterprise roadmaps across North America and Europe.
mHealth Applications, advancing 14.28% annually, tap a younger, tech-savvy audience that tracks steps, sleep, and blood glucose daily. Direct-to-consumer channels bypass insurance codes, giving start-ups quicker feedback loops and iterative product pathways. The healthcare mobility solutions market size for mHealth is expected to widen further as employers integrate wellness apps into benefit plans and payers roll out digital-first coverage.
By End User: Providers Lead While Patient Segment Accelerates
Provider organizations owned 58.66% of revenue in 2025, reflecting capital budgets for EMR extensions and device fleets. Philips and smartQare are piloting wearable biosensors that stream vitals directly into command centers, giving nurses an up-to-the-minute clinical picture. Hospitals favor single-vendor suites that merge admissions, pharmacy, and imaging modules under one dashboard.
The Patient end-user bracket grows at 13.78% CAGR, buoyed by rising health-literacy and digital-payment adoption. FDA programs that designate the home as a healthcare node legitimize at-home chronic-care kits. As a result, the healthcare mobility solutions market continues to blur traditional lines between facility-based and consumer-led care.
By Care Setting: Hospitals Lead While Emergency Services Surge
Hospitals & Clinics generated 55.76% of 2025 spending, underscoring their dominance in high-acuity care. Real-time location systems tied to mobile alerts improved bed turnover by 11% in multicenter trials. However, Emergency & Ambulatory Services expand at 14.12% CAGR because point-of-care teams demand rugged apps that expedite triage and imaging orders in transit.
Hospital-at-home environments rely on virtual wound checks, Bluetooth spirometers, and on-call physicians connected via secure tablets. The healthcare mobility solutions market share derived from these distributed settings is set to climb as payers reimburse more episodes managed outside facilities. Ambulance crews equipped with cloud-linked ultrasound now transmit images directly to stroke centers, shaving precious minutes off door-to-needle times.
By Deployment Mode: Cloud Dominance Accelerates
Cloud platforms accounted for 50.74% of total spend in 2025 and are expanding at a 13.87% CAGR. Philips and Amazon Web Services have added generative AI that drafts radiology reports and flags critical findings, boosting throughput by up to 20%. Subscription pricing aligns costs with usage, enabling regional hospitals to access advanced analytics without capital outlay.
On-premise systems still appeal to defense hospitals and academic centers that handle sensitive genomics data. Hybrid architectures that keep image archives on-site while pushing encounter data to the cloud are becoming common. The healthcare mobility solutions market size for cloud deployment is projected to widen as zero-trust architectures convince security teams that regulated workloads can reside off-premise.
Geography Analysis
North America commanded 42.11% of 2025 revenue because of mature reimbursement models, regulatory clarity, and an installed base of EHRs ready for mobile extensions. More than 320 US hospitals now hold CMS waivers for acute care at home, anchoring broad investment in logistics apps, dashboards, and 5G routers. Canadian provinces subsidize virtual consults to reach remote communities, while Mexico’s private hospitals adopt mobile triage to offset clinician shortages.
Europe delivers steady adoption as cross-border standards mature. The European Health Data Space initiative promotes interoperable APIs that integrate wearables, imaging, and lab feeds. Germany funds 6G medicine research, and the UK co-authors transparency frameworks for machine-learning diagnostics with US partners. These programs help the healthcare mobility solutions market build trust in AI prognostics across the region.
Asia-Pacific records the highest 14.37% CAGR. With 1.8 billion mobile subscribers, the region trails only North America in 5G penetration. Chinese surgeons have performed remote gastrectomies over standalone 5G, creating global headlines and regulatory momentum. India’s new reimbursement codes for digital-first care, plus Japan’s AI diabetic retinopathy screening, add scale. In Southeast Asia, start-ups raised USD 1.5 billion for telehealth in 2024, illustrating venture confidence in the healthcare mobility solutions market.

Competitive Landscape
The healthcare mobility solutions market features moderate fragmentation. Epic Systems and Oracle Cerner defend large footprints by embedding secure chat, bar-code meds, and clinician tools inside their core EHR apps. Microsoft deepens its presence through Azure Health Data Services, an Epic co-development deal for generative documentation, and partnerships with Providence for AI oncology. Apple leverages the HealthKit framework plus device-level security to entice hospitals building BYOD programs, while Samsung offers rugged tablets and Knox security built to HIPAA specifications.
Regulation favors agile software companies. The FDA’s new predetermined change-control plans allow AI algorithms to learn continuously once guardrails are in place[2]Food and Drug Administration, “Guidance for Clinical Decision Support Software,” fda.gov. Philips collaborates with NVIDIA to embed foundation models into MRI consoles, shrinking scan times and radiologist clicks[3]Philips, “Philips and NVIDIA to Advance AI in Medical Imaging,” philips.com.
Start-ups focusing on staff-facing chatbots and workflow analytics raise funding by targeting pain points like nurse overtime. As interoperability APIs open, best-of-breed apps gain traction, yet hospital CIOs still prefer integrated suites for enterprise risk management. Consequently, mergers such as Commure-Athelas-Augmedix illustrate a drive to build full-stack offerings that cover virtual scribing, revenue cycle, and care coordination in one license.
Global Healthcare Mobility Solutions Industry Leaders
Mckesson Corporation
Cisco Systems Inc.
Zebra Technologies Corp
Oracle Cerner
Omron Corporation
- *Disclaimer: Major Players sorted in no particular order

Recent Industry Developments
- May 2025: Philips teamed with NVIDIA to add AI foundation models to MRI scanners, enabling zero-click planning and real-time image enhancement.
- March 2025: GE HealthCare and NVIDIA unveiled AI-enabled X-ray and ultrasound that automate repetitive positioning tasks to ease workforce shortages.
- February 2025: Philips and Mass General Brigham launched a project to stream near real-time device data into clinical records for continuous cardiac monitoring.
- November 2024: Philips broadened its Amazon Web Services alliance to embed generative AI in HealthSuite, targeting 15%-20% efficiency gains in reporting.


Research Methodology Framework and Report Scope
Market Definitions and Key Coverage
Mordor Intelligence defines the healthcare mobility solutions market as the aggregate revenue generated by mobile devices, enterprise mobility platforms, and native or third-party healthcare applications that enable real-time clinical data exchange, workflow automation, and patient engagement across provider, payer, and home-care settings. Solutions must run on portable hardware such as smartphones, tablets, rugged handhelds, or wearables and integrate with electronic health records or back-office systems to qualify.
Scope exclusion: standalone consumer wellness apps that collect data but do not interface with a regulated healthcare workflow are kept outside this study.
Segmentation Overview
- By Products & Services
- Mobile Devices
- Mobile Applications
- Enterprise Mobility Platforms
- By Application
- Enterprise Solutions
- mHealth Applications
- By End User
- Providers
- Payers
- Patients
- By Care Setting
- Hospitals & Clinics
- Home-Care / Hospital-at-Home
- Emergency & Ambulatory Services
- By Deployment Mode
- Cloud-based
- On-premise
- Geography
- North America
- United States
- Canada
- Mexico
- Europe
- Germany
- United Kingdom
- France
- Italy
- Spain
- Rest of Europe
- Asia-Pacific
- China
- Japan
- India
- South Korea
- Australia
- Rest of Asia-Pacific
- Middle East and Africa
- GCC
- South Africa
- Rest of Middle East and Africa
- South America
- Brazil
- Argentina
- Rest of South America
- North America
Detailed Research Methodology and Data Validation
Primary Research
Mordor analysts interviewed hospital CIOs, tele-health platform architects, device OEM product managers, and digital-health insurers across North America, Europe, and key Asia-Pacific markets. These discussions validated device procurement cycles, subscription pricing, average daily active users, and regional policy triggers that are rarely documented publicly.
Desk Research
Our desk work began with authoritative statistical portals such as the OECD Health Statistics, CMS Medicare data, and WHO Global Digital Health Observatory, which ground the model in credible patient volumes and reimbursement trends. Trade bodies like the Healthcare Information & Management Systems Society and GSMA mHealth Knowledge Center provided install-base indicators for connected devices, while peer-reviewed journals in JMIR shed light on utilization rates of mobile apps in chronic-care programs. Financial filings and investor transcripts were mined to benchmark average selling prices and product mix shifts. Paid databases, including D&B Hoovers for company financials and Dow Jones Factiva for deal flow, supplemented these open sources. The sources cited illustrate the range consulted; many others supported granular checks and clarifications.
Market-Sizing & Forecasting
A top-down demand pool was built from inpatient and outpatient visit volumes, smartphone penetration among clinicians, and observed BYOD adoption, which are then multiplied by validated per-user spend benchmarks. Select bottom-up cross-checks, such as sampled vendor revenue roll-ups and channel inventory scans, tempered any outliers. Core variables include 4G/5G coverage, remote patient monitoring enrollment, average selling price of rugged clinical handhelds, EHR integration rates, and tele-consult reimbursement ceilings. Forecasts to 2030 rely on multivariate regression blended with ARIMA to capture cyclical device refresh patterns, with scenario tweaks vetted by our primary experts. Assumption gaps, for example, in emerging markets, were bridged using proxy indicators like nurse-to-bed ratios before final triangulation.
Data Validation & Update Cycle
Model outputs pass three layers of variance checks versus shipment data, hospital IT budgets, and publicly reported vendor revenue. Anomalies prompt re-contact of domain specialists. The report receives a full refresh every twelve months, with interim revisions whenever material events, such as major regulation, mega-merger, or supply shock, occur.
Why Mordor's Healthcare Mobility Solutions Baseline Earns Trust
Published market figures often diverge because firms pick different product mixes, currency conversions, and refresh cadences.
Key gap drivers include wider device baskets counted by some publishers, aggressive uptake assumptions for Asia-Pacific, or reliance on dated ASP curves. Mordor reports only regulated clinical mobility products, applies midpoint ASPs verified with procurement heads, and recalibrates annually, ensuring a balanced baseline.
Benchmark comparison
| Market Size | Anonymized source | Primary gap driver |
|---|---|---|
| USD 164.31 B (2025) | Mordor Intelligence | - |
| USD 206.20 B (2024) | Global Consultancy A | Includes consumer fitness apps and home-fitness wearables |
| USD 113.08 B (2025) | Research Publisher B | Uses conservative smartphone penetration and excludes cloud platform fees |
| USD 164.53 B (2024) | Industry Journal C | Applies static exchange rates and three-year forecast refresh cycle |
These comparisons show that while external totals swing widely, Mordor's disciplined scope selection, frequent updates, and transparent variable mapping provide decision-makers with a dependable starting point.


Key Questions Answered in the Report
What is the current value of the healthcare mobility solutions market?
The market reaches USD 186.72 billion in 2026 and is projected to hit USD 353.86 billion by 2031 as investments accelerate.
Which product segment grows fastest?
Mobile Applications expand at 14.22% CAGR through 2031, reflecting a shift toward software-driven care delivery.
Why are hospitals investing in 5G private networks?
Private 5G offers ultra-low latency needed for remote surgery, continuous monitoring, and high-resolution imaging inside complex facilities.
How do hospital-at-home programs impact costs?
Studies from Mayo Clinic show cost reductions of 19%-30% compared with traditional inpatient care while maintaining comparable safety.
What cyber-security challenges do mobility projects face?
Expanding mobile endpoints enlarge attack surfaces; providers must meet HIPAA and GDPR mandates through encryption, device management, and zero-trust architectures.
Which region records the highest growth rate?
Asia-Pacific leads with a 14.37% CAGR thanks to widespread mobile adoption, 5G rollouts, and supportive government initiatives.
Page last updated on:


