
Healthcare IT Provider Market Size and Share
Market Overview
| Study Period | 2020 - 2031 |
|---|---|
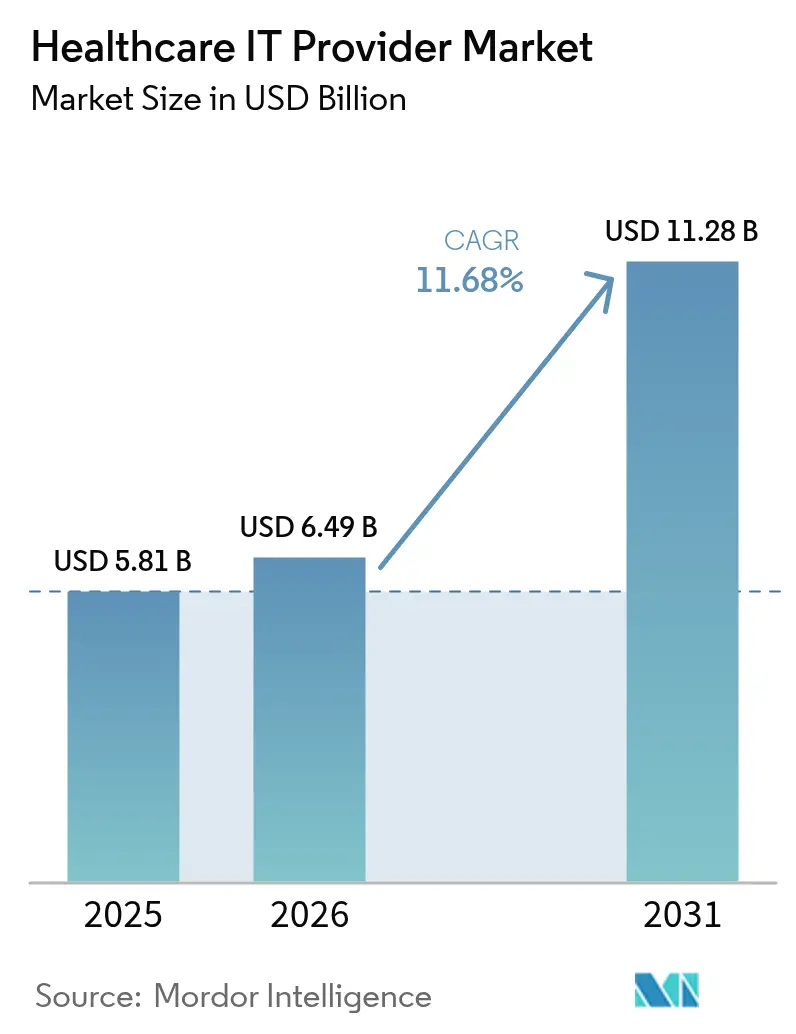
| Market Size (2026) | USD 6.49 Billion |
| Market Size (2031) | USD 11.28 Billion |
| Growth Rate (2026 - 2031) | 11.68 % |
| Fastest Growing Market | Asia Pacific |
| Largest Market | North America |
| Market Concentration | Medium |
Major Players *Disclaimer: Major Players sorted in no particular order Image © Mordor Intelligence. Reuse requires attribution under CC BY 4.0. | |
Healthcare IT Provider Market Analysis by Mordor Intelligence
The Healthcare IT Provider market size was valued at USD 5.81 billion in 2025 and estimated to grow from USD 6.49 billion in 2026 to reach USD 11.28 billion by 2031, at a CAGR of 11.68% during the forecast period (2026-2031). This surge reflects a decisive shift toward cloud-native clinical platforms, the widening use of AI-driven workflow tools, and regulatory mandates that hard-wire interoperability and cybersecurity into every new deployment. North America’s mature provider networks keep adoption rates high, but Asia-Pacific’s reimbursement reforms are moving the region up the growth charts at a 14.40% CAGR. Epic Systems’ ability to integrate more than 625 hospitals into the federal TEFCA exchange shows how network effects can safeguard first-mover advantage. Meanwhile, the Change Healthcare cyberattack has accelerated defensive spending, with U.S. health systems channeling 52% of new IT dollars into security controls.
Key Report Takeaways
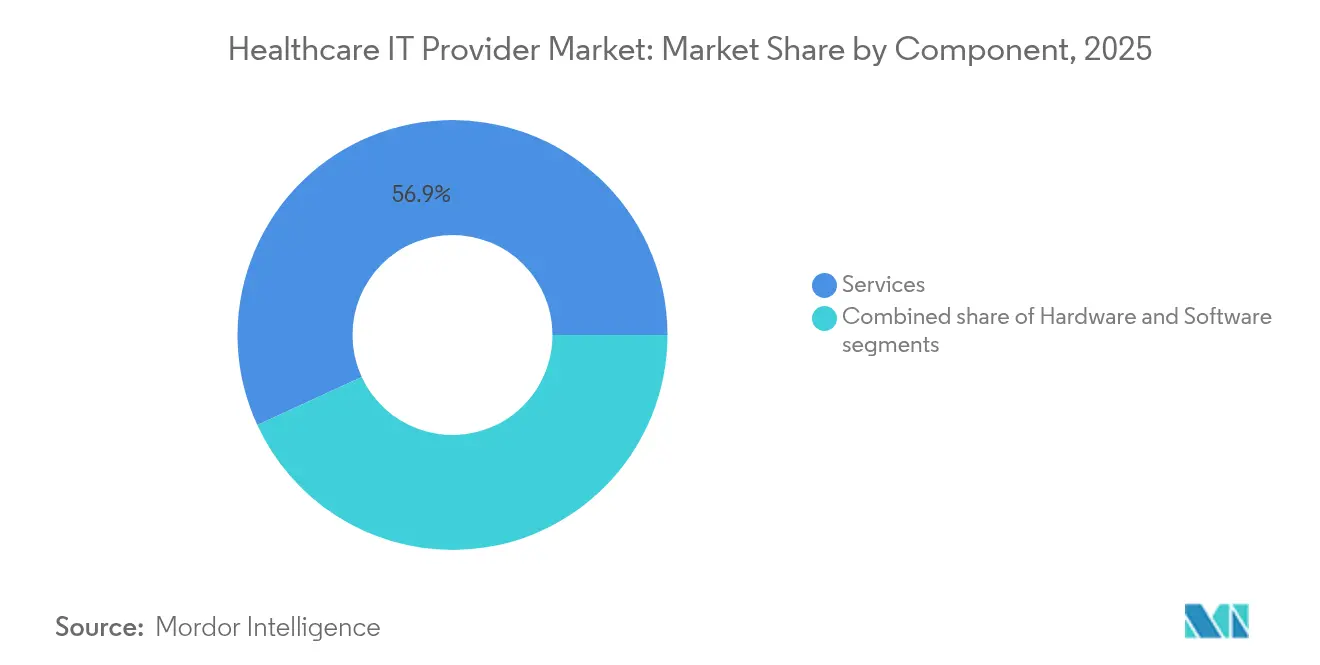
- By component, services led with 56.88% revenue share in 2025, while products posted the fastest 13.02% CAGR through 2031.
- By application, hospital interface/EHR integration captured 40.22% of Healthcare IT Provider market share in 2025; medical-device integration is projected to expand at an 11.74% CAGR to 2031.
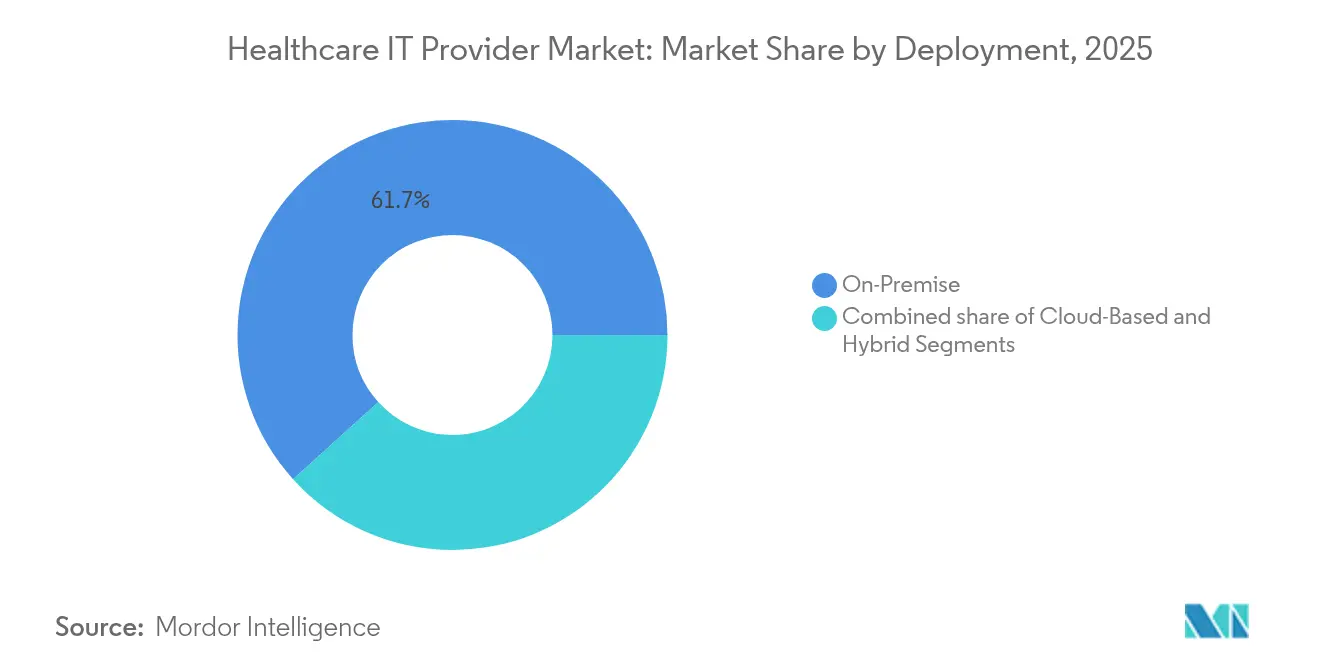
- By deployment, on-premise solutions held 61.70% share of the Healthcare IT Provider market size in 2025, whereas cloud-based models are rising at a 12.18% CAGR through 2031.
- By end-user, hospitals and clinics accounted for 63.55% share in 2025 and imaging centers are advancing at a 11.86% CAGR through 2031.
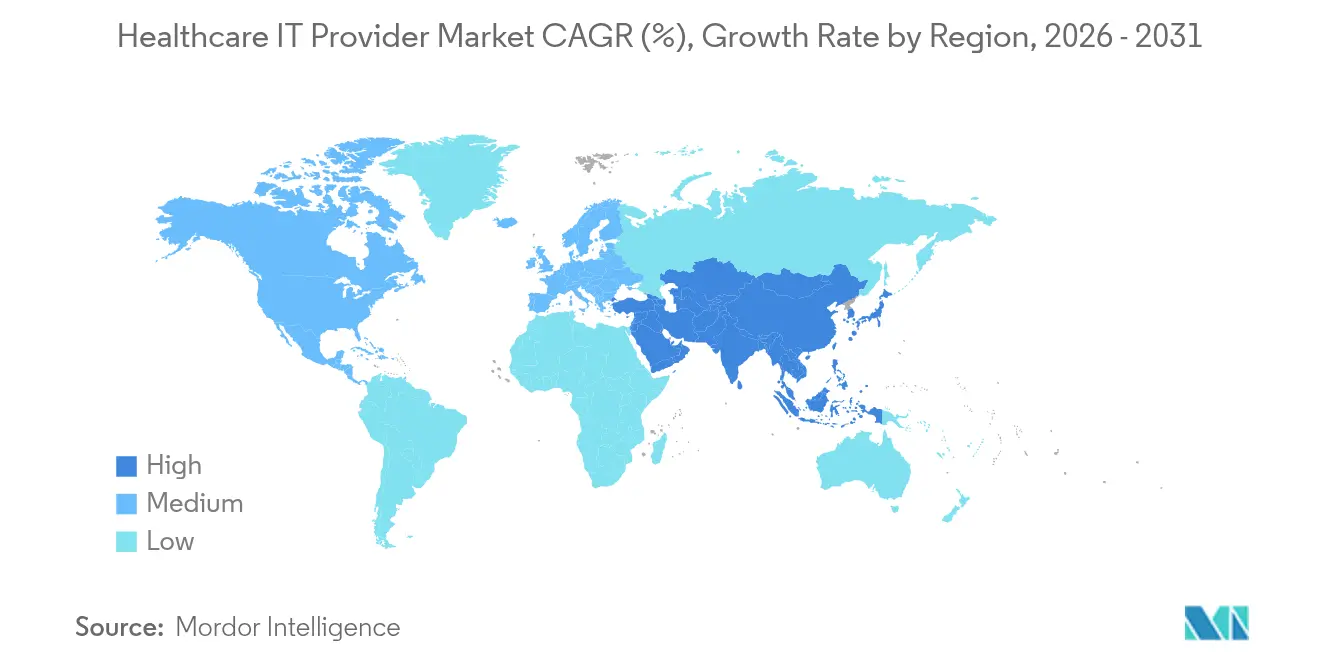
- By geography, North America led with 43.10% revenue share in 2025; Asia-Pacific records the highest 14.11% CAGR to 2031.
Note: Market size and forecast figures in this report are generated using Mordor Intelligence’s proprietary estimation framework, updated with the latest available data and insights as of 2026.
Market Trends and Insights
Drivers Impact Analysis of Healthcare IT Provider Market*
| Driver | (~) % Impact on CAGR Forecast | Geographic Relevance | Impact Timeline |
|---|---|---|---|
| Accelerated Provider Shift to Cloud-Native Clinical Platforms in North America | +2.1% | North America, spillover to Europe | Medium term (2-4 years) |
| Convergence of Value-Based Care & Advanced Analytics in Europe | +1.8% | Europe, expanding to APAC | Long term (≥ 4 years) |
| Rapid Virtual-Care Reimbursement Expansion Across Asia | +2.3% | Asia-Pacific core, emerging in MEA | Short term (≤ 2 years) |
| Cyber-Security Mandates Driving Spending by U.S. IDNs | +1.6% | North America, regulatory influence in EU | Medium term (2-4 years) |
| AI-Enabled Diagnostic Decision Support Adoption in Tertiary Hospitals | +1.9% | Global, concentrated in developed markets | Long term (≥ 4 years) |
| Government-Funded Hospital Modernisation Programmes in Middle-East | +1.4% | Middle East, North Africa expansion | Medium term (2-4 years) |
| Source: Mordor Intelligence | |||
Accelerated Shift to Cloud-Native Clinical Platforms in North America
Providers are replacing legacy data centers with multicloud architectures that cut operating costs by 36% and shorten radiology-exam reading times by 40%, boosting patient throughput. Epic’s deep TEFCA hooks show how cloud connectivity amplifies interoperability, fueling competitive gaps that on-premise rivals struggle to close. Hospitals also value HIPAA-aligned scalability, prompting 98% of German facilities to report at least one production cloud workload in 2025. This driver keeps the Healthcare IT Provider Market on a steep digital-maturity trajectory, even as data-sovereignty clauses demand hybrid designs. Vendors integrating AI inference at the edge further increase platform stickiness, giving health systems a path to predictive care without forklift upgrades.
Convergence of Value-Based Care and Advanced Analytics in Europe
Pay-for-outcome contracts push European providers to monetize data, elevating platforms that merge patient-level analytics with revenue-cycle automation. McKinsey’s CareCUBE has shown how near-real-time insights cut per-member medical costs while raising quality scores. The EU Health Data Space law further cements demand for standards-based EHR connectors that work across borders. Vendors able to fuse structured and unstructured data in multiple languages become indispensable to hospitals seeking risk-score accuracy. As a result, analytics-ready modules have become the key purchase criterion for CIOs, overtaking user-interface bells and whistles.
Rapid Virtual-Care Reimbursement Expansion Across Asia
Payment-parity rules now allow telemedicine to capture up to 30% of medical visits by 2026, turning virtual consults into mainstream clinical encounters. Mental-health telehealth already makes up 38% of visits in urbanized Asian markets, and Thailand’s kiosk-based remote-care stations extend that model to rural areas. China’s march toward RMB 205 trillion in national health spending embeds digital-first care pathways, prompting IT vendors to package AI-triage, automated coding, and payment adjudication in a single stack. The Healthcare IT Provider Market benefits because telemedicine suppliers once pigeon-holed as stand-alone apps now sell full-cycle clinical platforms.
Cyber-Security Mandates Driving Spending by U.S. IDN
The 2024 Change Healthcare breach disrupted 15 billion transactions and triggered a regulatory wave that forces annual security audits and zero-trust rollouts. Budgets have been redirected, with half of new outlays earmarked for cyber defenses. Rural facilities, hardest hit by ransomware, receive subsidized assessments through Microsoft’s sector-specific program. For vendors, integrating endpoint monitoring, AI governance, and IoMT protection into the core platform is no longer optional; it is the sales door-opener.
Restraints Impact Analysis of Healthcare IT Provider Market*
| Restraint | (~) % Impact on CAGR Forecast | Geographic Relevance | Impact Timeline |
|---|---|---|---|
| Capital Budget Freezes Among Rural Hospitals in North America | -1.7% | North America rural markets | Short term (≤ 2 years) |
| Data-Localisation Rules Slowing Multinational Cloud Roll-outs in EU | -1.2% | Europe, regulatory spillover globally | Medium term (2-4 years) |
| Persistent Clinician Resistance to Workflow Changes in Japan | -0.8% | Japan, cultural influence in East Asia | Long term (≥ 4 years) |
| Shortage of HL7-FHIR-Certified IT Talent in Emerging Markets | -1.1% | Emerging markets, skills gap in APAC | Medium term (2-4 years) |
| Source: Mordor Intelligence | |||
Capital Budget Freezes Among Rural Hospitals in North America
Half of U.S. rural hospitals are running operating deficits, placing 748 facilities at risk of closure and choking off discretionary IT spend. CIOs limit purchases to must-have upgrades, leaving AI-rich features stuck on wish lists. While low-cost cloud EHRs offer a partial workaround, premium solution growth slows until federal lifelines such as Rural Emergency Hospital grants take effect. For the Healthcare IT Provider Market, this drag tempers otherwise strong North American expansion.
Data-Localization Rules Slowing Multinational Cloud Roll-outs in the EU
France’s HDS certification demands in-bloc data storage and public transfer mapping, forcing U.S. vendors to add regional data centers and compliance layers. Germany’s C5 framework adds another tier of audits. Resulting delays raise implementation costs and favor Europe-headquartered providers, trimming near-term revenues for global cloud suppliers. Hybrid deployment remains the compromise, though economies of scale suffer when analytics clusters cannot exit national borders.
*Our forecasts treat driver/restraint impacts as directional, not additive. The impact forecasts reflect baseline growth, mix effects, and variable interactions.
Healthcare IT Provider Market Segment Analysis
By Component:
Services Propel Platform IntegrationServices held 56.88% of 2025 revenue as health systems demanded turnkey deployments, workflow redesign, and managed updates. This share translates into the largest slice of the Healthcare IT Provider market size by component. Ongoing talent shortages mean providers outsource system maintenance, cyber-hardening, and report customization rather than expand in-house IT teams. Vendors sweeten contracts with outcome-based terms, aligning fees to readmission avoidance and patient-access metrics. Products, however, pace growth at 13.02% CAGR, buoyed by AI-ready edge servers and SaaS modules that deliver specialty functionality without disrupting core EHRs. The Healthcare IT Provider Market benefits as service consultants cross-sell proprietary software, blending revenue streams and boosting customer stickiness.
Second-generation enterprise resource-planning suites launched by Epic illustrate how service expertise can morph into adjacent product lineups. Meanwhile, Philips leverages AWS partnerships to connect 1.3 million IoT devices, demonstrating the pull-through effect of cloud-enabled hardware. Integration depth has become a competitive wedge, and the Healthcare IT Provider industry increasingly rewards vendors that can marry software upgrades with round-the-clock professional services.

By Application:
Integration Leads Medical-Device ConvergenceHospital interface and core EHR connectivity accounted for 40.22% revenue in 2025, underscoring the centrality of data liquidity to clinical productivity. Yet medical-device integration climbs at an 11.74% CAGR as bedside monitors, infusion pumps, and imaging scanners feed real-time vitals into charting systems. Growth accelerates when AI algorithms layer alerts atop streaming signals, moving from retrospective review to proactive intervention. Telehealth and mHealth suites ride the same data wave, projected to handle up to 30% of U.S. visits by 2026. The Healthcare IT Provider Market thus shifts from siloed function-specific apps to ecosystem platforms that span documentation, imaging, billing, and remote care.
PACS and VNA platforms consolidate, with GE Centricity leading 32% share while Sectra tops user-satisfaction charts. Revenue-cycle modules also evolve. Emerging AI-documentation vendors such as Ambience Healthcare raise USD 243 million to transcribe ambient conversations, illustrating how niche innovators tap the broader Healthcare IT Provider Market.
By Deployment:
Hybrid Models Gain MomentumOn-premise estates still hold 61.70% share in 2025, largely due to sunk-cost data centers and data-sovereignty directives that constrain wholesale migration. This segment represents the biggest slice of Healthcare IT Provider market share at present. Yet cloud-based rollouts grow at 12.18% CAGR as CIOs prioritize cost elasticity and AI-workload readiness. Hybrid configurations emerge as the equilibrium model, moving non-PHI workloads to hyperscalers while keeping regulated datasets in local private clouds. Vendors respond with single-pane management consoles that orchestrate backups, policy compliance, and rapid disaster recovery across mixed estates.
Philips’ AWS pivot shows how global device makers embrace cloud to manage 134 petabytes of imaging data at 36% lower cost. GE HealthCare’s generative-AI partnership with AWS underscores the compute hunger driving cloud adoption. Within the Healthcare IT Provider industry, vendors unable to oer flexible deployment options face thinning pipelines.
By End-User:
Hospitals Anchor Growth, Imaging Centers AccelerateHospitals and clinics deliver 63.55% of 2025 revenue, reflecting their command over enterprise-wide platform deals and bundled services. The segment accounts for the largest contribution to the Healthcare IT Provider market size by end-user category. Diagnostic and imaging centers outpace overall growth at 11.86% CAGR thanks to outpatient procedure migration and AI-enabled radiology analytics that boost throughput while curbing specialist workload. Ambulatory centers and payer organizations add diversity as value-based care demands integrated payer-provider data loops.
Rural facilities pioneer drone delivery for medications and mobile telehealth hubs to offset clinician shortages, opening niches for modular, low-overhead IT bundles. Payers invest in population-health engines that stratify risk and trigger social-determinant interventions, aligning claims processing with care-coordination metrics. Collectively, these trends ensure the Healthcare IT Provider Market maintains segment-wide momentum even as capital cycles vary.
Geography Analysis
North America Healthcare IT Provider Market
North America delivered 43.10% of 2025 revenue on the back of Epic’s hospital EHR footprint and sweeping cyber-security outlays after the Change Healthcare breach. Federal incentives for TEFCA connectivity and AI-assisted clinical decision support keep demand high. Yet financial distress among rural facilities creates regional fissures that temper otherwise robust growth and occasionally narrow the addressable Healthcare IT Provider Market.
APAC Healthcare IT Provider Market
Asia-Pacific posts the fastest 14.11% CAGR, propelled by China’s RMB 205 trillion health-spending trajectory and payment-parity telehealth rules that mainstream virtual consults. Thailand’s kiosk networks and India’s insurance-funded AI voice platforms widen rural access, while Japan pilots AI-assisted chronic care diagnostics. These drivers reshape provider purchasing habits, funneling capital toward platforms that can stretch across in-person and virtual modalities.
Europe and Middle East Healthcare IT Provider Market
Europe balances opportunity and complexity. The Health Data Space initiative promises cross-border interoperability, but France’s HDS and Germany’s C5 rules raise the deployment bar, inflating cost and lengthening sales cycles. In contrast, Middle Eastern markets award long-horizon modernization funds: Saudi Arabia’s SEHA Virtual Hospital now links 200 sites and treats 400,000 patients per year, a showcase for next-generation platforms. Collectively, these regional stories confirm the global reach of the Healthcare IT Provider Market while highlighting how local policy can speed or slow digital health timelines.
Regulatory Landscape
In the United States, the regulatory center of gravity for provider IT remains rooted in ASTP/ONC certification and interoperability requirements. Under the HTI-1 Final Rule, the program moved forward with updated certification criteria, and by January 2026 the USCDI v1 (July 2020 Errata) expired for compliance purposes, leaving USCDI v3 as the applicable dataset in the Certification Program. ASTP/ONC also advanced its annual standards maintenance approach in 2026 through the Interoperability Standards Advisory (ISA) reference edition and the Standards Version Advancement Process (SVAP), approving new standard versions with voluntary incorporation starting August 29, 2026, which feeds into vendor roadmaps for FHIR-based APIs and connector updates.
Rulemaking also tightened focus on payer-provider data exchange and information access. In February 2026, ASTP/ONC closed comments on the HTI-5 Proposed Rule to streamline the Certification Program and update information blocking provisions, including an estimated USD 1.53 billion in total compliance cost savings. In April 2026, CMS proposed the Interoperability Standards and Prior Authorization for Drugs rule, extending electronic prior authorization requirements for drugs to impacted payers with a proposed compliance date of October 1, 2027, anchored on FHIR and NCPDP standards. Outside the U.S., standards alignment gained momentum when WHO joined the Open Health Stack Software Foundation in July 2026 to advance open, standards-based digital health using HL7 FHIR and ICD terminologies, reinforcing the shift toward interoperable, standards-led deployments across regions.
Value Chain Analysis
The healthcare IT provider value chain begins with core technology inputs and standards, then moves through solution development, implementation, and long-cycle operations. Upstream inputs include EHR, analytics, and integration-platform software, cloud and infrastructure vendors (compute, storage, networking), device connectivity and interoperability assets (HL7/FHIR profiles and implementation guides), and cybersecurity tooling embedded into platform architectures after major breach events. Midstream, healthcare IT service providers and systems integrators deliver assessment, workflow redesign, migration, interface build, testing, and go-live support. Managed services increasingly cover patching, monitoring, identity controls, and compliance reporting, matching the market reality that services accounted for 56.88% of revenue in 2025.
Downstream, hospitals/IDNs, ambulatory centers, imaging centers, and payers act as primary buyers and operational owners, with purchasing decisions shaped by interoperability obligations and deployment constraints. Distribution is largely direct enterprise selling with multi-year contracts, supplemented by hyperscaler marketplaces and partner ecosystems where cloud alliances, such as Philips with AWS for large-scale imaging data management, act as accelerators for deployment tooling and reference architectures. Bottlenecks center on talent and infrastructure readiness: shortages of HL7-FHIR-certified skills and gaps in networking capacity for high-bandwidth AI, IoMT, and real-time EHR workloads push buyers toward turnkey engagements and managed infrastructure. EU data-localization requirements, including France HDS and Germany C5, also add compliance layers that influence hosting choices and extend implementation timelines.
Competitive Landscape
Epic Systems’ interoperability moat widens as it adds 176 hospitals, eclipsing Oracle Health, which shed 74 sites during the same period. Epic couples core charting with new ERP, revenue-cycle, and ambient-documentation modules, ensuring that clients see a one-vendor path from scheduling to supply-chain. Oracle counters with cloud-native analytics but faces user-reported revenue-cycle gaps that deter renewals. MEDITECH stakes a claim through a nationwide HIE network rollout, illustrating how mid-tier vendors can compete on open-exchange agility.
Investment flows into niche disruptors. Ambience Healthcare’s USD 243 million Series C underwrites ambient listening tech praised by physicians at Cleveland Clinic and UCSF, signaling provider appetite for burnout-fighting automation. ONRAD’s takeover of Direct Radiology creates the largest independent teleradiology shop, pointing to roll-up strategies in specialty imaging. Cloud alliances further shape the field: Philips and GE HealthCare both align with AWS for compute-hungry AI product lines.
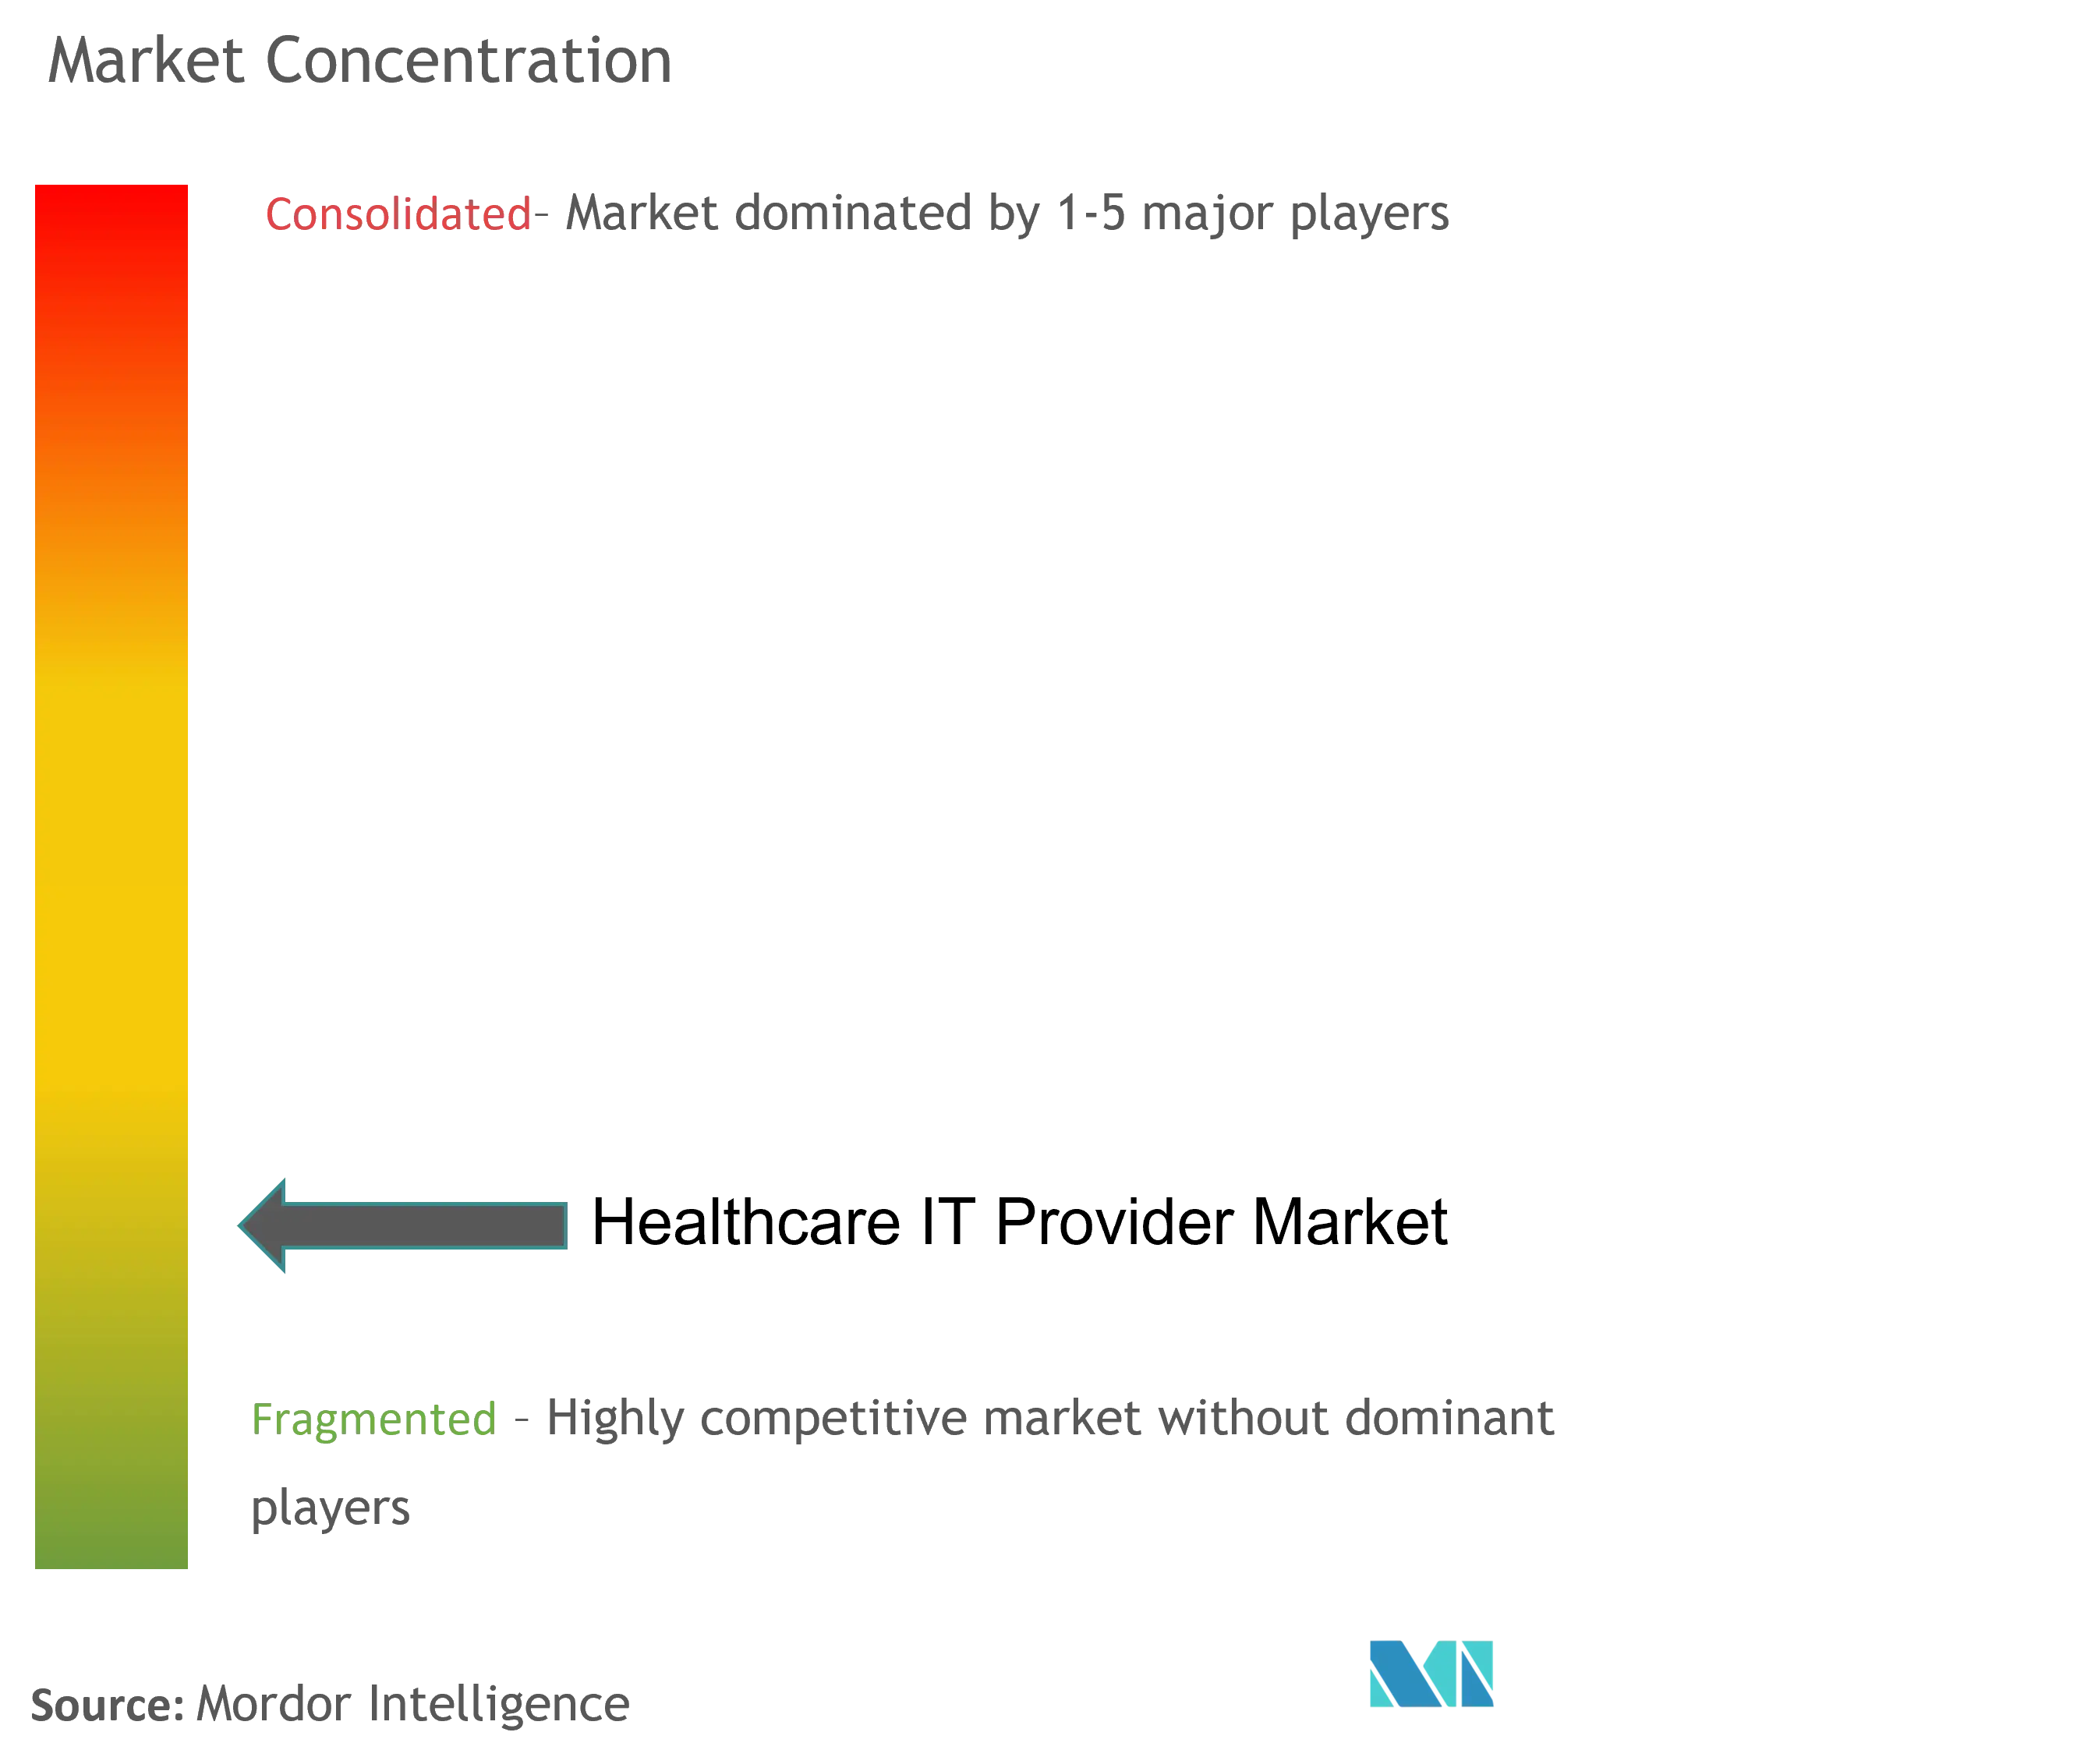
Overall, the Healthcare IT Provider Market is moderately concentrated. The top five players account for a combined share just above 60%, leaving meaningful runway for mid-cap specialists to carve domain niches. Partnerships, outcome-based contracts, and AI integration speed now outweigh sheer functional breadth in deal selection, setting the stage for sustained, innovation-driven rivalry.
Healthcare IT Provider Industry Leaders
-
Allscripts Healthcare Solutions
-
Oracle (Cerner Corporation)
-
Siemens Healthineers
-
General Electric Company (GE Healthcare)
-
IBM Corporation
- *Disclaimer: Major Players sorted in no particular order
Healthcare IT Provider Market Companies Covered in this Report
- Oracle
- Epic Systems
- Optum Insight (incl. Change Healthcare)
- Koninklijke Philips
- GE Healthcare
- Siemens Healthineers
- Altera Digital Health (Allscripts)
- athenahealth
- Meditech
- eClinicalWorks
- NextGen Healthcare
- InterSystems
- Teladoc Health
- Amwell
- IBM Merative
- Dell Technologies
- Cognizant
- Accenture
- Infosys
- Tata Consultancy Services (TCS)
- Wipro
- SAP
- Amazon Web Services
Market Opportunities and Future Outlook
Whitespace is expanding where interoperability and compliance needs are translating into modernization programs rather than point solutions. In the United States, ASTP/ONC updates to USCDI compliance in January 2026 and the 2026 SVAP pathway (voluntary adoption starting August 29, 2026) create recurring upgrade cycles for interface engines, data normalization, and FHIR-first API management, alongside continued demand for embedded security controls after the Change Healthcare disruption. On the payer side, CMS proposed in April 2026 to extend electronic prior authorization for drugs with a proposed compliance date of October 1, 2027, increasing demand for end-to-end prior authorization workflows that connect provider EHRs, payer systems, and pharmacy standards (FHIR and NCPDP) without manual rework.
Provider cloud migrations and regional digitization programs are also generating near-term implementation and managed-service opportunities. WellSpan Health announced in January 2026 a comprehensive migration of its technology portfolio to AWS across 250+ facilities to enable AI-enabled health solutions, highlighting the scale of enterprise moves that require data migration, governance, interoperability testing, and ongoing cloud operations support. In Europe, the eHealth composite score reaching 87% in 2025 and the scheduled application of the European Health Data Space Regulation starting March 2027 reinforce demand for cross-border-ready connectors, consent and access controls, and standardized EHR data services. In the Middle East and South Asia, physical capacity expansion plans tied to IT upgrades, including Aster DM Healthcare committing AED 1 billion to UAE expansion and IT upgrades, favor vendors that can deploy modular platforms quickly, integrate imaging and device data, and provide managed cybersecurity and compliance reporting across multi-site networks.
Recent Industry Developments in Healthcare IT Provider Market
- July 2026: WHO joined the Open Health Stack Software Foundation to advance open, standards-based digital health using HL7 FHIR and ICD terminologies. The move reinforces global convergence around interoperable building blocks, which supports vendors that package standards-compliant connectors, identity, and registry components for multi-country deployments.
- March 2026: GE HealthCare received FDA 510(k) clearance for Photonova Spectra, a photon-counting CT solution using Deep Silicon detector technology. The clearance expands the installed-base opportunity for providers to integrate higher-throughput imaging and AI-enabled workflows with PACS, VNA, and enterprise data platforms.
- November 2025: Oracle announced that Oracle Health EHR v25 achieved ONC Health IT Certification (Health IT Module 15.04.04.1221.Orac.25.00.1.251003). Certification strengthens Oracle's competitive position in replacement and expansion deals where certified interoperability capabilities and compliance-ready modules are procurement prerequisites.
Healthcare IT Provider Market Report Scope and Research Methodology
Market Definition and Coverage
This market covers the value of healthcare IT solutions and related services that are sold and deployed for healthcare providers to run clinical, diagnostic, imaging, and care coordination workflows, along with supporting infrastructure and integration.
Scope exclusions: it does not count general consumer health apps, pure medical device hardware without IT software, or payer-only IT spending unless it is purchased for provider-facing use.
Segments Covered in This Report
- By Component
- Hardware
- Software
- Services
- By Application
- Electronic Health Records (EHR)
- Revenue Cycle Management (RCM)
- Picture Archiving & Communication Systems (PACS)
- Tele-health & mHealth
- Clinical Decision Support (CDS) & AI-Diagnostics
- Population Health Management (PHM)
- By Deployment
- On-Premise
- Cloud-Based
- Hybrid
- By End-User
- Hospitals & IDNs
- Ambulatory Care Centres
- Diagnostic Imaging Centres
- Payers & Insurers
- By Geography (Value)
- North America
- United States
- Canada
- Mexico
- Europe
- Germany
- United Kingdom
- France
- Italy
- Spain
- Rest of Europe
- Asia-Pacific
- China
- India
- Japan
- South Korea
- Australia
- Rest of Asia-Pacific
- South America
- Brazil
- Argentina
- Rest of South America
- Middle East and Africa
- GCC
- South Africa
- Rest of Middle East and Africa
- North America
Data Sources, Market Sizing, and Validation
Desk Research
We start by building a factual base from public sources that show how provider IT demand is forming across regions and care settings. Common inputs include statistics and publications such as the US Centers for Medicare and Medicaid Services, the US Office of the National Coordinator for Health IT, the World Health Organization, OECD Health Statistics, and the World Bank health indicators.
Next, we use company annual reports, earnings decks, product documentation, procurement notices, and reputable press coverage to understand solution mix and typical buyer budgets. Supporting checks are added from patent databases and, when relevant, an import/export shipment-level database to understand hardware-linked spending patterns. These desk sources are not exhaustive, and many other public references were also used for data collection, validation, and clarification.
Primary Interviews and Surveys
Our primary work focuses on interviews and structured surveys with provider-side IT leaders, systems integrators, and solution specialists who can describe deal sizes and adoption barriers. Coverage is balanced across the Americas, EMEA, and APAC so assumptions around pricing, cloud migration pace, and implementation effort can be pressure-tested against differences in healthcare delivery and system maturity.
Distribution of primary research fieldwork respondents
| Company type | Respondent position | Region |
|---|---|---|
| Top tier: 26% | CXOs: 13% | APAC: 52% |
| Mid tier: 56% | Functional/Unit leaders: 41% | EMEA: 29% |
| Smaller Players: 18% | Managers: 46% | Americas: 19% |
Market-Sizing & Forecasting
Sizing begins with a top-down demand pool that ties provider IT spend to measurable signals by region, then filters it to in-scope solution areas (such as EHR, PACS and VNA, telemedicine, LIS, RIS, CVIS, and clinical decision support). Key model inputs include the direction of healthcare expenditure, hospital and ambulatory facility counts, imaging and lab procedure volumes as practical activity proxies, cloud deployment mix, and service intensity for implementation and maintenance.
Once the demand pool is set, results are corroborated using selective bottom-up approximations, including sampled vendor revenue splits by provider IT lines, channel checks on typical contract values, and ASP-by-deployment logic where software and services are priced differently. When a country has thin disclosure, a peer-market ratio is applied based on provider density and digital maturity, then adjusted using interview feedback.
For forecasting, we typically use scenario analysis supported by regression-style relationships between adoption variables and IT spend, because regulation timing, interoperability mandates, and cloud migration can shift spending faster than simple trend lines. Assumptions are reviewed with experts so growth rates reflect realistic implementation capacity and budget cycles, not just technical possibility.
Data Validation & Update Cycle
Outputs are validated through multiple checks, including cross-verifying totals against known healthcare IT budget signals, comparing regional splits to provider footprint indicators, and reviewing any sharp year-over-year jumps for explainable drivers. If a variance appears, we re-check the input series, revisit pricing logic, and re-contact selected respondents when the gap is material.
Before sign-off, the model and narrative go through step-by-step analyst review so assumptions, math, and scope treatment stay consistent. The report is refreshed annually, and interim updates are made when major policy changes, technology shifts, or macro events materially change provider IT spending patterns. Right before delivery, a final pass is completed to ensure clients receive the latest updated view.
Mordor Intelligence's Healthcare IT Provider Market Size Compared Against Other Published Estimates
Published market sizes for healthcare IT often differ because firms do not measure the same thing, even if the titles look similar. Differences usually come from what end users are counted, which solutions are included, and whether services and deployment-related spending are treated consistently.
Some published figures describe the full healthcare IT universe, where payer IT, broad enterprise IT, and adjacent digital health tools can be folded into one large number. In Mordor Intelligence's view, only provider-oriented solutions and associated hardware, software, and services are counted, and payer-only IT is included only when it directly supports provider workflows, which keeps the estimate tied to provider deployment reality.
Benchmark comparison
| Source | Market Size | Gaps in Research Methodology |
|---|---|---|
| Mordor Intelligence | USD 6.49 B (2026) | |
| Global Consultancy A | USD 374.78 B (2024) | Uses a broader healthcare IT definition that can include payer IT, non-provider enterprise IT, and wider digital health spending, and it is stated for a different base year which changes inflation and currency timing effects. |
| Industry Publisher B | USD 399.48 B (2024) | Represents an overall healthcare IT market total across components and end users, so provider-only deployments are not isolated, and service layers can be counted at a more aggregated level that inflates comparability versus provider-focused deployments. |
The table shows that the spread is mainly explained by scope and year alignment rather than simple math differences. By keeping the model anchored to provider deployment categories and checking totals against adoption and activity indicators, the estimate stays traceable to clear inputs and repeatable sizing steps.
Key Questions Answered in the Report
How large is the Healthcare IT Provider market in 2026?
The Healthcare IT Provider market size is USD 6.49 billion in 2026 and is forecast to reach USD 11.28 billion by 2031.
What CAGR is projected for Healthcare IT Provider solutions through 2031?
The market is expected to register an 11.68% CAGR between 2026 and 2031.
Which component segment generates most revenue?
Services command 56.88% of 2025 revenue because hospitals prefer turnkey integration and ongoing support.
Which geographic region is growing fastest?
Asia-Pacific is advancing at a 14.11% CAGR on the back of reimbursement reforms and large-scale digital health funding.
How is cloud adoption trending among providers?
Cloud-based deployments grow at a 12.18% CAGR as providers shift analytics workloads to hyperscalers while retaining some data on-premise for compliance.