Market Overview
| Study Period | 2020 - 2031 |
|---|---|
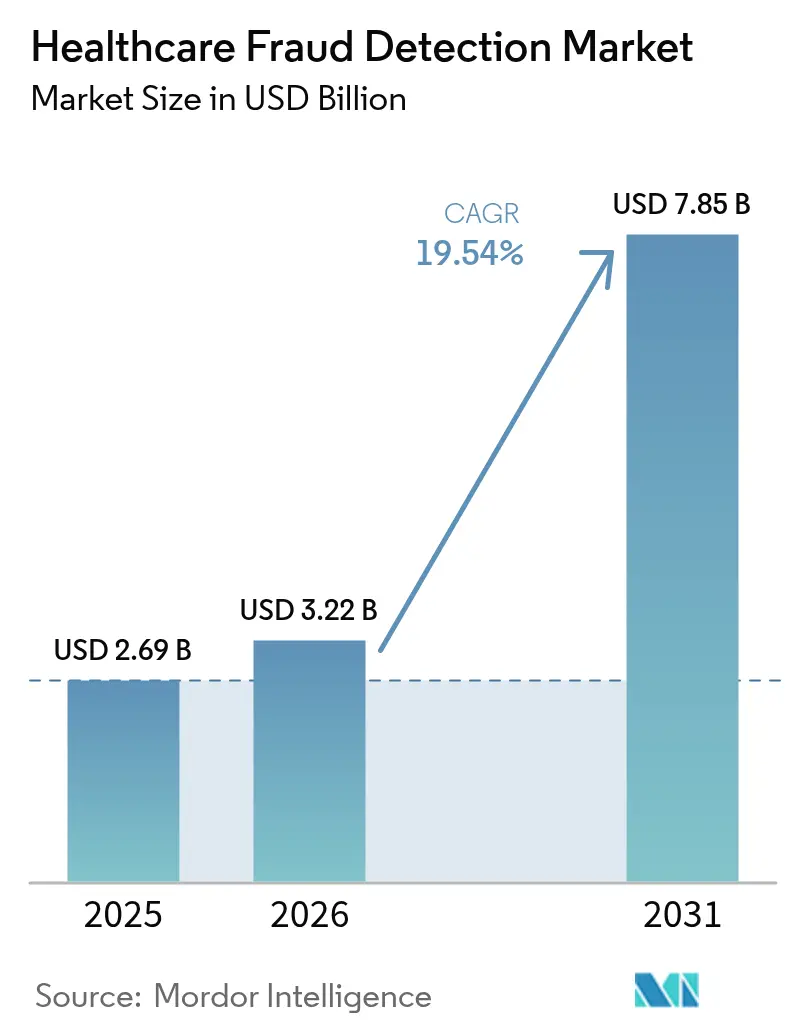
| Market Size (2026) | USD 3.22 Billion |
| Market Size (2031) | USD 7.85 Billion |
| Growth Rate (2026 - 2031) | 19.54% CAGR |
| Fastest Growing Market | Asia Pacific |
| Largest Market | North America |
| Market Concentration | Medium |
Major Players *Disclaimer: Major Players sorted in no particular order Image © Mordor Intelligence. Reuse requires attribution under CC BY 4.0. | |
Healthcare Fraud Detection Market Analysis by Mordor Intelligence
Healthcare fraud detection market size in 2026 is estimated at USD 3.22 billion, growing from 2025 value of USD 2.69 billion with 2031 projections showing USD 7.85 billion, growing at 19.54% CAGR over 2026-2031. Across the forecast window, payers and providers are expanding data-driven fraud and payment-integrity programs in response to an estimated USD 100 billion in annual fraud losses.[1]Centers for Medicare & Medicaid Services, “Crushing Fraud, Waste, & Abuse,” cms.gov Wider adoption of real-time analytics, cloud infrastructure, and FHIR-based interoperability is turning fraud-detection from an after-the-fact review into a proactive risk-control discipline. Government audits are intensifying—CMS alone will raise its medical-record review workforce from 40 to 2,000 coders—which, in turn, is spurring technology vendors to embed machine learning and generative AI into core claims workflows. Competitive differentiation now hinges on rapid model deployment, partner ecosystems, and the ability to process unstructured clinical data at scale. Implementation challenges remain—especially around data integration, transparency mandates, and staff change-management—yet the cost-benefit equation increasingly favors automated fraud detection as a must-have, not a “nice-to-have,” capability.
Key Report Takeaways
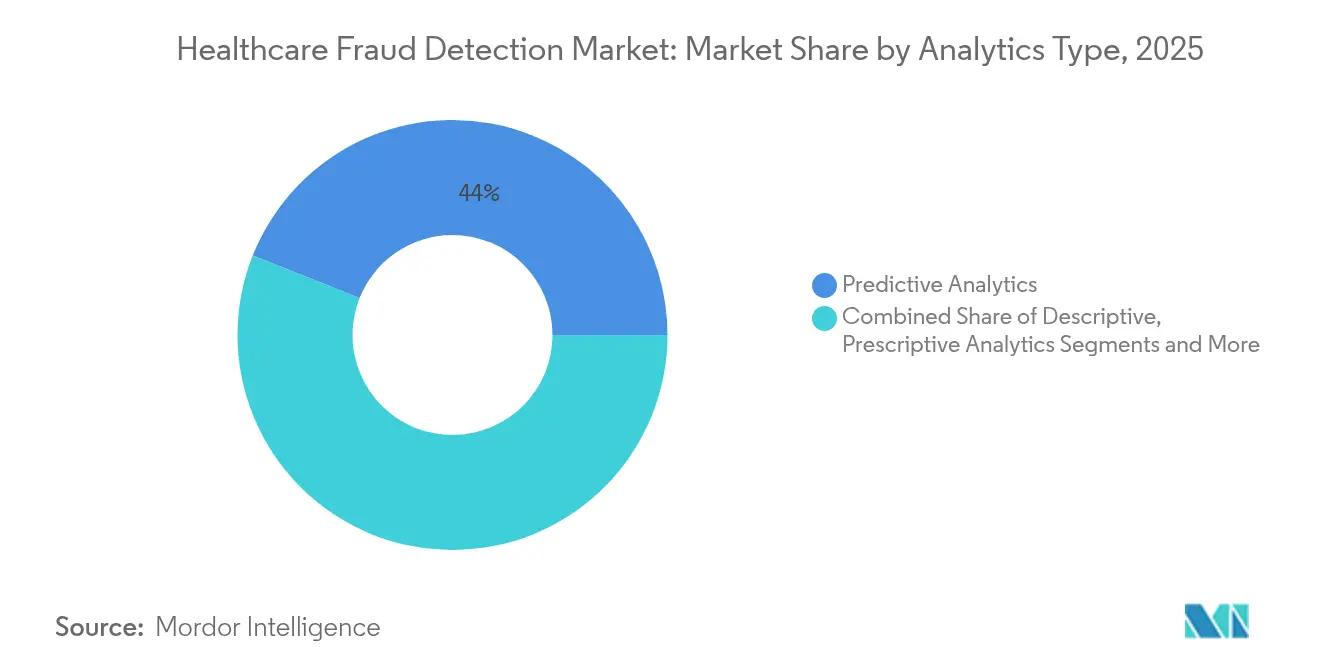
- By analytics type, predictive analytics led with 43.98% revenue share in 2025, while real-time streaming analytics is poised for a 23.7% CAGR through 2031.
- By component, software platforms held 59.10% of the healthcare fraud detection market share in 2025 and cloud services are expanding at 22.95% CAGR to 2031.
- By deployment mode, cloud deployments commanded 57.12% of the healthcare fraud detection market size in 2025 and will advance at 22.4% CAGR through 2031.
- By application, review of insurance claims captured 49.90% share of the healthcare fraud detection market size in 2025, whereas pharmacy benefit management is accelerating at a 21.55% CAGR.
- By end user, private insurance payers accounted for 47.20% revenue share in 2025, with government agencies registering the fastest 22.05% CAGR.
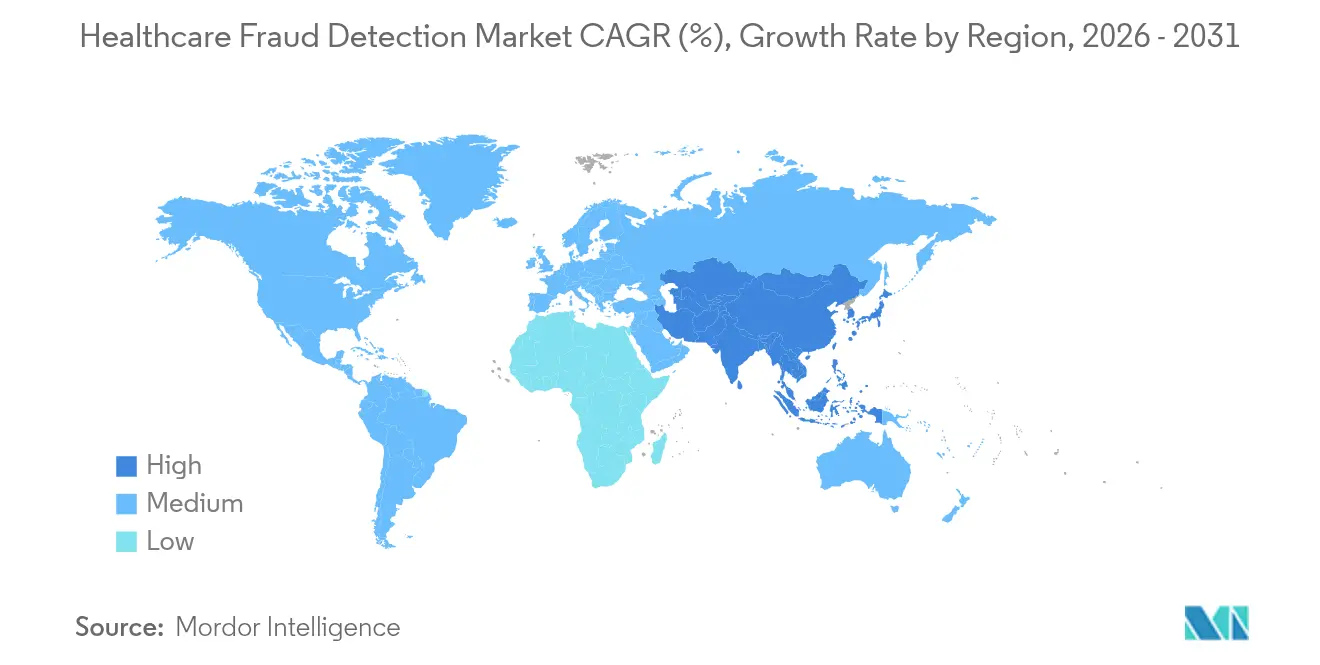
- By geography, North America led with 41.30% 2025 share, while Asia-Pacific is forecast to post a 20.8% CAGR through 2031.
Note: Market size and forecast figures in this report are generated using Mordor Intelligence’s proprietary estimation framework, updated with the latest available data and insights as of 2026.
Global Healthcare Fraud Detection Market Trends and Insights
Drivers Impact Analysis*
| Driver | (~) % Impact on CAGR Forecast | Geographic Relevance | Impact Timeline |
|---|---|---|---|
| Rising healthcare expenditure | +3.2% | Global, highest in North America & Europe | Medium term (2-4 years) |
| Increasing fraudulent activities in healthcare | +4.1% | Global, concentrated in mature markets | Short term (≤ 2 years) |
| Growing pressure to reduce healthcare spending | +2.8% | North America & EU, expanding to APAC | Medium term (2-4 years) |
| Surge in health-insurance enrolment & claims volumes | +3.5% | Global, APAC strongest | Long term (≥ 4 years) |
| Real-time claims adjudication via FHIR APIs | +2.9% | North America & EU leading | Medium term (2-4 years) |
| Synthetic data generation for cross-institution detection | +1.8% | Global, early adoption in North America | Long term (≥ 4 years) |
| Source: Mordor Intelligence | |||
Rising Healthcare Expenditure
Spending growth is sharpening executive focus on fraud because each lost percentage point equals billions in avoidable cost. CMS has earmarked USD 941 million for fraud and abuse control in fiscal 2025, signaling that analytics-driven prevention is now central to cost-containment. Private payers echo this urgency as value-based contracts expose them to downside risk. Organizations are finding that anomaly-detection algorithms reveal savings opportunities invisible to manual reviewers. Countries with aging populations feel the pressure most because chronic-care and drug claims dominate expenditure. As a result, budget growth and fraud-control investment move in lockstep, reframing fraud analytics as defensive infrastructure.
Increasing Fraudulent Activities in Healthcare
Fraudsters exploit technology faster than legacy, rule-based systems can respond, forcing a shift toward AI-enabled monitoring. The Medicare Transaction Fraud Prevention Act prioritizes artificial intelligence after CMS flagged anomalous billing for intermittent urinary catheters, a tactic that triggered improper payments. Healthcare networks now combine cross-provider claims data with synthetic datasets to uncover patterns spanning geographies. Deep-learning approaches such as autoencoders have achieved F1-scores of 0.97 in spotting overutilized procedure codes.[2]Michael Suesserman, Samantha Gorny, Daniel Lasaga, John Helms, Dan Olson, Edward Bowen, and Sanmitra Bhattacharya, “Procedure Code Overutilization Detection from Healthcare Claims Using Unsupervised Deep Learning Methods,” BMC Medical Informatics and Decision Making, biomedcentral.com This arms race accelerates investment as stakeholders see reactive reviews as an insufficient defense.
Growing Pressure to Reduce Healthcare Spending
Cost-containment mandates push fraud analytics from discretionary spend to operational necessity. Highmark Health’s collaboration with Epic and Google Cloud saved USD 2.7 million by streamlining administrative steps. When predictive models surface high-risk cases, providers intervene earlier and avoid expensive procedures. Unions back these tools, funding second-opinion programs that cut overtreatment and reduce employer liability. Fraud analytics also trims false positives in prior authorizations, allowing physicians to focus on care rather than paperwork. The market therefore links analytics adoption directly to measurable operating savings.
Surge in Health-Insurance Enrolment & Claims Volumes
Rapid enrolment inflates daily claim counts beyond what batch systems can handle. India’s Ayushman Bharat Digital Mission has issued health IDs to more than 500 million citizens, a data influx that demands scalable analytics. Medicare Advantage plans in the United States face similar volume spikes amid tighter audits. Stream-processing platforms such as Apache Kafka route data for adjudication within seconds rather than hours.[3]Arti Rana, “Real-Time Claims Processing in Healthcare: Leveraging Stream Processing Technologies for Faster Payment Adjudication,” International Journal of Innovative Research in Management, Planning and Social Sciences, ijirmps.org To keep pace, organizations are adopting cloud architectures and embedding fraud-scoring logic at intake. Without automation, large payers risk delays, payment errors, and regulatory penalties.
Restraints Impact Analysis*
| Restraint | ( ~ )% Impact on CAGR Forecast | Geographic Relevance | Impact Timeline |
|---|---|---|---|
| Unwillingness to adopt analytics solutions | -2.1% | Global, higher resistance in traditional markets | Short term (≤ 2 years) |
| High implementation & integration costs | -2.8% | Global, hardest on smaller organizations | Medium term (2-4 years) |
| Data-privacy & compliance concerns (HIPAA / GDPR) | -1.9% | North America & EU first | Long term (≥ 4 years) |
| AI-model bias & false positives triggering scrutiny | -1.5% | Global, regulator focus in developed regions | Medium term (2-4 years) |
| Source: Mordor Intelligence | |||
Unwillingness to Adopt Analytics Solutions
Smaller providers fear that sophisticated fraud platforms will disrupt familiar workflows and demand scarce technical skills. This mirrors findings in Asian finance, where more than half of institutions still forgo AI in anti-money-laundering programs despite clear benefits. Healthcare staff often equate new tools with added administrative burden rather than relief. Moreover, leadership teams struggle to quantify undetected fraud, making ROI appear speculative. Successful pilot programs that deliver quick wins typically shift perception and encourage wider rollout, yet change-management remains a barrier.
High Implementation & Integration Costs
License fees are only the beginning; data-warehouse modernization, cloud migration, and user training quickly swell budgets. Mass General Brigham’s effort to integrate 27,000 data elements illustrates the resource intensity of building a fraud-ready data backbone. Specialized talent—data scientists, informaticists, compliance officers—commands premium salaries. Smaller organizations often lack the scale to justify such outlays even though regulatory obligations apply equally. Without low-touch integration and managed-service options, cost will slow adoption among mid-tier providers and regional health plans.
*Our forecasts treat driver/restraint impacts as directional, not additive. The impact forecasts reflect baseline growth, mix effects, and variable interactions.
Segment Analysis
By Analytics Type: Real-Time Processing Drives Innovation
The healthcare fraud detection market size for analytics platforms was led by predictive tools, which captured 43.98% share in 2025. These models profile historical claims to forecast risk before payment. Nonetheless, demand is shifting toward real-time streaming analytics, forecast to climb at 23.7% CAGR through 2031. Organizations increasingly view millisecond-level scoring as essential for intercepting evolving schemes.
Stream-processing stacks such as Kafka and Flink underpin this pivot, enabling dynamic ingestion of unstructured notes, device data, and FHIR messages. Early adopters report materially lower overpayment rates once detections occur pre-payment rather than in retrospective audits. Descriptive analytics remains relevant for compliance reporting, while prescriptive models are emerging among mature payers seeking automated adjudication recommendations. Vendors that knit predictive, prescriptive, and real-time workflows into a single fabric are shaping the next wave of differentiation in the healthcare fraud detection market.


By Component: Cloud Services Accelerate Deployment
Software suites dominated the component landscape with 59.10% 2025 share, reflecting entrenched demand for end-to-end investigation platforms. Yet cloud services are the fastest-growing slice at 22.95% CAGR, propelled by migration away from rigid on-premise stacks. Payers cite elastic scaling, lower upfront cost, and faster update cycles as prime incentives.
Major alliances—Humana and Google Cloud, Oracle Health and G42—aim to marry deep health data with hyperscale infrastructure. This ecosystem approach lowers barriers for mid-market insurers that lack vast internal IT. In parallel, managed-service providers bundle model governance, system tuning, and regulatory reporting, thereby reshaping total-cost calculations. As health plans consolidate point solutions into unified SaaS platforms, cloud services are likely to become the de-facto delivery model for the healthcare fraud detection market.
By Deployment Mode: Hybrid Models Enable Flexibility
Cloud deployments already account for 57.12% of the healthcare fraud detection market size and are projected to keep expanding at 22.4% CAGR. Even so, on-premise installations persist inside organizations with stringent data-sovereignty mandates. Hybrid architectures reconcile these needs, allowing sensitive identifiers to stay in local vaults while compute-heavy analytics runs in the cloud.
The rise of FHIR-native APIs from vendors such as Health Samurai simplifies secure data exchange between environments. Hybrid designs also help firms throttle cloud spending by off-loading only peak-time workloads. Over the forecast horizon, regulators’ evolving stance on cross-border data transfer will likely determine how fast pure cloud deployments outpace hybrid models, but flexibility will remain an essential buying criterion.
By Application: Pharmacy Benefits Drive Growth
Claims review retained 49.90% share in 2025, anchoring the healthcare fraud detection market. Yet pharmacy benefit management (PBM) solutions will expand at 21.55% CAGR, mirroring the surge in prescription-drug spend and scrutiny of high-cost therapies. Fraud models tuned to formulary management detect doctor-shopping, refill abuse, and coupon gaming that ordinary claims edits overlook.
CMS investigations into anomalous catheter billing underscore how device-specific schemes can slip through generic rule sets. With real-time PBM analytics, payers flag suspect prescriptions at the pharmacy counter, averting waste before dispensing. Adjacent use cases—payment integrity, provider audit, and revenue recovery—continue to mature, creating a continuum of prevention, detection, and recoupment applications inside the broader healthcare fraud detection market.

By End User: Government Agencies Accelerate Adoption
Private insurance payers dominated demand with 47.20% revenue share in 2025 because commercial plans historically invested earliest in analytics. However, government agencies will log the fastest 22.05% CAGR as Medicare and Medicaid scale machine-learning audits. CMS’s Data Analytics and Systems Group exemplifies this shift, coordinating cross-program integrity efforts with advanced modeling.
Providers are also stepping up investment to tighten revenue-cycle management under value-based contracts. Meanwhile, employers and unions deploy member-centric fraud tools to curb premium growth. This widening stakeholder roster broadens addressable demand and diversifies solution requirements, reinforcing the need for configurable platforms within the healthcare fraud detection market.
Geography Analysis
North America held 41.30% share of the healthcare fraud detection market in 2025, anchored by robust enforcement frameworks and funding. CMS is channeling USD 941 million into fraud-control activities for fiscal 2025, and regulations such as the 21st Century Cures Act mandate interoperability and algorithm transparency. High EHR penetration and a dense vendor ecosystem speed adoption cycles. Canada and Mexico follow the U.S. trajectory as cross-border claims rise and shared data lakes emerge.
Asia-Pacific is the fastest-growing region with a 20.8% CAGR, fueled by nationwide digital-health missions, expanding insurance pools, and cloud-first IT strategies. India’s 500-million-plus health IDs, China’s AI productivity gains among clinicians, and Japan’s insurer-led generative-AI pilots exemplify momentum. Australia and South Korea add regulatory clarity and public grants that accelerate vendor uptake.
Europe maintains solid growth underpinned by GDPR-aligned privacy safeguards. Member states adopt privacy-preserving analytics and synthetic data to reconcile fraud prevention with stringent data-protection norms. Germany, United Kingdom, and France lead deployments through national digitization roadmaps, while Southern and Eastern European markets show steady demand as health-insurance coverage broadens. South America and the Middle East & Africa remain nascent but attractive, given rising private insurance penetration and government e-health agendas that will require fraud controls.

Competitive Landscape
Competition clusters around integrated, AI-driven platforms supplied by global technology houses, legacy healthcare-IT vendors, and nimble startups. Market leaders pursue acquisitions and alliances to fill capability gaps and strengthen cloud and analytics depth. HEALWELL AI’s USD 165 million takeover of Orion Health underscores a consolidation trend toward data-interoperability plus AI bundles.
Oracle Health’s partnership with Cleveland Clinic and G42 signals a push to co-develop nation-scale AI applications that incorporate fraud-scoring at their core. UnitedHealth Group, with more than 1,000 AI use cases live, illustrates the capital intensity required to sustain leadership.
Emerging disruptors differentiate via cloud-native, microservice architectures that slash deployment time and enable rapid algorithm iteration. White-space opportunities include synthetic-data generators, bias-auditing toolkits, and pre-payment “Point-Zero” integrity models like Codoxo’s newly launched service. Overall, buyers weigh vendor roadmaps, explainability features, and multi-channel data ingestion more heavily than initial software cost when selecting platforms in the healthcare fraud detection market.
Healthcare Fraud Detection Industry Leaders
CGI Inc.
DXC Technology Company
Mckesson
IBM
Exl Service
- *Disclaimer: Major Players sorted in no particular order

Recent Industry Developments
- May 2025: Codoxo launched Point Zero Payment Integrity, a pre-claim intervention model aimed at preventing improper payments.
- April 2025: Perfios acquired IHX to merge health-data insights with a large claims-exchange network.
- April 2025: CGI Federal released a federal Fraud, Waste and Abuse Prevention Platform to stop improper payments pre-disbursement.
- February 2025: Commure and Athelas agreed to acquire Augmedix, forming the largest AI software provider in healthcare with extensive denied-claim automation.


Research Methodology Framework and Report Scope
Market Definitions and Key Coverage
Our study defines the healthcare fraud detection market as every software platform and supporting service that applies analytics or rule-based logic to identify, score, and help prevent fraudulent, wasteful, or abusive healthcare claims before or after payment. We follow the claim life cycle from submission through recovery across public plans, private insurers, and provider billing environments.
Scope exclusion: We exclude generic payment-integrity BPO, broad financial crime suites, and non-health insurance fraud tools.
Segmentation Overview
- By Analytics Type
- Descriptive Analytics
- Predictive Analytics
- Prescriptive Analytics
- Real-time / Streaming Analytics
- By Component
- Software
- Services
- By Deployment Mode
- On-premise
- Cloud
- Hybrid
- By Application
- Review of Insurance Claims
- Payment Integrity
- Provider Audit & Revenue Recovery
- Fraud, Waste & Abuse Management
- Pharmacy Benefit Management
- By End User
- Private Insurance Payers
- Government Agencies
- Healthcare Providers
- Employers & Unions
- By Geography
- North America
- United States
- Canada
- Mexico
- Europe
- Germany
- United Kingdom
- France
- Italy
- Spain
- Rest of Europe
- Asia-Pacific
- China
- Japan
- India
- Australia
- South Korea
- Rest of Asia-Pacific
- Middle East and Africa
- GCC
- South Africa
- Rest of Middle East and Africa
- South America
- Brazil
- Argentina
- Rest of South America
- North America
Detailed Research Methodology and Data Validation
Primary Research
Mordor analysts interviewed payers' SIU leads, revenue-cycle executives at large hospital systems, state Medicaid reviewers, and analytics vendors across North America, Europe, and Asia-Pacific. Conversations clarified average savings rates, pricing bands, and technology renewal cycles, filling gaps that literature alone cannot close.
Desk Research
We started by compiling public data from authorities such as CMS's Program Integrity portal, the National Health Care Anti-Fraud Association, U.S. Department of Justice settlement archives, OECD health-spend tables, and GAO fraud audits. We then layered in industry filings, earnings calls, and trade-group white papers. Subscription sources like Dow Jones Factiva and D&B Hoovers helped us verify company revenues and client counts. This foundation anchored baseline claim volumes, fraud loss ratios, and vendor penetration. The sources cited are illustrative; many additional references informed the groundwork.
A second sweep mapped regulatory triggers (HIPAA, GDPR, ICD-10 updates), patent trends from Questel, and regional adoption signals logged by state Medicaid Integrity units. These items guided segment breakouts and regional weightings that feed the core model.
Market-Sizing & Forecasting
We employed a top-down claims-pool reconstruction, total processed claims by region multiplied by historical fraud incidence and analytics adoption, to size 2024. We then cross-checked with bottom-up samples of vendor revenue and average selling price multiplied by live installations. Key variables include insured population growth, electronic claim share, anti-fraud budget ratio, AI model refresh cadence, and regulatory audits per thousand claims. Multivariate regression with scenario analysis projects 2025-2030, and any residual gaps in bottom-up rolls were adjusted proportionally to match validated regional totals.
Data Validation & Update Cycle
Outputs pass anomaly checks against external fraud-loss surveys, peer vendor filings, and fresh primary feedback. Two analyst reviews precede sign-off. We refresh each model annually and trigger interim updates when major policy or fraud events surface, ensuring clients always receive an up-to-date view.
Why Mordor's Healthcare Fraud Detection Baseline Commands Reliability
Published estimates vary widely because firms choose different service boundaries, adoption assumptions, and refresh cadences. We acknowledge those swings, yet we also know buyers need numbers they can trace back to transparent variables.
Key gap drivers include: some studies bundle wider payment-integrity or enterprise FDP suites; others assume aggressive AI penetration without validating SIU budgets; still more freeze currency or exchange rates that Mordor updates quarterly. By aligning scope strictly to fraud-specific analytics and refreshing inputs yearly, Mordor Intelligence limits noise.
Benchmark comparison
| Market Size | Anonymized source | Primary gap driver |
|---|---|---|
| USD 2.69 B (2025) | Mordor Intelligence | - |
| USD 4.60 B (2025) | Global Consultancy A | Includes broader payment-integrity modules and counts IT services revenue |
| USD 2.56 B (2025) | Industry Research B | Uses partial geography set and omits cloud subscription renewals |
These contrasts show that when scope expands or critical variables are skipped, figures swing sharply. Our disciplined, variable-driven process therefore provides the dependable baseline executives can act on with confidence.


Key Questions Answered in the Report
What is the current value of the healthcare fraud detection market?
The market stands at USD 3.22 billion in 2026 and is projected to reach USD 7.85 billion by 2031, reflecting a 19.54% CAGR over 2026-2031.
Which analytics approach is growing fastest?
Real-time streaming analytics is the fastest-growing segment, expected to post a 23.7% CAGR through 2031.
Why are cloud services gaining traction in fraud detection?
Cloud platforms offer elastic scaling, lower upfront costs, and rapid deployment, supporting a 22.95% CAGR for cloud services within the market.
Which region will expand most quickly?
Asia-Pacific is forecast to grow at a 20.8% CAGR, propelled by large-scale digital-health programs and rising insurance coverage.
How are government agencies influencing market growth?
Agencies such as CMS are ramping up audits and funding; government end users are anticipated to witness a 22.05% CAGR in solution adoption.
What is the biggest barrier to adopting fraud-detection analytics?
High implementation and integration costs remain the primary restraint, particularly for smaller healthcare organizations.
Page last updated on:


