
Healthcare Equipment Leasing Market Size and Share
Market Overview
| Study Period | 2020 - 2031 |
|---|---|
| Market Size (2026) | USD 149.69 Billion |
| Market Size (2031) | USD 304.93 Billion |
| Growth Rate (2026 - 2031) | 15.29 % |
| Fastest Growing Market | Asia-Pacific |
| Largest Market | North America |
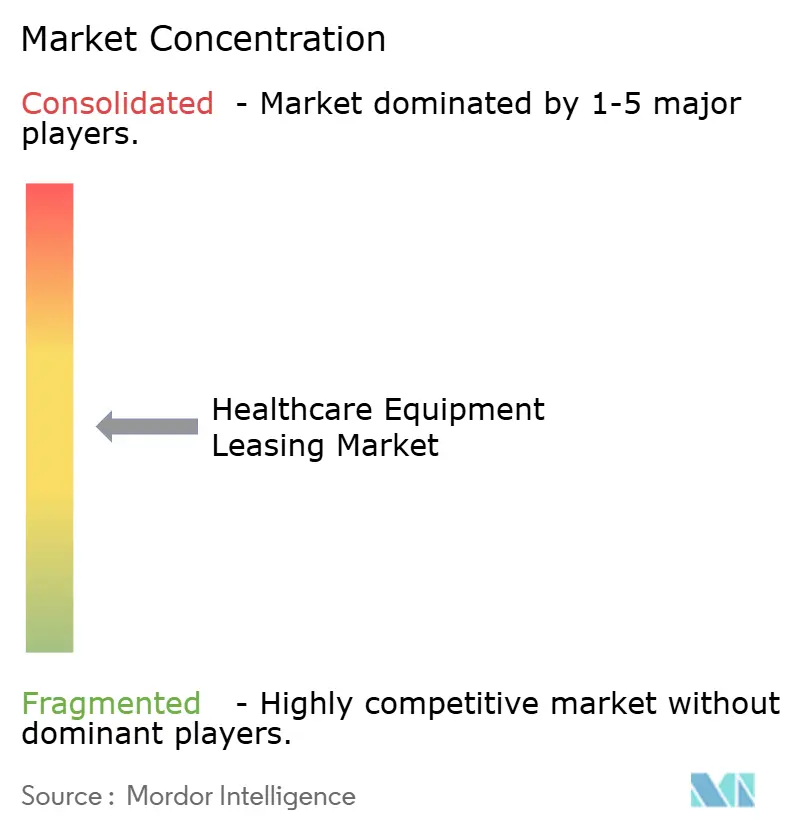
| Market Concentration | Medium |
Major Players.webp) *Disclaimer: Major Players sorted in no particular order Image © Mordor Intelligence. Reuse requires attribution under CC BY 4.0. | |
Healthcare Equipment Leasing Market Analysis by Mordor Intelligence
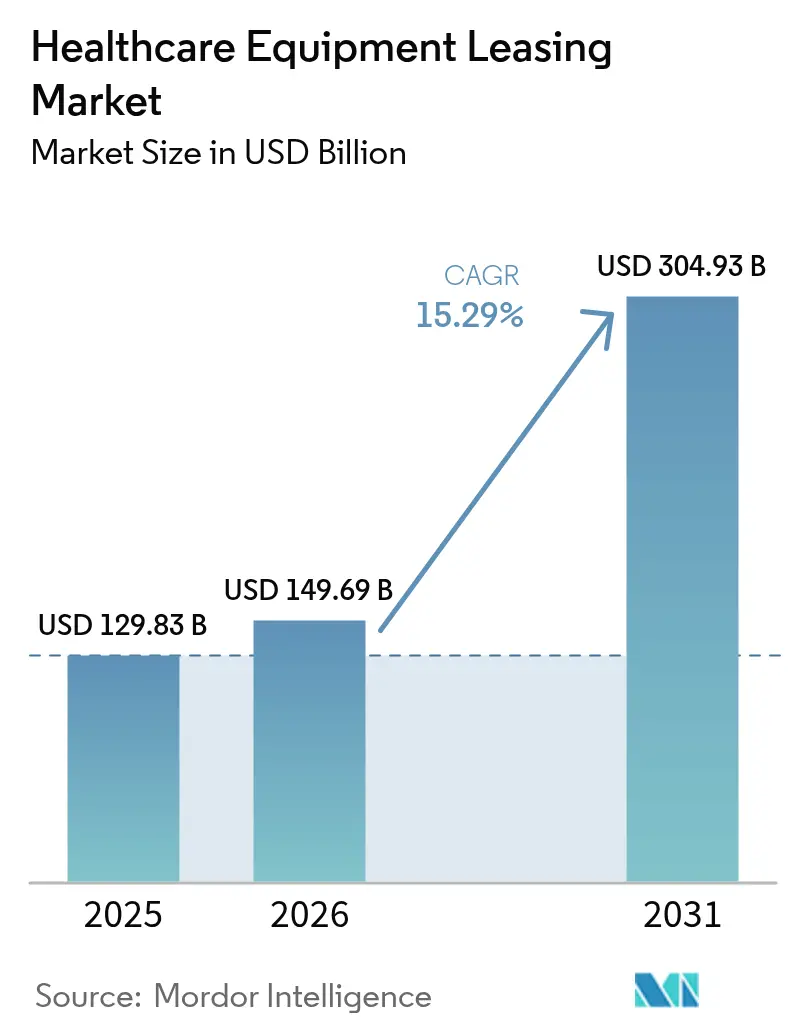
The Healthcare Equipment Leasing Market size is expected to grow from USD 129.83 billion in 2025 to USD 149.69 billion in 2026 and is forecast to reach USD 304.93 billion by 2031 at 15.29% CAGR over 2026-2031.
The expansion is anchored in hospitals’ preference for asset-light models that preserve liquidity, shorten technology refresh cycles, and align capital outlays with revenue generation. Providers leverage leasing to secure AI-enabled imaging, connected monitoring, and digitally integrated surgical systems without depleting cash reserves, while lessors assume obsolescence and resale risk. Intensified pressure on operating margins, heightened regulatory focus on outcomes, and the emergence of managed service contracts further accelerate demand. Simultaneously, demographic changes and the shift of care to outpatient and home settings expand the addressable base for portable, remotely monitored devices, reinforcing the long-run growth path of the healthcare equipment leasing market.
Key Report Takeaways
- By product type, diagnostic imaging equipment captured 28.05% of 2025 revenue, while digital and electronic equipment is forecast to grow at 17.12% CAGR through 2031.
- By lease type, operating leases held 63.68% of 2025 demand, whereas managed equipment service agreements are set to expand at 17.24% CAGR to 2031.
- By end user, hospitals and clinics commanded 65.05% of 2025 activity, while home healthcare providers are advancing at 17.95% CAGR over the outlook period.
- By duration, short-term contracts under 12 months accounted for 45.12% of 2025 transactions, and long-term arrangements exceeding three years are projected to climb at 17.02% CAGR.
- By geography, North America led with 41.25% share in 2025, yet Asia-Pacific is on track for a 16.08% CAGR through 2031.
Note: Market size and forecast figures in this report are generated using Mordor Intelligence’s proprietary estimation framework, updated with the latest available data and insights as of 2026.
Market Trends and Insights
Drivers Impact Analysis of Healthcare Equipment Leasing Market*
| Driver | (~) % Impact on CAGR Forecast | Geographic Relevance | Impact Timeline |
|---|---|---|---|
| Escalating Capital Expenditure For Medical Technology | +3.2% | North America & Europe, expanding globally | Medium term (2-4 years) |
| Shift Toward Asset-Light Operating Models In Healthcare | +2.8% | Global, led by North America, expanding to APAC | Long term (≥4 years) |
| Expansion Of Diagnostic Imaging And Surgical Infrastructure | +2.1% | APAC core, spill-over to MEA & Latin America | Long term (≥4 years) |
| Growing Preference For Operational Flexibility And Cash-Flow Management | +2.4% | Global, particularly acute in post-pandemic markets | Medium term (2-4 years) |
| Acceleration Of Technology Refresh Cycles In Medtech | +1.9% | Global, with early adoption in developed markets | Short term (≤2 years) |
| Rise Of Outcome-Based Managed Equipment Service Contracts | +1.6% | North America & EU, broadening into APAC | Long term (≥4 years) |
| Source: Mordor Intelligence | |||
Escalating Capital Expenditure for Medical Technology
Hospitals face capital allocation stress as MRI, CT, and robotic surgery platforms exceed multi-million-dollar price points while reimbursement schedules tighten. Leasing shifts these costs from balance sheets to predictable operating lines, freeing cash for clinical programs. Siemens Healthineers’ 10-year value partnership with Tower Health illustrates the model, bundling equipment, lifecycle management, and upgrades to mitigate obsolescence. Providers redirect preserved capital toward patient-centric initiatives yet still secure leading-edge technology. As high-spec imaging and therapy systems evolve every two to three years, the healthcare equipment leasing market becomes the preferred pathway for modernization without large-scale capex spikes.
Shift Toward Asset-Light Operating Models in Healthcare
Health systems adopt asset-light strategies to concentrate on clinical outcomes rather than equipment ownership. Everything-as-a-Service arrangements replace lump-sum purchases with performance-linked monthly fees, aligning technology use with value delivered. The model improves leverage metrics, reduces depreciation pressure, and enhances agility in uncertain economic climates. Providers allocate freed capital to telehealth, workforce retention, and digital front-door initiatives while lessors specialize in depreciation management. The widening gap between brisk innovation cycles and limited budgets cements leasing as a core pillar of financial resilience across the healthcare equipment leasing market.
Expansion of Diagnostic Imaging and Surgical Infrastructure
Emerging markets race to install MRI suites, hybrid ORs, and ambulatory imaging centers as urbanization and middle-class growth raise diagnostic demand. Leasing allows rapid deployment without upfront capital drains, enabling mid-sized hospitals in India, Indonesia, and Brazil to offer advanced scans sooner than equity financing would permit. GE HealthCare’s collaboration with Sutter Health, which cut MRI scan times by 40%, signals how AI-ready equipment can be procured through lease structures that spare capex budgets[1]. The healthcare equipment leasing market thus serves as a catalyst for capacity build-out and quality improvement in fast-growing regions.
Rise of Outcome-Based Managed Equipment Service Contracts
Hospitals negotiate contracts that tie lease payments to uptime, image quality, or procedure throughput, ensuring technology contributes directly to patient care metrics. OEM-linked lessors bundle training, predictive maintenance, and AI analytics, guaranteeing performance while sharing operational risk. Academic studies show such models improve equipment utilization and cost predictability[2]. As value-based care expands, the healthcare equipment leasing market shifts from commodity financing toward integrated, outcome-oriented partnerships.
Restraints Impact Analysis of Healthcare Equipment Leasing Market*
| Restraints Impact Analysis | (~) % Impact on CAGR Forecast | Geographic Relevance | Impact Timeline |
|---|---|---|---|
| Stringent accounting standards increasing on-balance-sheet liabilities | -1.8% | Global, acute in public entities & regulated providers | Medium term (2-4 years) |
| Availability of refurbished and second-life equipment alternatives | -1.2% | Global, pronounced in cost-sensitive markets | Long term (≥4 years) |
| Rising cybersecurity and data-privacy compliance costs | -1.5% | North America & EU, spreading worldwide | Short term (≤2 years) |
| Limited awareness of leasing benefits among small healthcare providers | -0.9% | Emerging markets and rural settings globally | Medium term (2-4 years) |
| Source: Mordor Intelligence | |||
Stringent Accounting Standards Increasing On-Balance-Sheet Liabilities
ASC 842 and IFRS 16 oblige health systems to record lease liabilities, reducing prior off-balance-sheet advantages. The change raises reported leverage, complicates debt-covenant compliance, and forces CFOs to revisit purchase-versus-lease models. Operating leases now appear alongside finance leases, narrowing the gap to loan financing. U.S. Bank’s advisory notes that proper classification remains vital for rating reviews. Although transparency improves, the rule tempers aggressive growth in the healthcare equipment leasing market for organizations sensitive to headline debt metrics.
Availability of Refurbished and Second-Life Equipment Alternatives
A mature global refurbishing ecosystem offers MRI, CT, and ultrasound systems at discounts of 30–50% relative to new leases. DirectMed Imaging’s inventory demonstrates ready access to certified parts and extended warranties at lower cost. Price-constrained community clinics in Latin America and Africa often favor refurbished units over new leased gear. Lessors must therefore differentiate through service guarantees, uptime commitments, and built-in upgrade paths to defend share in the healthcare equipment leasing market.
*Our forecasts treat driver/restraint impacts as directional, not additive. The impact forecasts reflect baseline growth, mix effects, and variable interactions.
Healthcare Equipment Leasing Market Segment Analysis
By Product:
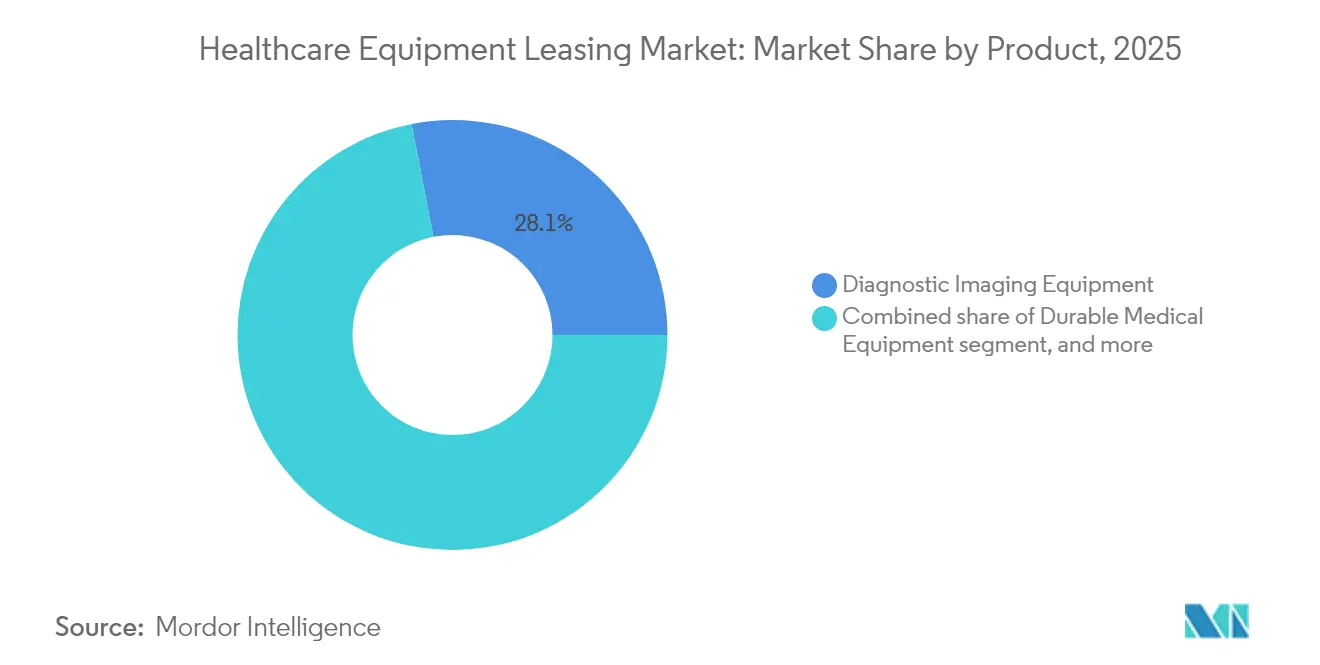
Diagnostic Imaging Leads Digital TransformationDiagnostic imaging held 28.05% of 2025 revenue, underscoring its critical role in treatment pathways and its sizable capital requirements. MRI, CT, and ultrasound systems command premium lease rates, and providers rely on these arrangements to avoid aging fleets that hinder clinical throughput. The healthcare equipment market share for imaging remains stable as demand for precision diagnostics and minimally invasive interventions rises in oncology and cardiology.
Digital and electronic equipment is advancing at 17.12% CAGR, the highest among product categories, propelled by AI-integrated monitors, connected ventilators, and smart IV pumps. Short technology cycles encourage two- to three-year terms with mid-cycle upgrades. The healthcare equipment market size for connected devices widens as interoperability mandates push hospitals toward platform overhaul. Patient monitoring, life-support, and surgical robotics follow with steady gains, each supported by leasing programs that bundle training and analytics support. Durable medical equipment and laboratory analyzers sustain predictable replacement schedules, while portable home-care devices open a new frontier for the healthcare equipment leasing market among aging populations.

By Lease Type:
Operating Models Dominate Service EvolutionOperating leases represented 63.68% of 2025 transactions, favored for their flexible end-of-term options and off-setting of obsolescence risk. Hospitals align these structures with budget cycles, often embedding variable usage clauses to match seasonal procedure volumes. The healthcare equipment leasing market size tied to operating agreements benefits from predictable monthly payments that preserve credit lines.
Managed equipment service agreements are expanding at 17.24% CAGR, reflecting demand for turnkey solutions that combine hardware, software, and managed services. Lessors assume maintenance, compliance, and performance metrics, easing the operational burden on providers. Capital leases appeal to institutions targeting eventual ownership for long-life assets such as radiotherapy vaults, while sale-leaseback structures monetize legacy fleets to fund digital upgrades. The growing appeal of full-service models demonstrates the healthcare equipment leasing market progression from financing tool to integrated performance partnership.
By End User:
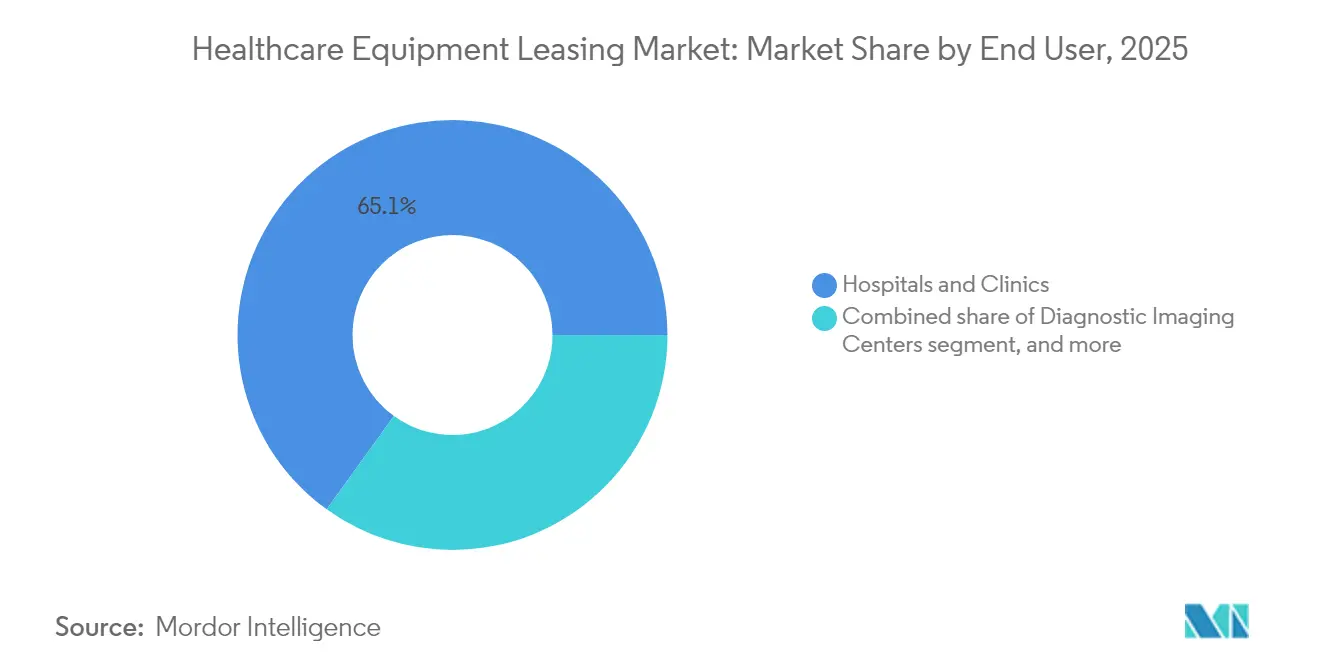
Hospitals Anchor Home Care AccelerationHospitals and clinics generated 65.05% of 2025 leasing volume, driven by multi-disciplinary equipment needs across inpatient, outpatient, and emergency settings. High-acuity environments demand constant technology refresh, especially in imaging, surgery, and critical care units. The healthcare equipment market share held by hospitals stays dominant as integrated delivery networks consolidate purchasing.
Home healthcare providers are expanding at 17.95% CAGR, mirroring policy moves that reimburse hospital-at-home programs and remote vital-sign monitoring. Portable oxygen concentrators, tele-ECG kits, and connected infusion pumps rank among high-demand assets. The healthcare equipment market size attributable to home-based care grows as payers reward reduced readmissions and patient satisfaction. Diagnostic imaging centers and ambulatory surgical centers follow with robust uptake, leveraging leasing to match rising outpatient procedure volumes without inflating capex burdens. Long-term care and rehabilitation facilities maintain steady participation, updating mobility aids and rehabilitation robotics to improve outcomes for aging cohorts.
By Duration:
Short-Term Flexibility Yields to Strategic PartnershipsShort-term leases under 12 months accounted for 45.12% of 2025 volume, reflecting pandemic-era urgency and the need to trial AI-ready devices before rolling out system-wide. The healthcare equipment leasing market share linked to short-term contracts remains sizable as providers cope with unpredictable demand surges.
Long-term arrangements above three years are rising at 17.02% CAGR, signaling confidence in integrated partnerships that stabilize costs and secure multiyear upgrade paths. FDA’s forthcoming Quality Management System Regulation will heighten documentation requirements, favoring lessors with robust compliance support. Medium-term leases between one and three years bridge flexibility and cost efficiency for equipment with moderate obsolescence risk. As lifecycle management disciplines mature, providers align lease tenors with clinical road maps, solidifying the healthcare equipment leasing market’s role in strategic capital planning.
Geography Analysis
North America Healthcare Equipment Leasing Market
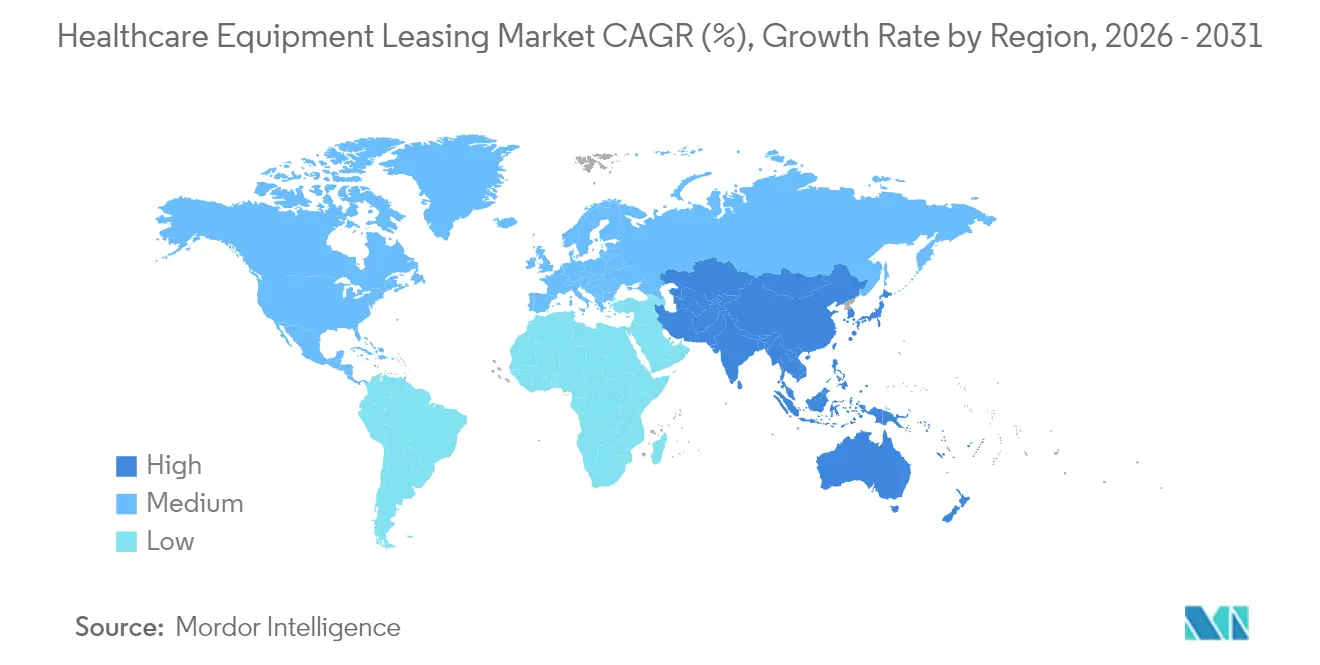
North America contributed 41.25% of 2025 revenue, supported by sophisticated reimbursement models, established leasing infrastructure, and regulators that value operational flexibility. Providers replace capital-intensive imaging suites and surgical robots via service contracts that ensure uptime and continuous updates. The healthcare equipment market size in the region benefits from tight hospital margins and competitive technology benchmarks.
EMEA, APAC and South America Healthcare Equipment Leasing Market
Europe posts steady growth as modernization programs and cross-border procurement initiatives standardize leasing frameworks. Aging populations and digital health directives create recurring replacement cycles for imaging, infusion, and monitoring systems. Asia-Pacific, the fastest-growing territory at 16.08% CAGR, witnesses rapid infrastructure build-out across China, India, and ASEAN states. Public-private partnerships, rising middle-class demand, and clinical capacity shortages make leasing integral to timely facility expansion. Middle East and Africa add incremental demand as government projects in the Gulf integrate turnkey leasing packages for new specialty centers. South America experiences cyclical uptake tied to economic stability, with private payers in Brazil and Chile emphasizing AI-enhanced diagnostics. The geographic spread underscores that the healthcare equipment leasing market scales across maturity levels by tailoring contract terms to regulatory, fiscal, and clinical nuances.
Regulatory Landscape
Healthcare equipment leasing is shaped by a mix of medical-device quality, servicing, and post-market obligations that influence how lessors structure lifecycle management and managed equipment service agreements. In the United States, the FDA regulates medical devices under a risk-based framework, and as of February 2026 the Quality Management System Regulation (QMSR) became effective. The update aligns quality system expectations with ISO 13485:2016 and revises inspection oversight through the Inspection of Medical Device Manufacturers Compliance Program 7382.850. For lessors, this raises the value of models that bundle compliant maintenance, traceability, and service records into the lease.
In Europe, the Medical Device Regulation (EU) 2017/745 continues to drive compliance expectations for devices deployed under leasing models, with tightened conformity assessment and post-market requirements. In May 2026, Implementing Regulation (EU) 2026/977 was adopted to establish more uniform procedural and quality management requirements for notified bodies performing conformity assessment activities under MDR and IVDR. This affects how OEMs and finance partners plan approvals, upgrades, and change control. In China, Pudong New Area introduced provisions effective April 2025 for medical device finance leasing, requiring leasing companies to establish quality management systems aligned with Good Supply Practice (GSP) and to submit annual self-inspection reporting, which is pushing global lessors to maintain localized compliance playbooks.
Competitive Landscape
The healthcare equipment leasing market remains moderately fragmented. Captive finance units of Siemens Healthineers, GE HealthCare, and Philips combine OEM knowledge with tailored funding, gaining share in outcome-based contracts. Independent lessors such as CHG-MERIDIAN excel in multi-vendor portfolios and niche modalities, while Med One Group focuses on short-term flexibility for infusion, respiratory, and monitoring equipment.
Strategic maneuvers pivot toward value partnerships. Siemens Healthineers opened mega depots in New York and California to boost 30% additional parts inventory, reinforcing uptime guarantees[3]. GE HealthCare’s AI-enabled imaging deal with Sutter Health exemplifies technology-plus-service bundling. Private equity interest remains high: Frazier Healthcare Partners’ acquisition of DirectMed Imaging aims to deepen access to aftermarket parts for radiology fleets.
Technology integration differentiates competitors. AI analytics, IoT telemetry, and predictive maintenance portals improve asset utilization and reduce unplanned downtime. Lessors able to document compliance under upcoming FDA QMSR earn preference among large health systems. White-space opportunities include financing for home-based care devices, digital therapeutics, and emerging-market mobile clinics, indicating ample room for specialized entrants.
Healthcare Equipment Leasing Industry Leaders
-
Agiliti Health, Inc
-
Getinge AB
-
Koninklijke Philips NV
-
US Med-Equip
-
Baxter International Inc.
- *Disclaimer: Major Players sorted in no particular order
Healthcare Equipment Leasing Market Companies Covered in this Report
- Agiliti Health Inc.
- Avensys UK Ltd.
- Baxter
- GE Healthcare
- Getinge
- Koninklijke Philips
- Med One Group
- Mizuho Leasing Company Ltd.
- Prudential Leasing
- Siemens Healthineers
- US Med-Equip
- De Lage Landen International (DLL)
- Stryker
- Siemens Financial Services
- Key Equipment Finance
- Meridian Leasing Corp.
- First American Healthcare Finance
- Canon Medical Systems USA Inc.
- National Technology Leasing Services
- Dragerwerk
- Hill-Rom
Market Opportunities and Future Outlook
Leasing demand is widening beyond traditional imaging refresh cycles into digitally integrated fleets where uptime, cybersecurity hygiene, and software-enabled upgrades are bundled alongside financing. The market shows whitespace for lessors and OEM captive finance arms that can package ISO 13485-aligned servicing evidence, remote monitoring, and lifecycle analytics into outcome-based managed equipment service agreements. This opportunity is reinforced as QMSR (effective February 2026 in the United States) and MDR-driven processes in Europe tighten expectations around documentation and change control. Siemens Healthineers value partnerships, including its 10-year Tower Health agreement, and GE HealthCare health-system agreements, including its Sutter Health collaboration, point toward larger multi-year, multi-site bundles where financing, upgrades, and operational performance are negotiated together.
Near-term procurement also supports flexible structures that match selective capital allocation and ROI scrutiny. Trade and association signals in 2026 point to more disciplined capex prioritization, favoring revenue-driving procedural tools and digitally enabled platforms over discretionary capital spend. That supports operating leases and subscription-like arrangements for imaging, monitoring, and IT-adjacent digital equipment with fast refresh cycles. Home-care and hospital-at-home models expand the addressable installed base for portable monitors, connected infusion, and respiratory devices, which fits short- and medium-term leasing structures that include fleet management, swap-outs, and redeployment. At the same time, the availability of refurbished and second-life equipment pressures pricing on standard modalities, creating a service-led opening for lessors that differentiate through certified maintenance, guaranteed uptime, and built-in upgrade paths rather than relying on rates alone.
Recent Industry Developments in Healthcare Equipment Leasing Market
- June 2026: Agiliti announced an exclusive US agreement with VitalGo Systems Ltd. to provide the Total Lift Bed, expanding its portfolio in critical care mobility solutions. The announcement strengthens Agiliti's ability to offer differentiated bed and mobility fleets under rental and service-led models used by hospitals to manage utilization and reduce upfront capital needs.
- June 2026: Philips and WellSpan Health entered a 7-year strategic alliance to deploy AI-driven imaging platforms across 12 hospitals in Central Pennsylvania and Northern Maryland. The multi-year structure reinforces the shift toward enterprise agreements that combine technology refresh, software, and lifecycle support, supporting leasing-like consumption models for large health systems.
- December 2024: CHG-MERIDIAN acquired Meridian Leasing Corporation, expanding its North American healthcare footprint. The acquisition increases scale in multi-vendor financing and lifecycle services, improving support for hospitals and clinics seeking consolidated leasing partners across imaging, monitoring, and broader equipment categories.
Healthcare Equipment Leasing Market Report Scope and Research Methodology
Market Definition and Coverage
Healthcare equipment leasing is measured as the value of lease and rental payments earned from providing medical devices to healthcare users for a fixed period. This includes operating-style rentals and longer-term lease contracts tied to equipment use.
Scope exclusions: Excludes outright equipment sales revenue, internal hospital-owned equipment sharing programs, and non-healthcare industrial leasing.
Segments Covered in This Report
- By Product
- Diagnostic Imaging Equipment
- Durable Medical Equipment
- Surgical & Therapy Equipment
- Patient Monitoring & Life-support
- Digital & Electronic Equipment
- Storage & Transport Equipment
- Home-care Equipment
- Laboratory & Analytical Equipment
- By Lease Type
- Operating Lease
- Capital/Finance Lease
- Sale-Leaseback
- Managed Equipment Service Agreement
- By End User
- Hospitals & Clinics
- Diagnostic Imaging Centers
- Ambulatory Surgical Centers
- Home Healthcare Providers
- Long-term Care & Rehabilitation Facilities
- By Duration
- Short-term (< 12 months)
- Medium-term (1-3 years)
- Long-term (> 3 years)
- Geography
- North America
- United States
- Canada
- Mexico
- Europe
- Germany
- United Kingdom
- France
- Italy
- Spain
- Rest of Europe
- Asia-Pacific
- China
- Japan
- India
- Australia
- South Korea
- Rest of Asia-Pacific
- Middle East & Africa
- GCC
- South Africa
- Rest of Middle East & Africa
- South America
- Brazil
- Argentina
- Rest of South America
- North America
Data Sources, Market Sizing, and Validation
Desk Research
Desk research started with building the market boundary around leasing economics. That meant we emphasized demand triggers and the financing environment, not only device shipment volumes. We referred to public sources such as the US Bureau of Economic Analysis (healthcare investment and price series), the US Census Bureau (business patterns for relevant service activities), OECD Health Statistics, and the World Bank health expenditure indicators to sense-check country spending capacity and growth direction.
We also reviewed materials that explain financing penetration and usage patterns, including equipment leasing and finance association reports, plus procurement and utilization guidance from public health systems and regulators where available. Annual reports, investor presentations, and earnings commentary from listed lessors, finance arms, and large healthcare providers were used to understand pricing logic (lease rate factors), contract length, and service attachment patterns. For hard-to-find company-level revenue splits, we relied on paid subscriptions focused on company financials and intelligence, supplemented by news and financial statements. We also checked patent databases to track technology refresh cycles that affect replacement leasing. These desk sources were not exhaustive, and we used additional public and paid references for data collection, validation, and clarification.
Primary Interviews and Surveys
Primary work was used to verify which equipment classes get leased most often, how contract structures differ by care setting, and how pricing moves with interest rates and equipment refresh. We spoke with equipment lessors, distributors involved in rental programs, hospital procurement teams, and diagnostic center operators across APAC, EMEA, and the Americas to close gaps left by public data, then confirm the final assumptions.
Distribution of primary research fieldwork respondents
| Company type | Respondent position | Region |
|---|---|---|
| Top tier: 39% | CXOs: 16% | APAC: 47% |
| Mid tier: 42% | Functional/Unit leaders: 25% | EMEA: 32% |
| Smaller Players: 19% | Managers: 59% | Americas: 21% |
Market-Sizing & Forecasting
Sizing used a top-down and bottom-up blend. The starting point was country-level healthcare capital spending signals and equipment intensity, which were then translated into a leasing demand pool using penetration assumptions by care setting. In practice, we mapped major equipment classes commonly leased, linked them to typical replacement cycles, and applied lease rate factors reflecting contract tenure and servicing bundles.
To keep the model anchored, we tracked inputs such as diagnostic imaging installation trends, hospital and diagnostic center capacity additions, the share of equipment acquired through lease versus purchase, average lease tenor by equipment type, and interest rate direction, since it influences lease pricing and renewal behavior. Forecasting relied mainly on scenario analysis. Lease demand can shift with funding cycles, reimbursement pressure, and supply chain lead times, so these drivers were pressure-tested through expert feedback. Bottom-up checks were then used to corroborate totals, including sampled lessor revenue mixes, channel checks with distributors offering rental programs, and ASP-like lease payment benchmarks by equipment category. Where gaps existed, we used proxy mixes from similar countries and then corrected them through interview-based reality checks.
Data Validation & Update Cycle
Outputs were validated through triangulation across three layers, macro spend capacity, installed-base and refresh signals, and leasing penetration and pricing from interviews. If a country result looked unusually high or low, we rechecked currency timing and inflation assumptions, and assessed whether one-off hospital expansion programs were being over-weighted.
Before sign-off, the draft model went through multi-step analyst review. Assumptions were challenged against independent indicators and recent news signals, and the most sensitive inputs were recalibrated. Reports are refreshed annually, with interim updates when material events occur, such as rate shocks, major reimbursement changes, or abrupt supply disruptions. Right before delivery, a final pass is completed so clients receive the latest updated view.
Mordor Intelligence's Healthcare Equipment Leasing Market Size Measured Against Other Published Estimates
Published numbers for healthcare equipment leasing rarely align, because the market can be counted using different revenue points and even different definitions of leasing. Some publishers focus only on short-term rentals, others blend in broader equipment finance, and differences in year and currency conversion timing can also move the reported total.
Refurbished equipment rental programs are treated differently across sources, and this can shift the total because the payment profile and contract terms differ from new equipment leases, which sits outside Mordor Intelligence scope for this title. Additional variance can come from whether service and maintenance charges are included in lease payments, how renewals are handled, and whether regional adoption rates are taken from public proxies or validated directly with buyers and lessors.
Benchmark comparison
| Source | Market Size | Gaps in Research Methodology |
|---|---|---|
| Mordor Intelligence | USD 149.69 B (2026) | |
| Industry Research House A | USD 115.67 B (2025) | Uses an earlier base year and typically applies a slower growth path, which can understate the impact of post-2025 equipment upgrades and renewed leasing penetration in imaging and monitoring categories. |
| Market Update Publisher B | USD 65.54 B (2025) | Often appears to emphasize narrower rental-style programs and may exclude longer-tenor leases tied to capital equipment, which reduces the captured value even when the same end users are discussed. |
Overall, the differences track what each source counts as leasing revenue, how refurbished and rental programs are treated, and which year is used as the anchor. By linking the market to clear demand indicators like replacement cycles, adoption by care setting, and realistic lease pricing behavior, the final estimate remains repeatable and easier to audit over time.
Key Questions Answered in the Report
What is the current value of the healthcare equipment leasing market?
The healthcare equipment leasing market stands at USD 149.69 billion in 2026.
How fast is the sector projected to grow over the next five years?
Market value is forecast to reach USD 304.93 billion by 2031, advancing at a 15.29% CAGR.
Which product category commands the highest share of leased assets?
Diagnostic imaging equipment leads with 28.05% share in 2025.
Which end-user segment is growing the quickest?
Home healthcare providers are expanding at 17.95% CAGR through 2031.
Why are managed equipment service agreements gaining traction?
They bundle hardware, software, maintenance, and performance guarantees, rising at 17.24% CAGR.
Which region offers the strongest growth opportunity?
Asia-Pacific is projected to expand at 16.08% CAGR, driven by rapid infrastructure build-out.