
Healthcare Distribution Market Size and Share
Market Overview
| Study Period | 2020 - 2031 |
|---|---|
| Market Size (2026) | USD 1.18 Billion |
| Market Size (2031) | USD 1.61 Billion |
| Growth Rate (2026 - 2031) | 6.37 % |
| Fastest Growing Market | Asia-Pacific |
| Largest Market | North America |
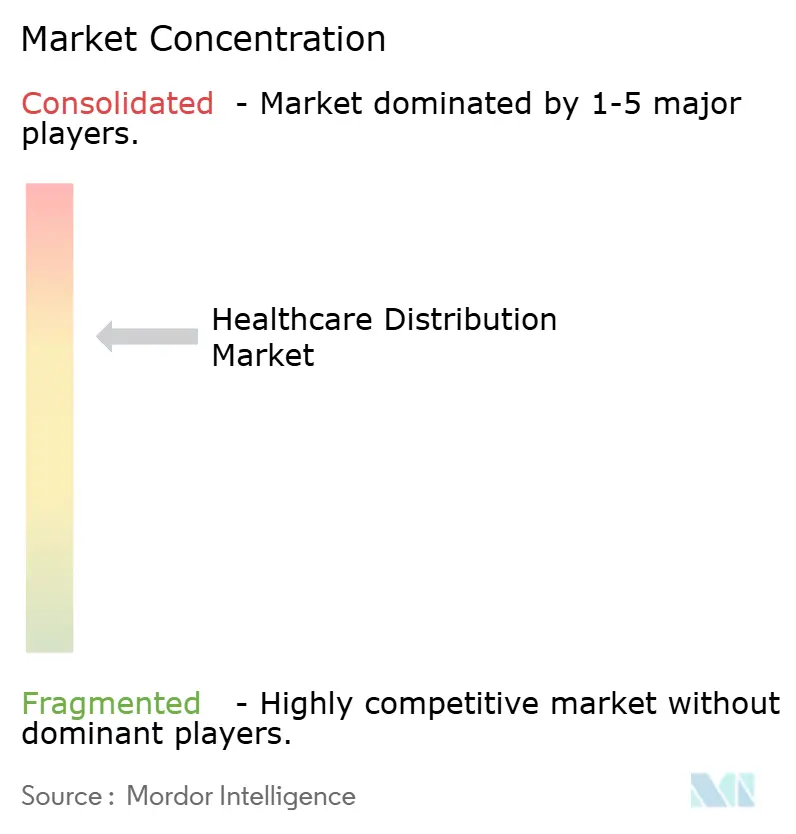
| Market Concentration | Medium |
Major Players *Disclaimer: Major Players sorted in no particular order Image © Mordor Intelligence. Reuse requires attribution under CC BY 4.0. | |
Healthcare Distribution Market Analysis by Mordor Intelligence
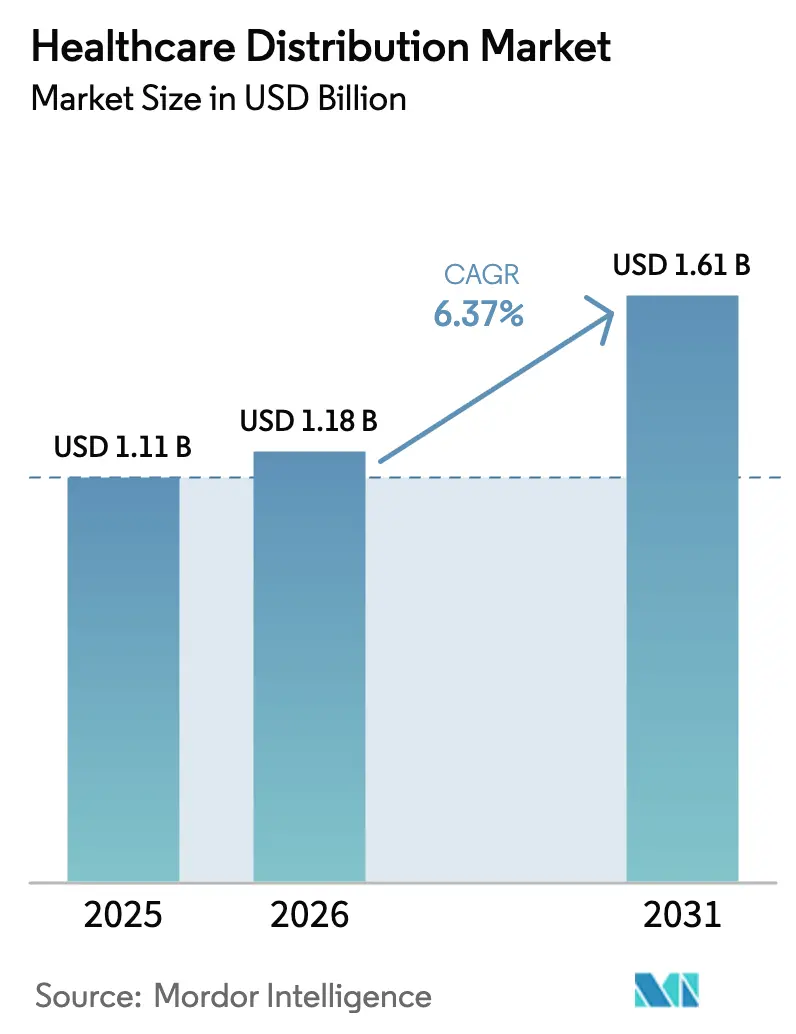
The healthcare distribution market size was valued at USD 1.11 billion in 2025 and estimated to grow from USD 1.18 billion in 2026 to reach USD 1.61 billion by 2031, at a CAGR of 6.37% during the forecast period (2026-2031). Rising pharmaceutical expenditure, the rapid shift toward biologics, and regulatory mandates that favor track-and-trace technologies are accelerating consolidation and technology investment across the healthcare distribution market. Specialty therapies now account for the bulk of revenue growth, which rewards distributors that operate certified cold-chain networks and advanced serialization systems. E-commerce, mail-order adoption, and provider consolidation are reshaping channel strategies, while geopolitical risk and climate volatility are forcing redundancy in global supply chains. At the same time, vertical integration—often through the acquisition of physician networks or specialty practices—signals an industry pivot from volume-based wholesaling toward value-based, data-rich service models in the healthcare distribution market.
Key Report Takeaways
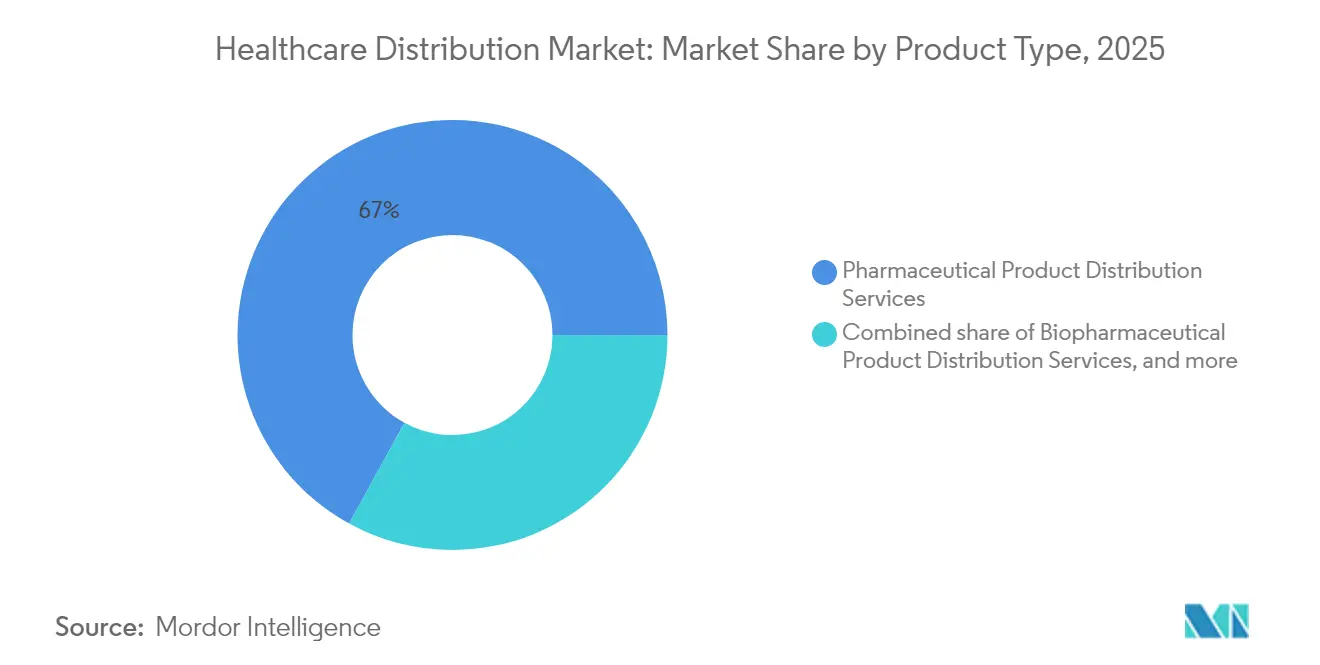
- By product type, Pharmaceutical Product Distribution Services led with 67.02% revenue share in 2025, while Biopharmaceutical Product Distribution Services is projected to expand at an 8.21% CAGR to 2031.
- By service type, Warehousing & Storage held 46.05% of the healthcare distribution market share in 2025; Cold-Chain Logistics is advancing at an 8.41% CAGR through 2031.
- By end-user, Retail Pharmacies accounted for 53.78% share of the healthcare distribution market size in 2025, yet Hospital Pharmacies record the highest projected CAGR at 9.45% over the same period
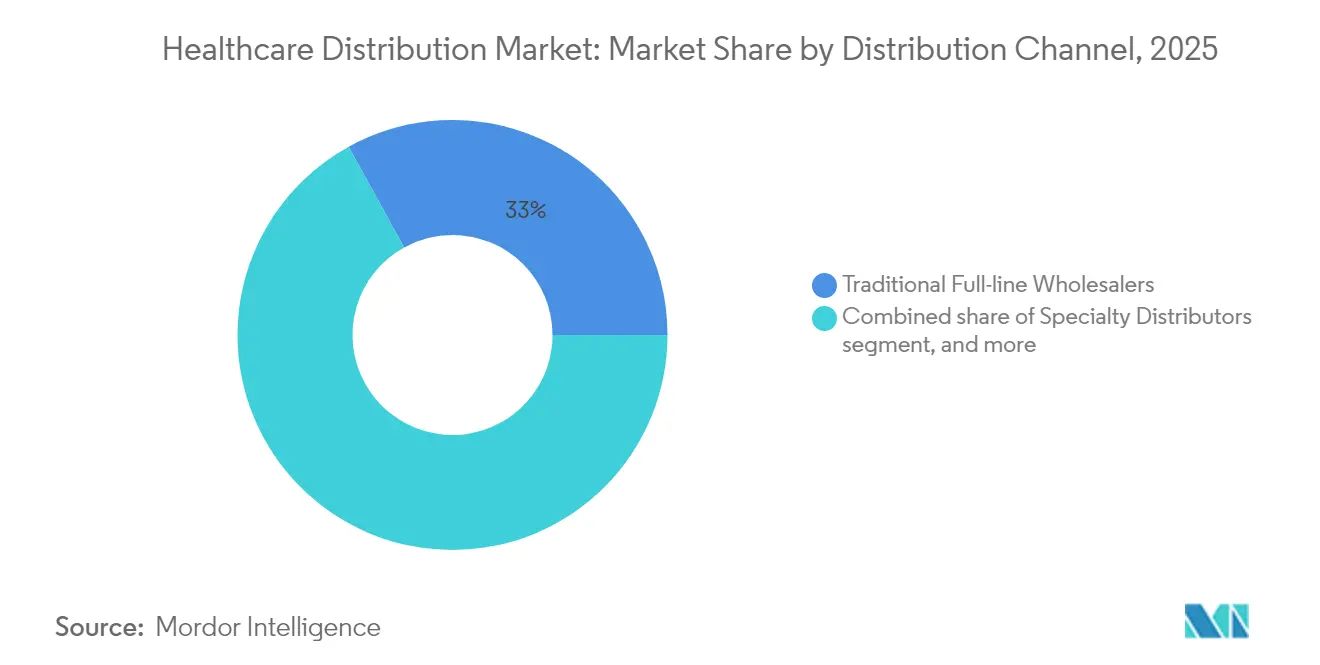
- By distribution channel, Traditional Full-line Wholesalers maintained 33.02% share in 2025, while Specialty and other emerging channels are growing at 9.31% CAGR.
- By delivery mode, Non-Cold Chain services dominated with 79.64% share in 2025; Cold Chain delivery solutions are expanding at a 9.06% CAGR to 2031.
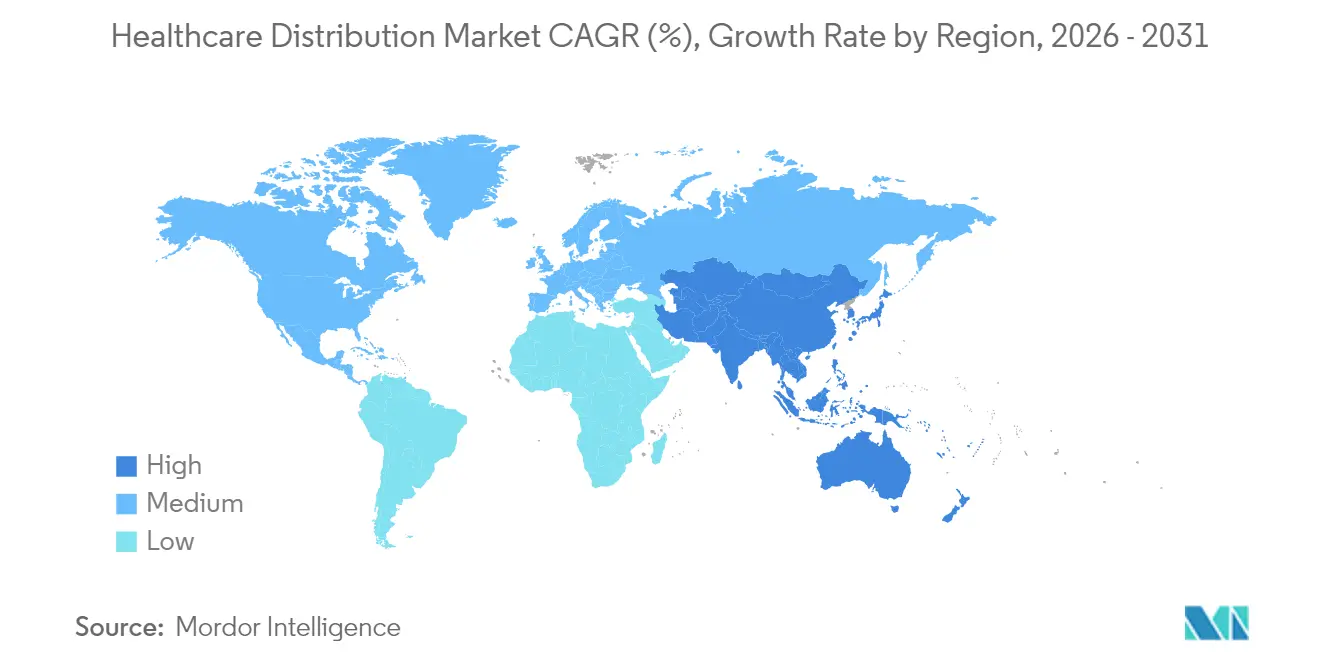
- By geography, North America commanded 43.21% of 2025 revenue, whereas Asia-Pacific is forecast to register the fastest growth at 7.32% CAGR.
Note: Market size and forecast figures in this report are generated using Mordor Intelligence’s proprietary estimation framework, updated with the latest available data and insights as of 2026.
Global Healthcare Distribution Market Trends and Insights
Drivers Impact Analysis*
| Driver | % Impact on CAGR Forecast | Geographic Relevance | Impact Timeline |
|---|---|---|---|
| Rising global pharmaceutical expenditure | +1.1% | Global, strongest in North America & Europe | Medium term (2-4 years) |
| Expansion of biologics and specialty therapies | +1.8% | Developed markets with established regulatory pathways | Long term (≥4 years) |
| Aging population and increased medication demand | +2.1% | North America, Europe, Japan | Long term (≥4 years) |
| Growth of e-commerce and mail-order pharmacies | +1.2% | North America & Europe; gaining traction in Asia-Pacific | Short term (≤2 years) |
| Regulatory emphasis on supply-chain security | +0.9% | North America primary, EU following | Medium term (2-4 years) |
| Healthcare provider consolidation driving bulk purchasing | +0.8% | North America & Europe; emerging in urban Asia-Pacific | Medium term (2-4 years) |
| Source: Mordor Intelligence | |||
Rising Global Pharmaceutical Expenditure
Global drug spending reached USD 1.48 trillion in 2024, and every incremental USD 1 in medicine outlays generates roughly USD 0.15 in distribution revenue. Specialty products now form 54% of spend despite just 2% of volumes, tilting the healthcare distribution market toward high-value, low-volume shipments. Distributors that operate GDP-certified cold-chain facilities capture premium handling fees, especially in oncology and rare diseases where a single treatment course can exceed USD 100,000 per patient. Value-based care models intensify demand for supply-chain analytics and inventory optimization that reduce waste and improve adherence. Competition for manufacturer contracts has therefore sharpened, prioritizing partners that bundle patient-support programs with proven logistics performance.
Expansion of Biologics and Specialty Therapies
Biologics exceeded USD 451 billion in sales during 2024 and require storage temperatures as low as –80 °C, which can triple handling costs versus conventional drugs[1]. Cell and gene therapies heighten complexity, as a single personalized shipment may hold USD 2–3 million in product value and must arrive within tightly defined time windows. Market leaders are investing accordingly: DHL has earmarked EUR 2 billion through 2030 for new pharma hubs, validated cold rooms, and digital monitoring solutions. Smaller distributors frequently exit this segment because capex for ultra-cold infrastructure and compliance far exceeds their balance-sheet capacity, catalyzing further consolidation within the healthcare distribution market.
Growth of E-Commerce and Mail-Order Pharmacies
Online prescription volumes are expanding 38% per year, reshaping last-mile requirements for small, frequent, trackable parcels rather than bulk store replenishment. Amazon Pharmacy’s entry highlights competitive pressure to deliver two-day or even same-day fulfillment. Centralized automation at mail-order hubs favors distributors with scalable inventory and robotics systems, while subscription programs for chronic conditions depend on real-time demand sensing and predictive stocking. Retail pharmacies are countering with omnichannel offerings, but the growth trajectory clearly channels new scale toward digitally oriented logistics networks in the healthcare distribution market.
Regulatory Emphasis on Supply-Chain Security
The Drug Supply Chain Security Act, fully live since 2024, mandates electronic verification for every saleable unit in the United States. Equivalent serialization rules in the EU and several Asia-Pacific markets are converging, compelling distributors to install interoperable track-and-trace platforms. Blockchain pilots and AI-driven anomaly detection help meet those requirements and reduce counterfeit risk. Distributors capable of offering compliance-as-a-service attract small manufacturers and pharmacies that lack the capital or expertise to manage regulatory data exchange internally.
Healthcare Provider Consolidation Driving Bulk Purchasing
Forty-nine hospital mergers closed in 2024, yielding systems that each spend more than USD 1 billion on drugs annually[2]. These entities negotiate directly with manufacturers and often outsource distribution under single, performance-linked contracts. Distributors must therefore integrate clinical education, formulary alignment, and data analytics to support value-based care. Many are pursuing vertical integration by acquiring physician groups or specialty clinics to secure dispensing margins and reduce channel leakage in the healthcare distribution market.
Restraints Impact Analysis*
| Restraints Impact Analysis | (~) % Impact on CAGR Forecast | Geographic Relevance | Impact Timeline |
|---|---|---|---|
| Margin compression from price-transparency initiatives | –1.2% | North America primary, expanding to Europe | Short term (≤2 years) |
| Supply-chain disruptions and geopolitical instability | –0.7% | Global, acute in trade-dependent regions | Medium term (2-4 years) |
| Stringent temperature-controlled logistics requirements | –0.6% | Global, most critical for biotech hubs in North America, Europe, Japan | Long term (≥4 years) |
| Workforce shortages in transportation and warehousing | –0.5% | North America & Europe; spreading to Asia-Pacific | Short term (≤2 years) |
| Source: Mordor Intelligence | |||
Margin Compression from Price Transparency Initiatives
Federal and state rules that demand disclosure of net drug prices are eroding traditional rebate economics, trimming distributor spreads and spurring a pivot toward fee-for-service contracts. The top three PBMs command about 80% of U.S. prescription claims, using that scale to negotiate lower distribution fees. Many states now set upper payment limits, which further squeeze margins. Consequently, distributors in the healthcare distribution market are investing in automation and analytics to cut operating costs and to offer value-added services that justify explicit handling fees.
Supply-Chain Disruptions and Geopolitical Instability
Eighty-seven percent of active pharmaceutical ingredients originate from China and India; any trade friction or factory shutdown reverberates globally. Drug shortages affected 295 molecules in 2024, compelling distributors to carry higher safety stock and dual-source strategies that raise working capital needs. Extreme weather and cyberattacks add parallel risk layers. In response, many firms are nearshoring or regionalizing supply nodes, although doing so elevates manufacturing costs that upstream partners often attempt to push downstream, pressuring distributor profitability in the healthcare distribution market.
*Our forecasts treat driver/restraint impacts as directional, not additive. The impact forecasts reflect baseline growth, mix effects, and variable interactions.
Segment Analysis
By Product Type: Biologics Drive Premium Services
Pharmaceutical product distribution services captured 67.02% revenue in 2025, reflecting large-volume demand for traditional small-molecule medicines. However, biopharmaceutical activities, notably monoclonal antibodies and cell therapies, are expanding at an 8.21% CAGR. Recombinant proteins lead the pace, propelled by autoimmune and oncology indications that require stringent temperature control and serialized packaging. Vaccines remain a steady baseline after COVID-19 created permanent cold-chain infrastructure. Integrated therapeutics such as insulin pumps now blur drug and device categories, offering distributors cross-portfolio bundling opportunities. The healthcare distribution market size for biologics is anticipated to exceed USD 706 million by 2031, representing more than 43.00% of total value. Distributors that finance ultra-cold vaults, execute reverse-logistics protocols for returns, and deploy IoT trackers gain preferred-partner status among manufacturers. As biosimilars rise, volumes grow while temperature requirements stay rigid, reinforcing demand for premium logistics services across the healthcare distribution market.
Second-generation gene therapies intensify complexity, because many products ship patient-specific payloads that must arrive within 24-48 hours. Service-level guarantees now tie payment milestones to clinical outcomes, obliging distributors to embed real-time monitoring and contingency routing. Advanced analytics predict lane-level bottlenecks, reducing spoilage and enabling risk-based inventory allocations. With these capabilities, large third-party logistics providers are displacing regional couriers in high-value lanes, further concentrating share among global players in the healthcare distribution market.

By Service Type: Cold-Chain Commands Growth Premium
Warehousing & storage held 46.05% share in 2025, underscoring the continuing weight of inventory management in the healthcare distribution market. Yet Cold-Chain Logistics is expanding at 8.41% CAGR, the fastest among service categories. End-to-end temperature management spans validated packaging, GPS-enabled data loggers, and GDP-certified cross-docks. Growth is magnified by biosimilars, mRNA vaccines, and emerging cell-therapy launches. Automation within ambient warehouses keeps occupancy costs down, allowing margin reinvestment into cold rooms and liquid nitrogen storage. Transportation & Freight networks have adopted active containers and software that reroutes shipments in flight when excursion risk rises. Reverse Logistics now handles both environmental stewardship and product-integrity mandates, bolstered by legislation on proper disposal of expired drugs.
The healthcare distribution industry increasingly sells bundled contracts that combine warehousing, pick-and-pack, and last-mile freight under one performance SLA, shifting procurement from transactional tariffs to multi-year service agreements. Distributors that exhibit sub-1% temperature excursions win long-term partnerships, creating high switching barriers. Consequently, regional firms collaborate via alliances to offer network scale without heavy capex, but their combined reach still lags the largest operators in the healthcare distribution market.
By End-User: Hospital Consolidation Drives Direct Models
Retail Pharmacies retained 53.78% of 2025 revenue yet face share erosion as chronic-care prescriptions migrate to home delivery platforms. Hospital Pharmacies, accelerating at 9.45% CAGR, harness consolidated buying power to secure direct procurement deals that cut intermediary layers. Group purchasing organizations are evolving into supply-chain orchestrators that set formulary compliance metrics and service penalties. Integrated health systems now request vendor-managed inventory, perpetual data feeds, and bedside scanning compatibility. The healthcare distribution market size for hospital channels is slated to reach USD 536 million by 2031. Distributors leverage embedded pharmacists and clinical liaisons to support therapy stewardship and reimbursement optimization, making service depth as important as unit price.
Other institutional buyers, including long-term care and ambulatory surgery centers, demand unit-dose repackaging, med-sync programs, and high-touch delivery windows. Distributors running dedicated closed-door facilities can secure these contracts. The healthcare distribution market is therefore segmenting into high-volume chronic scripts, high-acuity specialty regimens, and integrated hospital tenders, each with distinct logistics profiles and technology requirements.
By Distribution Channel: Specialty Distributors Gain Share
Traditional full-line wholesalers controlled 33.02% revenue in 2025 but are ceding ground to specialty distributors, whose 9.31% CAGR reflects a focus on critical therapies such as oncology, immunology, and rare disease treatments. Manufacturers favor these partners because they wrap clinical education, reimbursement support, and adherence tracking around physical delivery. The healthcare distribution market share for full-line wholesalers is expected to dip below 28.50% by 2031 as specialty players and direct-to-provider lanes expand. Mail-Order and online pharmacy networks scale rapidly, leveraging centralized robotics and nationwide carriers to compress fulfillment times while maintaining tight temperature control for chronic injectables.
Direct-to-hospital channels are growing, especially for biosimilars, because health systems seek to reduce pass-through markups. Specialty distributors employ field-based nurses and digital engagement platforms that support complex administration protocols, differentiating them from commodity bulk shippers. Data analytics from these engagements feed market-access strategies, providing real-world evidence to manufacturers and reinforcing the strategic role of distribution in therapeutic success within the healthcare distribution market.
By Delivery Mode: Temperature Control Drives Innovation
Non-cold chain services remain predominant with 79.64% revenue in 2025, but cold chain deliveries advance at 9.06% CAGR. Ultra-cold offerings down to -80 °C underpin cell and gene therapy launches, while controlled-room-temperature solutions cover the rising class of high-potency oral drugs. Multizone pallets that hold 2-8 °C biologics beside ambient devices in one crate reduce touchpoints and carbon footprint. The healthcare distribution market size for cold chain is forecast to top USD 328 million by 2031. IoT sensors now transmit lane-level temperatures in real time, auto-triggering contingency routes upon excursion risk. Distributors integrate these feeds with warehouse management systems to adjust replenishment and safety stock simultaneously.
Sustainability goals push for reusable passive containers and route optimization to cut dry-ice consumption. Regulators also require electronic records; thus, cloud platforms archive environmental data for a mandated decade. As a result, cold-chain competence has become a threshold requirement rather than a premium add-on, further elevating investment thresholds for new entrants in the healthcare distribution market.
Geography Analysis
North America contributed 43.21% revenue in 2025, anchored by the United States, where prescription spend surpassed USD 500 billion and DSCSA compliance has created a barrier for smaller firms. Canada’s single-payer formulary adds complexity, requiring contract diligence and bilingual labeling, while Mexico’s growing contract-manufacturing base strengthens north-south freight corridors. Health-system consolidation generates large integrated delivery networks that favor distributors with national coverage, advanced analytics, and proven cold-chain capacity. The healthcare distribution market size in North America is on track to climb to USD 705 million by 2031, even as pricing transparency squeezes average margins.
Asia-Pacific is the fastest-growing region at 7.32% CAGR. China’s aging population and expanded insurance coverage unlock scale, though intricate provincial licensing demands local alliances. India’s dominance in generics triggers volume-driven logistics models emphasizing cost control, while Japan’s mature biologics pipeline necessitates rigid temperature assurance. Southeast Asia is capitalizing on free-trade accords that promote regional hubs in Singapore and Malaysia, where distributors invest in dual-certified cold rooms to serve both public tenders and private hospitals. The healthcare distribution market is therefore bifurcating between high-growth emerging economies that value reach and affordability, and mature economies that prioritize specialty capability and regulatory depth. Europe maintains steady expansion supported by the Falsified Medicines Directive, which mandates unique identifiers and safety seals across 27 member states, thereby harmonizing compliance requirements. Unified labeling curbs counterfeit risks and aligns distributor IT investments. In Western Europe, national health services drive tenders that reward lowest-total-cost providers, encouraging distributors to blend consolidated transport with data-rich adherence programs. Central and Eastern Europe see rising biologics import volumes, spurring investment in GDP-validated facilities. The Middle East & Africa region is accelerating infrastructure upgrades funded by sovereign initiatives, especially in Gulf Cooperation Council countries that import high volumes of specialty therapies. South America benefits from Mercosur tariff structures, though currency volatility complicates contract pricing. Collectively, these regions contribute diversified growth vectors that will push the healthcare distribution market past USD 1.61 billion by 2031.
Regulatory Landscape
Supply-chain security and distribution-quality requirements remain central to healthcare distribution regulation, with the United States and European Union setting many of the technical and data-interoperability benchmarks for global networks. In the United States, the Drug Supply Chain Security Act (DSCSA) has been fully live since 2024, making electronic verification and serialized traceability operational requirements for many transactions. In April 2026, federal action on adjusting imports of pharmaceuticals and pharmaceutical ingredients added further trade-policy uncertainty for distributors managing cross-border sourcing and inventory costs.
In Europe, GDP expectations continue to be enforced through the European Medicines Agency (EMA) and national competent authorities, alongside anti-counterfeiting controls under the Falsified Medicines Directive. The European Commission proposed the Critical Medicines Act in 2025 (COM(2025) 102) to strengthen security of supply for critical medicinal products, reinforcing the role of procurement frameworks and supply diversification in distributor qualification. WHO guidance on good storage and distribution practices (TRS 1025 Annex 7) provides a reference framework that supports harmonization of temperature control, documentation, and quality systems for multi-country distribution operations.
Value Chain Analysis
The healthcare distribution value chain runs from manufacturers of small molecules, biologics, and medical devices to primary distributors, including full-line wholesalers and specialty distributors, and then to supporting logistics providers such as 3PL cold-chain operators, packaging specialists, and last-mile carriers. End users include retail pharmacies, hospital pharmacies, and other institutional providers. Payers and purchasing bodies, such as government programs, insurers, and group purchasing organizations, shape channel design through tendering, formulary compliance, and performance-linked service requirements that increasingly tie distribution selection to data exchange, inventory visibility, and service-level execution.
Operationally, value creation clusters around compliant storage, serialization-enabled order processing, temperature-controlled transport, and exception management for shortages and recalls. Recent network events and investments show resilience being built into the chain: Medline Industries activated contingency routing after a June 2026 fire destroyed a major California distribution center, while McKesson announced a new highly automated regional pharmaceutical distribution center in Moore, Oklahoma (USD 179 million) to expand capacity and support continuity. Together, these moves point to redundant node design, automation, and cold-chain capability as differentiators, alongside higher compliance overhead from track-and-trace and GDP requirements.
Competitive Landscape
The top three companies—McKesson, Cardinal Health, and Cencora—collectively hold around 65% of global revenue, giving the healthcare distribution market a moderately concentrated profile. Yet competitive tension has intensified as technology-centric entrants and vertically integrated manufacturers bypass traditional middle layers[3]. Incumbents counter by embedding predictive analytics, blockchain traceability, and robotic fulfillment that elevate service reliability while trimming unit costs. Many are also building clinical decision support and patient-engagement platforms, converting logistics nodes into data-enabled healthcare hubs.
Strategic acquisitions illustrate this shift. Cardinal Health spent USD 3.9 billion in 2024 to add GI Alliance and Advanced Diabetes Supply Group, boosting specialty disease focus and direct-patient touchpoints. DHL earmarked EUR 2 billion through 2030 to upgrade pharma hubs and acquire CRYOPDP, extending its presence in clinical-trial logistics. UPS followed by purchasing Frigo-Trans and BPL to reinforce its European cold-chain footprint. These moves compress the gap between express-parcel giants and traditional wholesalers, creating multi-polar competition within the healthcare distribution market.
Technology adoption remains the dominant differentiator. AI-driven demand forecasting lowers inventory obsolescence, while digital twins model lane-level risk to preempt temperature excursions. Warehouse robotics boost throughput and accuracy, enabling same-day cutoffs for e-commerce scripts. Blockchain pilots streamline DSCSA compliance and detect counterfeit diversion. Companies that deploy these systems at scale convert operational efficiency into margin defense, offsetting ongoing price-transparency pressure. Consequently, capital intensity and digital capability—not geographic reach alone—define future winners in the healthcare distribution market.
Healthcare Distribution Industry Leaders
-
McKesson Corporation
-
Cardinal Health
-
Cencora (AmerisourceBergen)
-
Owens & Minor
-
PHOENIX Group
- *Disclaimer: Major Players sorted in no particular order
Market Opportunities and Future Outlook
Specialty and temperature-sensitive distribution continues to create whitespace for operators that can combine validated cold chain, end-to-end visibility, and service layers around complex therapies. In 2026, activity shows capital moving toward this capability: UPS announced a USD 48 million investment in 27 temperature-controlled cross-dock facilities, and McKesson announced a USD 179 million, highly automated regional distribution center in Moore, Oklahoma with cold-chain capacity and standby power. These projects reflect demand for higher-throughput, higher-availability networks that can handle biologics and hospital-grade service levels.
Policy and procurement shifts are also creating opportunity for distributors that can support resilience needs for health systems and public buyers. The European Commission adopted the Global Health Resilience Initiative in May 2026, and EU discussions on critical medicines procurement emphasize supply diversification and multi-winner approaches, which raises the importance of multi-node distribution footprints and auditable quality systems. In the United States, the DSCSA operating environment and the April 2026 focus on pharmaceutical import dependence increase demand for compliance-ready data exchange, regional inventory strategies, and compliance-as-a-service offerings for smaller manufacturers and pharmacies that cannot manage serialization and verification workflows internally at scale.
Recent Industry Developments
- July 2026: Cardinal Health entered definitive agreements to acquire AdaptHealth Corp. Diabetes Health business and Strive Medical for about USD 360 million. The tuck-in deals expand Cardinal Healths home care capabilities and strengthen distribution touchpoints that serve direct-to-patient workflows, including recurring supply needs and chronic-condition support.
- June 2026: McKesson announced plans for a USD 179 million, 330,000-square-foot highly automated regional pharmaceutical distribution center in Moore, Oklahoma. The facility is designed to add modern capacity and cold-chain capability, reinforcing network resilience and service levels for central U.S. demand centers.
- November 2024: Cardinal Health disclosed USD 3.9 billion in specialty-focused acquisitions, including GI Alliance and Advanced Diabetes Supply Group. The transactions broadened exposure to higher-acuity therapy categories and reinforced the shift from pure wholesaling toward integrated specialty services tied to dispensing and patient support.
Research Methodology Framework and Report Scope
Market Definition and Coverage
For this report, the healthcare distribution market is defined as third-party distribution services that move healthcare products from manufacturers to dispensing and care sites. The scope is supported by warehousing, transportation, and cold-chain handling, and is measured in revenue terms.
Scope exclusions: Direct manufacturer-to-patient dispensing and in-house hospital self-distribution done without a third-party distributor are excluded.
Segmentation Overview
- By Product Type
- Pharmaceutical Product Distribution Services
- OTC Drugs
- Generic Drugs
- Branded Drugs
- Biopharmaceutical Product Distribution Services
- Recombinant Proteins
- Monoclonal Antibodies
- Vaccines
- Medical Devices Distribution Services
- Pharmaceutical Product Distribution Services
- By Service Type
- Warehousing & Storage
- Transportation & Freight (Non-cold chain)
- Cold-Chain Logistics
- Reverse Logistics & Returns
- By End-User
- Retail Pharmacies
- Hospital Pharmacies
- Other End-Users
- By Distribution Channel
- Traditional Full-line Wholesalers
- Specialty Distributors
- Mail-Order / Online Pharmacies
- Direct-to-Hospital (Manufacturer to Provider)
- By Delivery Mode
- Non-Cold Chain
- Cold Chain
- Geography
- North America
- United States
- Canada
- Mexico
- Europe
- Germany
- United Kingdom
- France
- Italy
- Spain
- Rest of Europe
- Asia-Pacific
- China
- Japan
- India
- Australia
- South Korea
- Rest of Asia-Pacific
- Middle East & Africa
- GCC
- South Africa
- Rest of Middle East & Africa
- South America
- Brazil
- Argentina
- Rest of South America
- North America
Data Sources, Market Sizing, and Validation
Desk Research
Desk research started with public regulatory and compliance references that shape distribution activity, including FDA Drug Supply Chain Security Act (DSCSA) milestones and public guidance. We also reviewed similar track-and-trace and GDP expectations outside the US. To build demand-side context and cross-border flows for key healthcare categories, we used open publications and data drops from sources such as the CDC, the US Census Bureau, the US International Trade Commission, and the World Bank.
To connect those signals back to revenue, we triangulated with company annual reports, investor presentations, and reputable press coverage that discusses channel mix, specialty share, and logistics intensity. We also checked patent databases to see where cold chain, serialization, and packaging automation investments are rising, which helped us sanity-check the service mix assumptions. For coverage where public data was too aggregated, we used a limited set of paid subscriptions mainly for company financial intelligence, news screening, and shipment-level import or export checks. These desk sources are illustrative, and many other public and paid references were used to collect, validate, and clarify data points through the build.
Primary Interviews and Surveys
Primary work was used to pressure-test what desk research could not confirm cleanly, especially how distributors classify service revenue across pharma, biopharma, and devices, and how cold-chain and specialty handling are priced in practice. We spoke with a mix of distributors, logistics partners, and downstream customers across the Americas, EMEA, and APAC, so assumptions could be aligned to real procurement behavior, service-level requirements, and channel shifts.
Distribution of primary research fieldwork respondents
| Company type | Respondent position | Region |
|---|---|---|
| Top tier: 37% | CXOs: 12% | APAC: 46% |
| Mid tier: 44% | Functional/Unit leaders: 32% | EMEA: 33% |
| Smaller Players: 19% | Managers: 56% | Americas: 21% |
Market-Sizing & Forecasting
Our market model uses top-down and bottom-up logic in a practical way. It starts from healthcare product distribution demand pools by region, then translates them into distributor service revenues using observed channel structures. The top-down approach was built around how prescription and healthcare product volumes are fulfilled across retail pharmacies, hospital pharmacies, and other end users, followed by adjustments for the share that routes through third-party distribution versus direct routes.
To keep the numbers tied to operating drivers, we used market fingerprints as inputs, such as prescription and therapy mix shifts that drive specialty handling. We also modeled biologics and vaccine handling needs that increase cold-chain requirements, inventory days and turns that influence throughput and warehousing intensity, and the pace of serialization and track-and-trace compliance that changes process costs. Typical service pricing signals were inferred using public disclosures, then refined through interviews, so revenue is not treated as a flat percentage of drug sales. We corroborated results with selective bottom-up approximations, including sampled revenue roll-ups from distributors with disclosed regional or segment splits. We also ran ASP-by-volume checks for key service lines where interview participants could share realistic ranges. Where bottom-up coverage was incomplete, we filled gaps using conservative penetration ranges by region and end-user channel, then re-checked them with follow-up calls when implied totals drifted.
For forecasting, we relied on scenario analysis supported by a simple multivariate regression layer. Growth tends to be driven by a few stable variables rather than one straight-line trend. The forecast used region-level expectations for healthcare spend, specialty and biologics share, cold-chain expansion, and channel shifts toward centralized procurement. Those drivers were reviewed with primary respondents to keep assumptions grounded in near-term planning cycles.
Data Validation & Update Cycle
Validation was done through step-by-step triangulation so no single source could swing the outcome. Model outputs were compared against independent signals such as disclosed distributor revenue trends, inventory and throughput indicators, and public policy or compliance milestones that can change distribution activity quickly.
Variance checks were run across regions and end users. Any outliers triggered a deeper review of inputs like channel share, cold-chain mix, and currency conversion timing. Before sign-off, another analyst reviews the calculation chain and key assumptions, and we re-contact relevant respondents when the model shows a break from what the market is reporting. Reports are refreshed annually, with interim updates when material events occur, and a final pre-delivery sweep is completed so clients receive the latest view available at the time of publication.
Mordor Intelligence's Healthcare Distribution Market Sizing Compared With Other Published Estimates
Published market sizes for healthcare distribution can look far apart because the scope line is not drawn the same way, and because some studies treat product value as distribution value when the market is actually a service layer. Differences also come from how specialty and cold-chain handling are priced, which end users are counted, and how currency and inflation timing are applied.
Direct pharmaceutical distributor sales (which often reflect the full medicine value moving through a channel) sit outside Mordor Intelligence's scope, since this study is built around distribution services and related handling revenues by product type and end user. Some publishers also bundle broader healthcare logistics or internal hospital operations, which can inflate totals, while others use aggressive assumptions for specialty mix and price progression without checking them against inventory turns, compliance timing, and channel feedback from interviews.
Benchmark comparison
| Source | Market Size | Gaps in Research Methodology |
|---|---|---|
| Mordor Intelligence | USD 1.18 B (2026) | |
| Industry Association A | USD 862.00 B (2024) | Represents pharmaceutical distributor sales in the traditional distribution sector, which is closer to the value of drugs sold through the channel rather than third-party distribution service revenue, and it is also reported on a US-centric basis. |
| Trade Journal B | USD 1050.20 B (2024) | Uses a broad global definition that appears to include product value across pharmaceuticals, biopharma, and devices by channel, which can materially lift the total versus a service-revenue view, and the base year and pricing mechanics are not fully transparent in public summaries. |
Across the three figures, the main takeaway is that the spread is driven more by what is being counted than by arithmetic. By keeping the model anchored to observable distribution activities (throughput, cold-chain intensity, channel shares, and disclosed revenue cues) and then validating the implied pricing with field feedback, our estimate stays traceable to repeatable steps that users can challenge and re-run.
Key Questions Answered in the Report
What is the current value of the healthcare distribution market?
The healthcare distribution market is valued at USD 1.18 billion in 2026 and is forecast to reach USD 1.61 billion by 2031.
Which region is growing fastest in the healthcare distribution market?
Asia-Pacific is expanding at a 7.32% CAGR, benefiting from healthcare infrastructure upgrades and rising medicine consumption.
Why is cold-chain logistics seeing higher growth than ambient services?
Cold-chain demand is climbing at 9.06% CAGR because biologics, cell therapies, and vaccines require strict temperature control, driving investment in specialized infrastructure.
How are price-transparency rules affecting distributors?
New transparency mandates reduce margin opportunities tied to opaque rebate structures, pushing distributors to adopt fee-for-service models and automation to preserve profitability.
What role does technology play in competitive differentiation?
AI-based forecasting, blockchain serialization, and robotic fulfillment improve accuracy and compliance, enabling distributors to secure long-term contracts and offset margin compression.
Which service type holds the largest share of the healthcare distribution market?
Warehousing & Storage leads with 46.05% revenue share, though Cold-Chain Logistics is the fastest-growing segment at 8.41% CAGR.