
Healthcare Contract Manufacturing Organization Market Size and Share
Market Overview
| Study Period | 2021 - 2032 |
|---|---|
| Market Size (2027) | USD 301.22 Billion |
| Market Size (2032) | USD 453.76 Billion |
| Growth Rate (2027 - 2032) | 8.54 % |
| Fastest Growing Market | Asia-Pacific |
| Largest Market | North America |
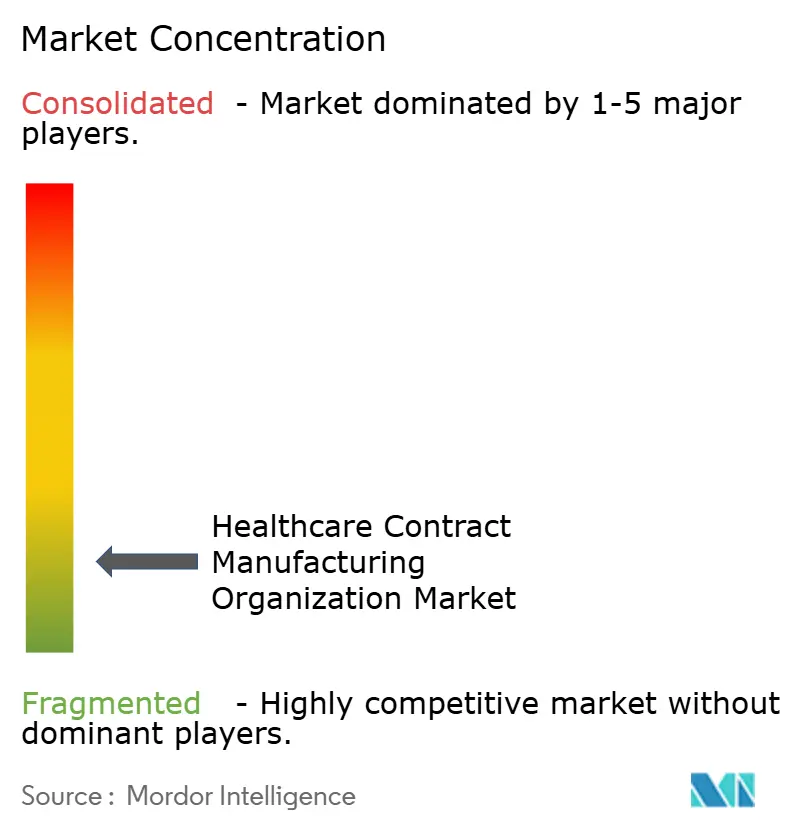
| Market Concentration | Low |
Major Players *Disclaimer: Major Players sorted in no particular order Image © Mordor Intelligence. Reuse requires attribution under CC BY 4.0. | |
Healthcare Contract Manufacturing Organization Market Analysis by Mordor Intelligence
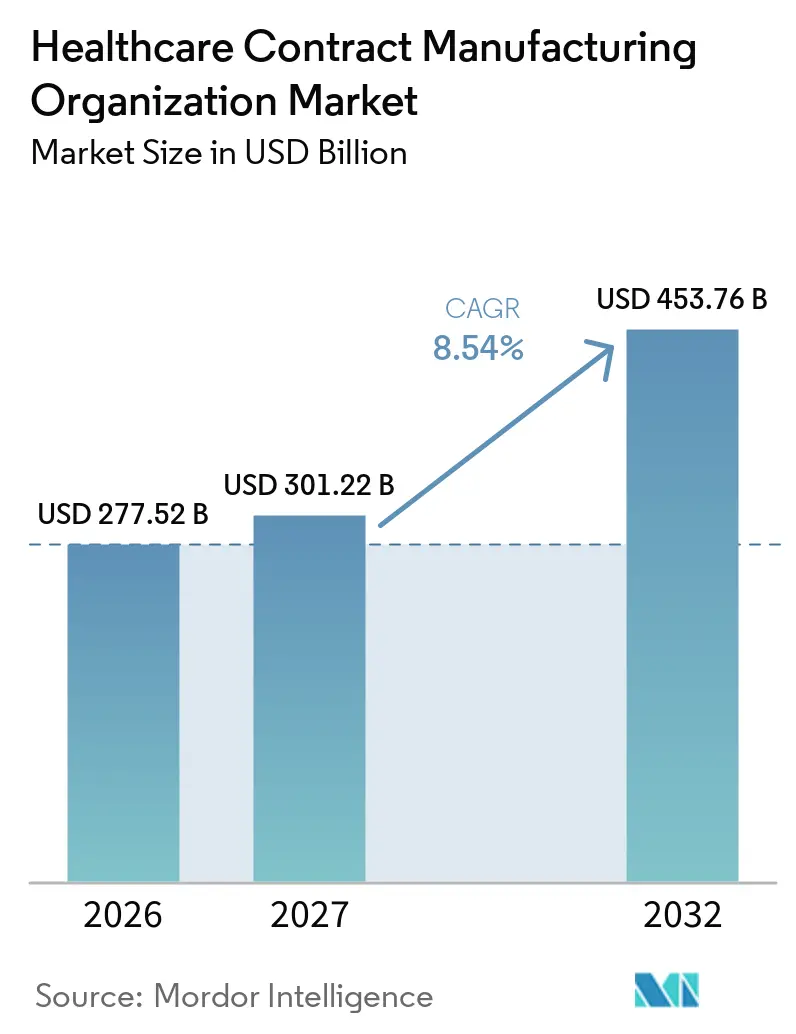
The Healthcare Contract Manufacturing Organization Market size is projected to expand from USD 277.52 billion in 2026 and USD 301.22 billion in 2027 to USD 453.76 billion by 2032, registering a CAGR of 8.54% between 2027 and 2032.
Momentum builds as pharmaceutical and medical-device innovators increasingly outsource complex production in order to navigate stringent regulations, secure advanced technologies, and maintain financial flexibility. Pharmaceutical manufacturing commands the dominant revenue stream, while viral-vector capacity shortages in gene-therapy pipelines accelerate investment in high-potency and advanced-therapy facilities. North America retains leadership thanks to deep R&D activity and well-established FDA frameworks. Yet, Asia Pacific is expanding fastest on the back of cost efficiency, improving regulatory standards, and near-shoring programmes that diversify supply chains. Competitive intensity remains moderate: the top five CDMOs hold only 15% of revenue, which leaves ample room for niche specialists. At the same time, cybersecurity threats, multijurisdictional compliance costs, and API import dependencies represent tangible risk factors that are pushing sponsors and CDMOs to reinforce digital security, quality systems, and regionalised sourcing models.
Key Report Takeaways
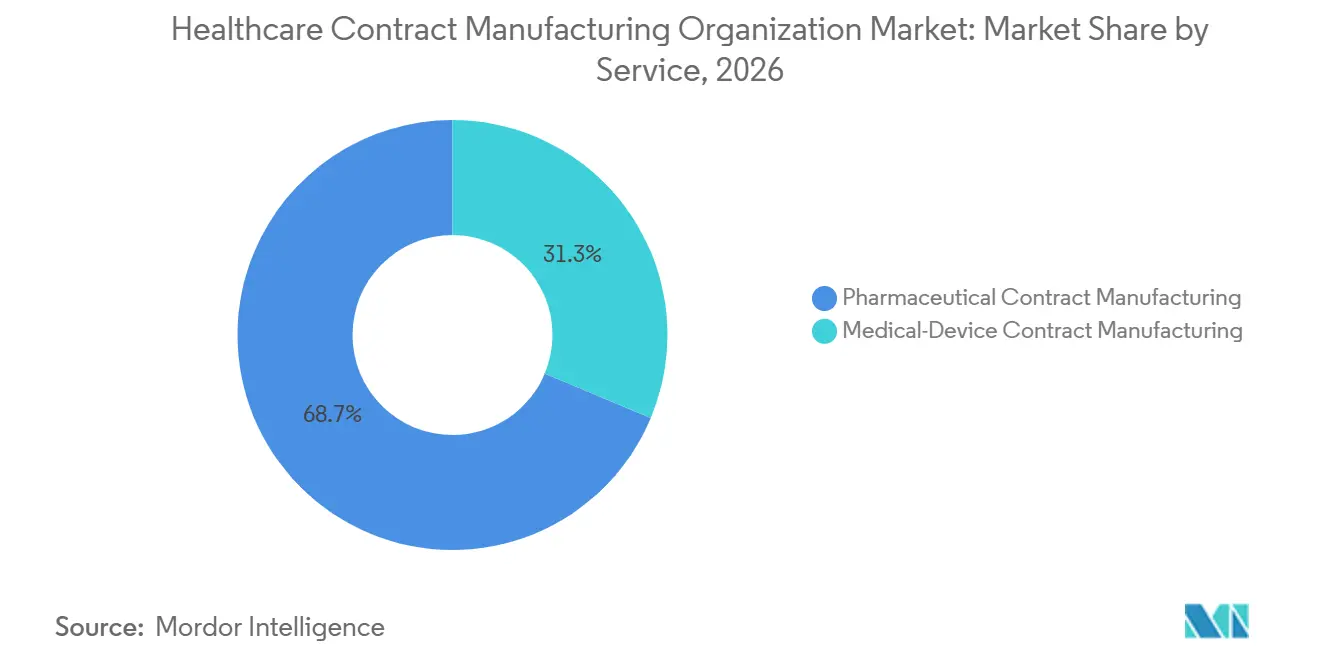
- By service type, pharmaceutical manufacturing led with 68.70% revenue share of the healthcare contract manufacturing organization market in 2026; the Finished dosage formulation segment is projected to advance at a 9.85% CAGR to 2032.
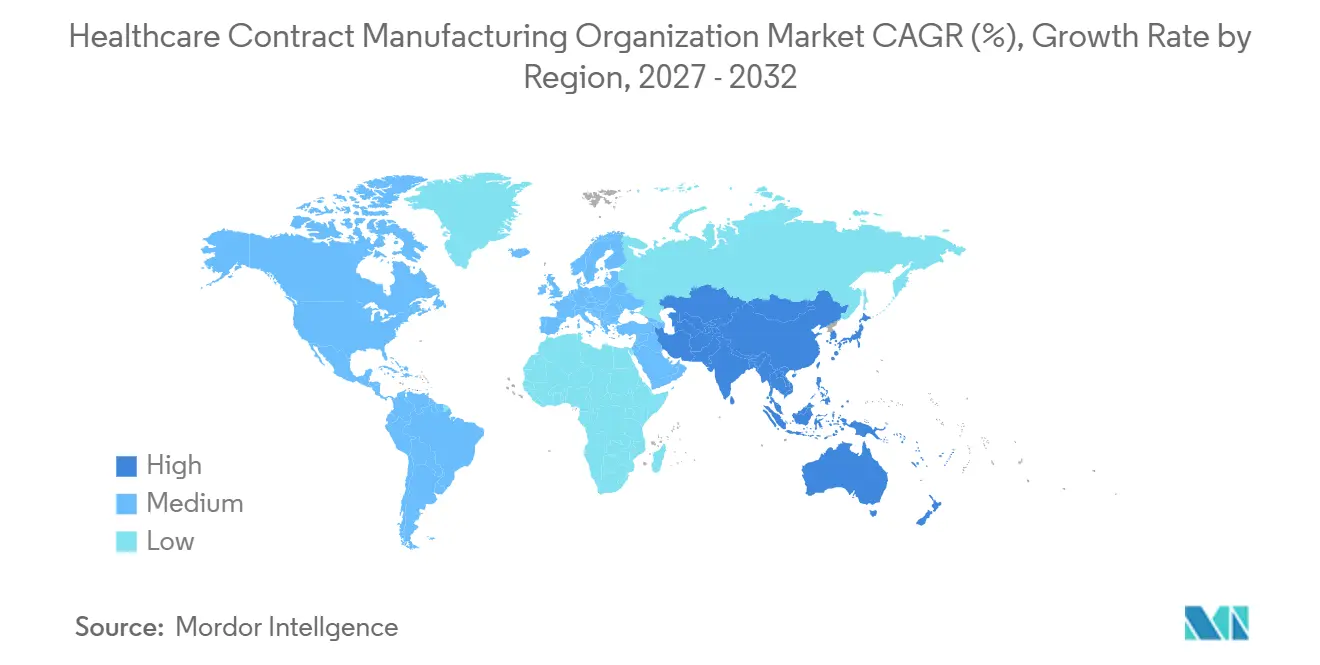
- By geography, North America captured 41.10% of the healthcare contract manufacturing organization market share in 2026, whereas the Asia Pacific is expanding at a 10.15% CAGR to 2032.
Note: Market numbers in this report are based on Mordor Intelligence's proprietary estimation framework, which combines nine months of actuals with Q4 projections for base year 2026.
Market Trends and Insights
Drivers Impact Analysis of Healthcare Contract Manufacturing Organization Market*
| Driver | (~) % Impact on CAGR Forecast | Geographic Relevance | Impact Timeline |
|---|---|---|---|
| Growing inclination of pharma and med-device OEMs toward outsourcing | +2.10% | Global, strongest in North America and Europe | Medium term (2-4 years) |
| Broadening of CDMO service portfolios | +1.80% | Global, Asia Pacific expansion most pronounced | Long term (≥4 years) |
| Surge in biologics and advanced-therapy R&D driving capacity demand | +2.30% | North America and EU core, spill-over to Asia Pacific | Long term (≥4 years) |
| Cost efficiencies in Asia Pacific and Latin-America near- / off-shoring models | +1.40% | Asia Pacific core, Latin America emerging | Medium term (2-4 years) |
| Shortage of viral-vector capacity for gene-therapy pipelines | +0.90% | Global, acute in North America and Europe | Short term (≤2 years) |
| Adoption of digital-twin and continuous-manufacturing outsourcing niches | +0.50% | North America and EU early adopters | Long term (≥4 years) |
| Source: Mordor Intelligence | |||
Growing Inclination of Pharma and Med-Device OEMs Toward Outsourcing
Outsourcing has evolved from a cost-saving tactic into a strategic lever for agility. The healthcare contract manufacturing organization market benefits as sponsors offload capital-intensive operations and concentrate on discovery pipelines, particularly in modalities such as cell and gene therapy that demand highly specialized containment. Heightened M&A activity among CDMOs underscores the sector’s consolidation trend that simultaneously enlarges capability breadth while preserving customer choice. Smaller biotech enterprises, now forming the majority of CDMO clients, lack the infrastructure to build GMP facilities, which amplifies demand for turnkey solutions. High inflation and rising borrowing costs further tilt the build-versus-buy equation toward outsourcing, reinforcing a self-sustaining cycle in which scale enables CDMOs to refresh technologies faster and expand regulatory expertise across jurisdictions.
Broadening of CDMO Service Portfolios
End-to-end support has become a prime differentiator as CDMOs stretch upstream into discovery and downstream into commercial packaging. Integrated offerings minimize interface risk for sponsors who prefer single-supplier accountability across clinical and commercial phases. Investments in viral-vector, cell-therapy, and mRNA platforms illustrate how service diversification aims to capture fast-growing biologic niches. Digital capabilities—from AI-driven process analytics to predictive maintenance—improve yield and transparency, creating sticky customer relationships. Global footprints enable clients to align manufacturing geography with clinical-trial sites and launch markets, a critical factor when time-to-market defines competitive advantage.
Surge In Biologics and Advanced-Therapy R&D Driving Capacity Demand
More than half of new drug candidates in active pipelines require biologics expertise, and a swelling share comprises personalized cell and gene therapies. Viral-vector production is the principal bottleneck, as strict containment and variable batch sizes challenge scalability. Large-scale expansions, such as Samsung Biologics’ plan to exceed 1.3 million liters of capacity by 2032, reflect the race to secure premium contracts in a capacity-constrained environment. CDMOs with early investments in single-use bioreactors and cold chain logistics command higher margins and attract long-term agreements that underwrite additional expansions, fueling a virtuous investment cycle.[3]
Cost Efficiencies in Asia Pacific and Latin-American Near-/Off-Shoring Models
Labor arbitrage, government incentives, and upgraded regulatory oversight position Asia Pacific and Latin America as preferred locations for cost-sensitive manufacturing stages. APIs remain the anchor, yet capabilities are moving up the value chain into biologics and device assembly. Near-shoring to Latin America balances cost with proximity to North American markets, which shortens lead times and cushions supply shocks. Regulatory convergence efforts, particularly in South Korea, Singapore, and Mexico, streamline cross-border approvals, further enhancing attractiveness.
Restraints Impact Analysis of Healthcare Contract Manufacturing Organization Market*
| Restraint | (~) % Impact on CAGR Forecast | Geographic Relevance | Impact Timeline |
|---|---|---|---|
| Stringent, multi-jurisdictional GMP and QMS compliance burden | -1.20% | Global, most complex in EU and North America | Long term (≥4 years) |
| Extended lead times and logistics complexity in global supply chains | -0.80% | Global, acute in cross-border operations | Medium term (2-4 years) |
| Limited global HPAPI containment capacity inflating project costs | -0.60% | Global, focused impact in specialised segments | Medium term (2-4 years) |
| Escalating cyber-security and IP-protection obligations for CMOs | -0.40% | Global, heightened in North America and Europe | Short term (≤2 years) |
| Source: Mordor Intelligence | |||
Stringent, Multi-Jurisdictional GMP and QMS Compliance Burden
Compliance costs can reach USD 322 million annually for larger pharmaceutical manufacturers, a figure that escalates when CDMOs operate multiple sites across North America, Europe, and Asia. Divergent documentation formats, inspection cycles, and product release requirements compel duplicate quality-management systems, raising administrative overheads and delaying batch release.[1] Advanced therapy medicinal products intensify scrutiny because cell viability, sterility, and identity assays must be validated under region-specific frameworks, which strains smaller CDMOs and steers business toward firms with established global quality networks.[2]
Extended Lead Times and Logistics Complexity in Global Supply Chains
API sourcing is highly concentrated: more than 80% of essential medicine inputs originate from India and China. Heightened geopolitical tension, weather-related port closures, and pandemic after-effects produce unpredictable transit times. Cold chain logistics compound risk, as biologic APIs and finished injectables demand 2 °C to 8 °C integrity throughout transit. Serialization mandates such as the DSCSA increase documentation requirements, adding operational steps that lengthen distribution timelines.
*Our forecasts treat driver/restraint impacts as directional, not additive. The impact forecasts reflect baseline growth, mix effects, and variable interactions.
Healthcare Contract Manufacturing Organization Market Segment Analysis
By Services Type:
Pharmaceutical Manufacturing Dominates Advanced-Therapy GrowthPharmaceutical manufacturing generated 68.70% of the healthcare contract manufacturing organization market in 2026 and remains the anchor revenue stream. This dominance originates from established API and finishes dosage outsourcing models in which cost optimization and regulatory assurance drive sponsor demand. Within this vertical, API production represented 65.40% of revenue and continues to benefit from capacity buildouts in the Asia Pacific and North America. Finished dosage formulation grows at 9.85% CAGR as complex oral-solid and parenteral formats increase. High-potency handling and lyophilization capabilities command premium pricing, further lifting segment margin profiles.
Medical-device contract services remain a younger but quickly scaling pillar. OEMs confronted with labor shortages and rising regulatory testing costs outsource assembly and integration to CDMOs that offer Class II and Class III device expertise. Device development and manufacturing accounted for the most significant slice of revenue within this vertical in 2024, driven by implantables, ophthalmic injectables, and connected monitoring tools. Validation services record double-digit expansion because ever-evolving EU MDR and FDA requirements extend testing scopes. Synergy emerges between drug and device outsourcing as combination products, such as pre-filled syringes and auto-injectors, require integrated design-for-manufacturing approaches. CDMOs that straddle both pharmaceutical and device capabilities offer sponsors single-contract efficiency across entire therapeutic platforms.
Geography Analysis
North America Healthcare Contract Manufacturing Organization Market
North America maintained 41.10% of the healthcare contract manufacturing organization market share in 2026. Robust biologics pipelines, tax incentives, and FDA familiarity underpin adherence to domestic production despite higher labour costs. Ongoing capital expenditure reinforces leadership: Novo Nordisk allocated USD 4.1 billion to expand its North Carolina operation, and Fujifilm injected USD 1.2 billion into its Holly Springs facility in 2024. Canada and Mexico leverage trade agreements and cost advantages to capture spill-over demand, especially for solid-dose and device assembly programs.
APAC and Europe Healthcare Contract Manufacturing Organization Market
Asia Pacific posts the quickest regional climb at 10.15% CAGR, moving from low-cost API origins toward sophisticated biologics hubs. Landmark announcements from Samsung Biologics’ intention to surpass 1.3 million litres of biologic capacity and Lotte Biologics’ USD 3.4 billion biocampus plan signal intent to anchor high-value manufacturing locally. Improved GMP harmonisation and skilled talent pools in South Korea, Singapore, and India foster investor confidence. Sponsors use dual-site strategies that couple Asia production with North America or European secondary sites to hedge geopolitical risk.
EMEA and LATAM Healthcare Contract Manufacturing Organization Market
Europe sustains a steady 5.55% CAGR, backed by Germany’s engineering base and Switzerland’s specialization in HPAPI and biologics. Regulatory uncertainty following Brexit initially caused friction, yet UK CDMOs now differentiate via MHRA fast-track approvals targeting ATMPs. Latin America gains relevance as a near-shore alternative: Brazil’s pharmaceutical sector tallied USD 14.7 billion in sales and benefits from pro-manufacturing policies. The Middle East and Africa remain nascent yet promising, driven by Vision 2030 initiatives and continental self-sufficiency targets.
Competitive Landscape
The healthcare contract manufacturing organization market exhibits moderate concentration. Novo Holdings’ USD 16.5 billion takeover of Catalent in 2024 underscored the sector’s strategic value and heightened consolidation momentum. Samsung Biologics targets scale economies by pushing total capacity past 1.3 million litres, while Lonza absorbed Roche’s Vacaville plant for USD 1.2 billion to enlarge its West Coast footprint. These moves reflect a pattern of vertical capability expansion to secure end-to-end mandates.
White-space persists in viral-vector and mRNA production, where entry barriers are set by biosafety and equipment capital. Specialists such as AGC Biologics and Oxford Biomedica capture contracts by pairing early scientific advice with GMP slots, winning sponsor loyalty. Technology differentiation also rises: Thermo Fisher’s Patheon unit deploys continuous-flow reactors, and Catalent invests in predictive-maintenance AI suites that reduce deviation rates. Mid-tier and private-equity-backed firms pursue regional roll-ups, aggregating niche sites into broader platforms to compete for global frameworks, as exemplified by Avid Bioservices’ USD 1.1 billion sale to GHO Capital and Ampersand.
Geographic reach remains a decisive factor. CDMOs add Asia Pacific and Latin-American sites to hedge geopolitical risk and service local trials, while maintaining North American and European facilities for high-value commercial runs. Sponsors reward breadth by allocating portfolios across multiple programmes, driving long-term capacity reservations that stabilise utilisation rates. The competitive dynamic therefore blends scale, specialisation, and technology acuity, with digital readiness increasingly tipping the balance for complex biologic mandates.
Healthcare Contract Manufacturing Organization Industry Leaders
-
Catalent Pharma Solutions
-
Thermo Fisher Scientific
-
Lonza Group
-
WuXi AppTec
-
Samsung Biologics
- *Disclaimer: Major Players sorted in no particular order
Healthcare Contract Manufacturing Organization Market Companies Covered in this Report
- Catalent Pharma Solutions
- Thermo Fisher Scientific (Patheon)
- Lonza Group
- Recipharm
- Boehringer Ingelheim BioXcellence
- Pfizer CentreOne
- WuXi App Tec
- Samsung Group
- FUJIFILM
- AGC Biologics
- Baxter BioPharma Solutions
- Piramal Group
- Jabil Healthcare
- Celestica HealthTech
- Nordson Medical
- Integer Holdings
- Flex
- TE Connectivity Medical
- Eurofins CDMO
- Charles River Laboratories CDMO
Read Analysis of Healthcare Contract Manufacturing Organization Companies
Recent Industry Developments in Healthcare Contract Manufacturing Organization Market
- February 2025: AGC Biologics opened a new Danish facility, doubling its bioreactor volume to reinforce European biologics supply.
- January 2025: Lotte Biologics unveiled a USD 3.4 billion plan to create a biocampus in South Korea that will integrate development, clinical, and commercial-scale manufacturing.
- December 2024: Novo Holdings completed the USD 16.5 billion purchase of Catalent, adding large-scale fill-finish and viral-vector capabilities.
- November 2024: Fujifilm confirmed a USD 1.2 billion capacity expansion in North Carolina, adding 680 jobs.
Healthcare Contract Manufacturing Organization Market Report Scope and Research Methodology
Market Definition and Coverage
Our study defines the healthcare contract manufacturing organization (CMO) market as all fee-based manufacturing, fill-finish, secondary packaging, and related scale-up services supplied by third-party partners for branded or generic pharmaceuticals, biologics, and regulated medical devices. The model captures revenues earned from active pharmaceutical ingredient (API) plants, finished-dosage workshops, and device assembly lines that are run on behalf of external healthcare product owners.
Scope exclusions include pure contract research, standalone clinical CRO fees, logistics BPO, and white-label nutraceutical blending, which are intentionally left outside this value pool.
Segments Covered in This Report
- By Service Type
- Pharmaceutical Contract Manufacturing
- API Manufacturing
- Large Molecules
- Small Molecules
- High-Potency API (HPAPI)
- Biologics & Cell/Gene-Therapy Manufacturing
- Finished Dosage Formulation (FDF)
- Solid Dose
- Liquid Dose
- Injectable Dose
- Secondary & Tertiary Packaging
- API Manufacturing
- Medical-Device Contract Manufacturing
- Device Development & Engineering
- Process Development Services
- Device Manufacturing Services
- Assembly & Integration Services
- Quality-Management & Validation Services
- Pharmaceutical Contract Manufacturing
- By Geography
- North America
- United States
- Canada
- Mexico
- Europe
- Germany
- United Kingdom
- France
- Italy
- Spain
- Rest of Europe
- Asia Pacific
- China
- Japan
- India
- South Korea
- Australia
- Rest of Asia Pacific
- Middle East & Africa
- GCC
- South Africa
- Rest of Middle East & Africa
- South America
- Brazil
- Argentina
- Rest of South America
- North America
Data Sources, Market Sizing, and Validation
Primary Research
Mordor analysts interviewed API plant managers in North America, device OEM supply-chain leads across Europe, and procurement heads at mid-sized biotechs in Asia. These conversations clarified utilization rates, prevailing contract lengths, and expected biologics share shifts, allowing us to validate desk assumptions and fill regional data gaps before triangulating final figures.
Desk Research
We began with publicly available signals such as FDA drug-establishment inspection lists, European Medicines Agency GMP certificates, USTR and UN Comtrade trade codes for HS 29, 30, and 90 products, yearly outsourcing surveys from EFPIA and AdvaMed, and cost indices in OECD Health Statistics. Company 10-K filings, investor decks, and patent families (via Questel) helped us spot capacity additions and technology migrations. Subscription tools like D&B Hoovers and Dow Jones Factiva provided plant-level revenue clues and customer contracts, which were stitched with price trackers published by Polymer Update for sterile syringe barrels and by Asia Metal for stainless reactor inputs. This list is illustrative; many supplementary sources were reviewed for cross-checks and context.
Market-Sizing & Forecasting
A top-down reconstruction that starts with global healthcare production and trade data and then applies outsourcing penetration ratios by product class set the core 2025 baseline. Results were corroborated with selective bottom-up roll-ups of announced clean-room square-footage, sampled ASP × volume for sterile injectables, and capacity utilization checks from channel partners. Key variables feeding the model include: 1) outsourced API tonnage, 2) cumulative fill-finish line capacity additions, 3) biologics share of late-stage pipelines, 4) OEM device outsourcing ratio, and 5) average HPAPI manufacturing cost per gram. A multivariate regression technique links these drivers to revenue growth scenarios, with outlier adjustments guided by expert consensus. Gaps created by missing private-company disclosures are bridged through conservative ratio applications drawn from verified peers.
Data Validation & Update Cycle
Every draft output passes anomaly and variance screens, followed by peer review. Material divergences trigger re-contact of primary sources. Reports refresh once each year, and interim updates are issued when plant closures, mega-mergers, or regulatory shifts materially move underlying variables.
How Mordor Intelligence's Healthcare Contract Manufacturing Organization Market Size Compares to Other Published Estimates
Published estimates often differ because firms choose distinct service mixes, conversion factors, and refresh cadences.
Key gap drivers include whether device assembly revenues are blended with pharma APIs, the aggressiveness of biologics pipeline uptake, currency conversion timing, and the depth of primary interviews that temper purely secondary assumptions.
Benchmark comparison
| Market Size | Anonymized source | Primary gap driver |
|---|---|---|
| USD 255.66 B (2025) | Mordor Intelligence | |
| USD 300.70 B (2025) | Global Consultancy A | Bundles early-stage CDMO R&D billings and technology-transfer fees, inflating topline |
| USD 209.90 B (2025) | Industry Data Service B | Focuses on pharmaceutical APIs and FDF only, omits medical-device contracts and secondary packaging |
These comparisons show that when the right scope, cross-checked drivers, and an annual refresh are combined, Mordor's figures offer decision-makers a balanced and reproducible baseline they can trust.
Key Questions Answered in the Report
What is the current value of the healthcare contract manufacturing organization market?
The market is valued at USD 301.22 billion in 2027 and is forecast to hit USD 453.76 billion by 2032.
Which service segment generates the highest revenue?
Pharmaceutical manufacturing holds 68.70% of revenue, led by API production and finished dosage formulation.
Why is viral-vector capacity so critical?
Gene-therapy pipelines rely on viral vectors, yet global GMP capacity remains scarce, driving premium pricing and project delays.
Which region is growing fastest for CDMO services?
Asia Pacific is expanding at a 10.15% CAGR to 2032, propelled by cost advantages, regulatory upgrades and large-scale biologics investments.
What are the main risks facing CDMOs today?
Multijurisdictional compliance costs, cybersecurity threats, and supply-chain lead-time volatility are the most prominent operational challenges.