
Hardware Firewall Market Size and Share
Market Overview
| Study Period | 2020 - 2031 |
|---|---|
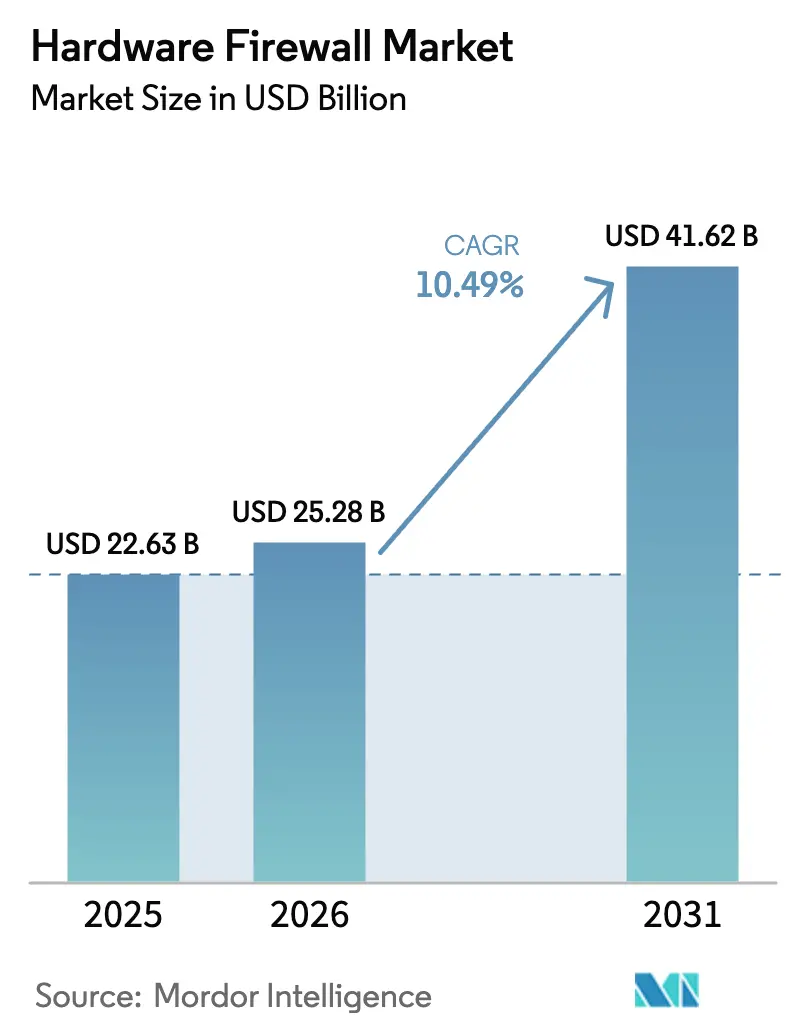
| Market Size (2026) | USD 25.28 Billion |
| Market Size (2031) | USD 41.62 Billion |
| Growth Rate (2026 - 2031) | 10.49% CAGR |
| Fastest Growing Market | Asia Pacific |
| Largest Market | North America |
| Market Concentration | High |
Major Players *Disclaimer: Major Players sorted in no particular order Image © Mordor Intelligence. Reuse requires attribution under CC BY 4.0. | |
Hardware Firewall Market Analysis by Mordor Intelligence
The hardware firewall market size is projected to expand from USD 25.28 billion in 2026 to reach USD 41.62 billion by 2031, registering a 10.49% CAGR over 2026-2031. Pent-up federal demand, 5G-driven edge architectures, and price compression in AI coprocessors are converging to lift unit volumes and average selling prices simultaneously. Large modernization awards already locked in through 2027 provide multi-year revenue visibility, while a steep drop in merchant-silicon lead times is shortening refresh cycles in data-center cores. Vendor backlogs, which peaked in early 2025, have narrowed by roughly eight weeks as reshored fabs come online, enabling faster delivery of terabit-class appliances. Even so, interest in cloud-delivered inspection is siphoning hardware revenue from branch offices with fewer than 50 users, forcing suppliers to tilt portfolios toward high-throughput platforms and recurring-service bundles.
Key Report Takeaways
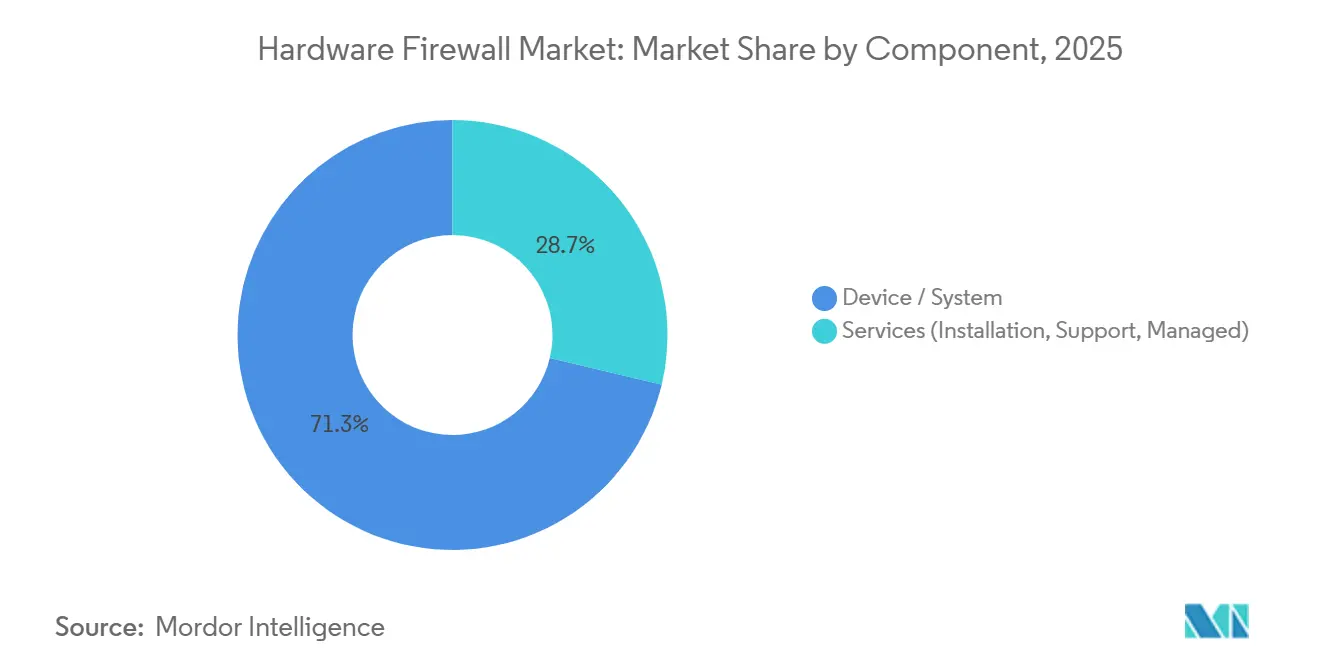
- By component, device and system sales captured 71.29% of 2025 revenue, whereas services are forecast to advance at an 11.40% CAGR to 2031.
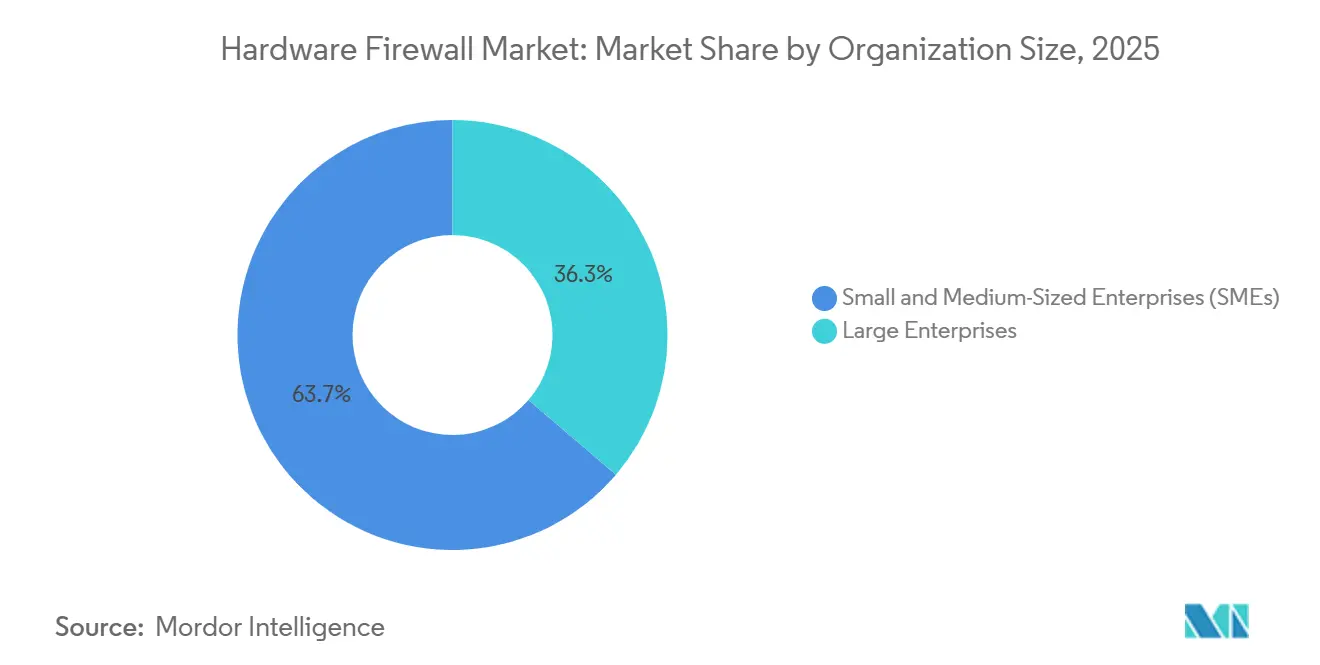
- By organization size, large enterprises held 63.74% of 2025 revenue, but small and medium-sized enterprises are projected to expand at an 11.58% CAGR through 2031.
- By end-user industry, banking, financial services, and insurance led with a 24.52% share in 2025, while healthcare is poised for the fastest growth at a 12.01% CAGR through 2031.
- By firewall type, next-generation firewalls accounted for 58.85% of 2025 shipments, whereas AI-accelerated and terabit-class variants are expected to post an 11.98% CAGR during 2026-2031.
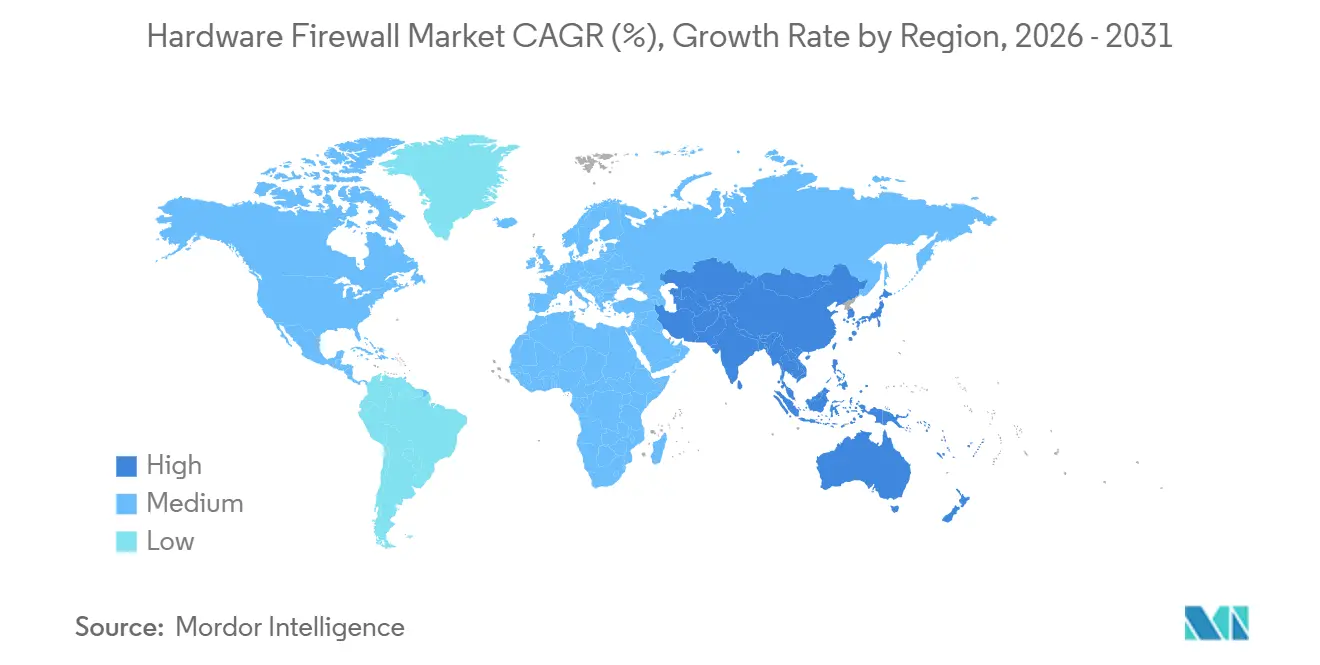
- By geography, North America dominated with 38.39% of 2025 revenue, yet Asia-Pacific is set to deliver the highest regional CAGR at 11.91% through 2031.
Note: Market size and forecast figures in this report are generated using Mordor Intelligence’s proprietary estimation framework, updated with the latest available data and insights as of 2026.
Global Hardware Firewall Market Trends and Insights
Drivers Impact Analysis*
| Driver | (~) % Impact on CAGR Forecast | Geographic Relevance | Impact Timeline |
|---|---|---|---|
| Increasing Sophistication of Multi-Vector Cyber-Attacks Necessitating ASIC-Accelerated Inspection | +2.30% | Global, with acute pressure in North America and Europe | Medium term (2-4 years) |
| Government Zero-Trust Mandates for Federal and Critical-Infrastructure Networks | +2.10% | North America and Europe, emerging in Asia-Pacific | Short term (≤ 2 years) |
| Edge-Computing and 5G Densification Requiring Distributed Micro-Firewall Nodes | +1.90% | Asia-Pacific core, spillover to Middle East and Africa | Medium term (2-4 years) |
| Reshoring Incentives and Tariffs Spurring Domestic Appliance Production | +1.50% | North America and Europe | Long term (≥ 4 years) |
| SD-WAN Replacement of MPLS Driving Hardware NGFW Refresh Cycles | +1.40% | Global, led by North America and Europe | Short term (≤ 2 years) |
| Falling AI-Coprocessor Costs Enabling Mid-Market Terabit-Class Appliances | +1.20% | Global, with faster adoption in Asia-Pacific | Medium term (2-4 years) |
| Source: Mordor Intelligence | |||


Increasing Sophistication of Multi-Vector Cyber-Attacks Necessitating ASIC-Accelerated Inspection
Multi-vector incursions blending ransomware, distributed-denial-of-service, and supply-chain compromise climbed to 68% of reported enterprise breaches in the first half of 2025. Signature-based engines running on x86 processors are unable to correlate indicators across network, application, and endpoint streams at line rate, so attackers often fragment payloads across protocols to evade detection. Dedicated inspection silicon now offloads pattern matching and behavioral analytics, enabling 40 million packet inspections per second without breaching agreed service levels. A January 2025 NIST guideline formalized hardware-rooted attestation for federal zero-trust deployments, codifying ASIC requirements for public-sector procurements. Vendors with in-house chip design therefore enjoy an 18-month lead over peers that depend on merchant silicon.[1]National Institute of Standards and Technology, “Special Publication 800-207A,” nist.gov
Government Zero-Trust Mandates for Federal and Critical-Infrastructure Networks
Executive Order 14028, together with the Office of Management and Budget’s M-22-09 memo, obliges U.S. civilian agencies to attain zero-trust maturity by fiscal 2027. The directive bans location-based trust and compels per-session cryptographic validation, a capability that software firewalls struggle to deliver under high throughput. Pipeline operators, railway carriers, and European critical-infrastructure entities face similar timelines under TSA and NIS2 rules. Because 63% of fiscal-2026 U.S. federal cybersecurity budgets must be spent by second-quarter 2027, agencies are front-loading hardware procurements and favoring vendors already cleared under FedRAMP High.[2]Office of Management and Budget, “Memorandum M-22-09,” whitehouse.gov
Edge Computing and 5G Densification Requiring Distributed Micro-Firewall Nodes
More than 312 standalone 5G networks were live by December 2025, repositioning compute resources within 10 milliseconds of users. Each remote radio head or industrial gateway now needs a dedicated micro-firewall to isolate operational-technology (OT) data from IT backbones. IEC 62443 revisions adopted in March 2025 oblige hardware-enforced segmentation for OT traffic, effectively excluding pure software solutions from factory and utility environments.[3]International Electrotechnical Commission, “IEC 62443-4-2:2025,” iec.ch Carriers such as Verizon plan 18,000 edge sites by 2028, pushing appliance volumes into low-price fanless form factors rated for extreme temperatures.
Reshoring Incentives and Tariffs Spurring Domestic Appliance Production
The U.S. CHIPS and Science Act dedicates USD 52.7 billion to local semiconductor fabrication, reducing ASIC lead times from 18 months to roughly nine once Arizona and Ohio mega-fabs become fully operational. Expanded Section 301 tariffs have also added a 25% duty on firewall appliances assembled with Chinese components, narrowing the landed-cost gap between offshore and domestic production. European subsidies under the EUR 43 billion (USD 48.4 billion) Chips Act echo these dynamic, nudging vendors to re-engineer supply chains around continental fabs.[4]European Commission, “Chips Act Press Release,” ec.europa.eu Although domestic labour expenses inflate bill-of-materials, the risk mitigation from geopolitical diversification offsets the added cost for buyers in heavily regulated sectors.
Restraints Impact Analysis*
| Restraint | (~) % Impact on CAGR Forecast | Geographic Relevance | Impact Timeline |
|---|---|---|---|
| Rapid Shift to Firewall-as-a-Service Cannibalising On-Prem Hardware Demand | -1.80% | Global, most pronounced in North America and Europe | Short term (≤ 2 years) |
| Supply-Chain Volatility for Network-Processing Chips | -1.30% | Global, acute in Asia-Pacific manufacturing hubs | Medium term (2-4 years) |
| Privacy-Driven Limits on Encrypted-Traffic Inspection | -0.90% | Europe and North America | Long term (≥ 4 years) |
| Rising Energy Costs of High-Throughput Appliances | -0.70% | Europe and Middle East | Medium term (2-4 years) |
| Source: Mordor Intelligence | |||
Rapid Shift to Firewall-as-a-Service Cannibalizing On-Prem Hardware Demand
Cloud-delivered inspection captured 22% of new enterprise security spend in 2025, up eight points year over year. Small offices with fewer than 50 users find per-seat pricing near USD 8 per month materially cheaper than a three-year ownership cycle for a USD 2,000 appliance. Palo Alto Networks reported that 41% of its new customers in fiscal-2025 chose cloud inspection, and hardware unit shipments in the sub-USD 5,000 tier are now falling at roughly 8% annually. The cannibalization is asymmetric, though: data-center cores and latency-sensitive OT sites still mandate on-prem appliances. Bundled cloud management with multi-year hardware leases has therefore emerged as a hedge strategy for incumbent vendors.
Supply-Chain Volatility for Network-Processing Chips
Advanced-node network-processing units rely almost exclusively on Taiwan Semiconductor Manufacturing Company and Samsung Foundry. During the 2024 Taiwan Strait crisis, ASIC lead times ballooned from 26 to 44 weeks, delaying Juniper’s shipment of 14,000 appliances and deferring USD 187 million in revenue. Export-control tightening by the U.S. Bureau of Industry and Security, effective October 2024, restricts shipments of AI-accelerated silicon to 47 countries, forcing vendors to maintain dual product lines at a 15-20% cost premium while alternate fabs are qualified. Dual-sourcing agreements announced in 2025 will ease constraints but require 18-24 months of validation before volume ramp.
*Our forecasts treat driver/restraint impacts as directional, not additive. The impact forecasts reflect baseline growth, mix effects, and variable interactions.
Segment Analysis
By Component: Services Expand as Skill Gaps Widen
The hardware firewall market size for the device and system segment reached USD 16.13 billion in 2025, equating to 71.29% of total revenue. Despite dominance in absolute dollars, hardware growth is moderating as refresh budgets shift toward services that wrap installation, policy tuning, and 24/7 monitoring. Professional-service attach rates topped 70% among small and medium-sized enterprises, where internal cyber teams are scarce and firmware patches averaged 14 critical updates per appliance in 2025. Enterprise buyers increasingly treat complex multi-cloud rollouts as turnkey projects, awarding three-year managed-service agreements bundled with hardware rentals.
By contrast, the service segment’s 11.40% CAGR reflects rising compliance complexity and a 3.4-million-person global cybersecurity talent shortfall. Health-care networks installing firewalls to meet HIPAA encryption mandates frequently spend USD 120,000 on professional services for every USD 80,000 box deployed, illustrating how advisory, integration, and incident-response fees can eclipse physical gear. Over the forecast horizon, recurring service revenue is positioned to equalize with device revenue in North America and Western Europe, creating a strategic pivot point for suppliers whose gross margins still depend on chassis shipments.

By Firewall Type: AI Acceleration Redraws the Performance Curve
Next-generation platforms held a 58.85% hardware firewall market share in shipments during 2025, yet AI-accelerated and terabit-class models are on track for an 11.98% CAGR. The hardware firewall market size for AI-optimized variants is projected to climb from roughly USD 3.5 billion in 2026 to more than USD 6.1 billion by 2031. Telecom carriers and hyperscale’s are first adopters because encrypted traffic already exceeds 95% of their payloads, crippling throughput on CPU-bound engines. Fortinet’s FortiGate 4800F, launched in March 2025, illustrated the step-change by moving 1.2 terabits per second of inspected traffic while keeping latency under two microseconds.
Lower-cost AI coprocessors are compressing price premiums, trimming the delta between terabit-class and traditional NGFW appliances by about 18% each year. Stateless packet-filtering boxes survive only in low-budget OT gateways and small offices, while unified-threat-management (UTM) devices are losing share as customers decouple endpoint, email, and web filters from network inspection. Application-level proxies and circuit gateways persist in niche, high-assurance environments such as trading floors and air-gapped defense enclaves where regulatory norms trump raw throughput.
By Organization Size: Appliances Trickling Down the Market Pyramid
Large enterprises generated 63.74% of 2025 revenue, but growth momentum now resides in the small and medium-sized enterprise tier, advancing at an 11.58% CAGR. Mandatory next-generation firewalls are now a de-facto requirement in cyber insurance underwriting, propelling adoption among firms with 50-250 employees. Simple web-based consoles, zero-touch provisioning, and subscription payments are dismantling earlier budget barriers.
Large-scale buyers remain crucial to volume economics because multi-site rollouts can exceed 5,000 boxes and dictate vendor standardization to minimize policy sprawl. Cisco reported that 68% of enterprises with more than 5,000 staff run firewalls from no more than two suppliers, whereas smaller firms churn vendors at nearly double the rate, chasing better support or lower license fees. Managed-service providers have captured 54% of hardware procurement among organizations with fewer than 500 employees, accelerating replacement windows from six years toward three to four.
By End-User Industry: Healthcare Outpaces BFSI Amid Ransomware Pressure
Banking, financial services, and insurance held a 24.52% revenue share in 2025, buoyed by stringent payment-card and privacy mandates. Yet hospitals and clinics represent the fastest-growing opportunity, expanding at a 12.01% CAGR thanks to a surge in double-extortion ransomware that cost the sector USD 9.23 billion in 2024 recovery spending. Recent HIPAA security updates now compel hardware-enforced encryption for all patient data in transit, a specification unfulfilled by cloud firewalls that cannot guarantee data residency.
Manufacturing’s 18% slice of 2025 shipments reflects Industry 4.0 initiatives linking programmable-logic controllers to enterprise networks, which prompts IEC-62443 certified firewall installs. Government and defense budgets remain resilient under zero-trust mandates, while retail, education, and telecom segments pivot toward form-factor diversity, maritime-hardened boxes, rack-scale blades, or DIN-rail units, depending on threat surface and environmental constraints.
Geography Analysis
North America contributed 38.39% of global revenue in 2025, underpinned by Executive Order 14028 procurements and pipeline-security directives. The United States alone represented nearly three-quarters of regional demand and benefits from reshored silicon fabrication that shortens lead times for cryptographic modules. Canadian carriers are likewise refreshing edge sites under the Critical Cyber Systems Protection Act, while Mexican assembly hubs in Guadalajara and Monterrey supply tariff-free units to Latin America.
Europe accounted for 26% of worldwide sales, with the NIS2 Directive catalysing a compliance-driven refresh cycle. Germany led European spend at 31% of the regional total, leaning on IT-Grundschutz guidelines that favour hardware segmentation for industrial OT backbones. The United Kingdom’s National Cyber Security Centre guidance issued in 2025 specifically recommends hardware firewalls for entities handling more than 10,000 customer records, widening the addressable market to roughly 87% of U.K. businesses.
Asia-Pacific is the fastest-growing theater, projected at an 11.91% CAGR through 2031. China’s dual-circulation plan funds indigenous firewall silicon, while India’s USD 4.2 billion Digital India program extends secure broadband to 600,000 villages. Japan and South Korea remain high-value markets for terabit-class platforms serving dense 5G cores. The Middle East earmarked USD 3.7 billion for cybersecurity in 2025, headlined by Saudi Arabia’s NEOM smart-city buildout, whereas Africa lags at 3% of global revenue but shows pockets of growth tied to South Africa’s Critical Infrastructure Protection Act.

Regulatory Landscape
Hardware firewall procurement in regulated environments is being shaped by cryptographic and product-security conformity requirements. In the United States, NISTs Cryptographic Module Validation Program is transitioning from FIPS 140-2 to FIPS 140-3, with FIPS 140-2 retired on September 21, 2026. This change pushes vendors and buyers to refresh validated modules used for encryption, key storage, and secure boot chains, reinforcing hardware-rooted controls highlighted in federal guidance such as NIST Special Publication 800-207A for zero-trust deployments, where hardware attestation and high-throughput cryptographic validation are tied to eligibility and risk acceptance in public-sector and critical-infrastructure networks.
In Europe, standards work aligned to the EU Cyber Resilience Act is adding more explicit expectations for firewall and intrusion-detection security properties. ETSI issued a final draft of EN 304 636 on July 9, 2026, specifying cybersecurity requirements for firewalls and intrusion detection systems. Alongside security assurance, supply-chain risk management is increasingly embedded in buyer requirements, with large vendors referencing formal cyber supply-chain risk management programs and participating in industry-government initiatives, which tightens documentation, component traceability, and lifecycle patching expectations for hardware appliances sold into government, telecom, and critical-infrastructure segments.
Competitive Landscape
The hardware firewall market features moderate concentration, with the top five vendors shipping 52% of units in 2025. Market leaders are tightening performance moats by vertically integrating ASIC design, threat-intelligence clouds, and policy orchestration suites, raising switching barriers for enterprise buyers. Fortinet, for instance, secured a three-year exclusive on 5-nanometer inspection silicon capable of 1.2 terabits per second, a throughput unattainable by rivals dependent on merchant chips.
Patent data underscores widening intellectual-property gaps: of 147 U.S. patents issued for AI-driven threat correlation in 2025, three suppliers captured 68%, signalling a tightening chokepoint around machine-learning inspection pipelines. Nonetheless, specialized verticals edge OT gateways, satellite ground stations, and ruggedized substations remain fragmented. Only two vendors currently offer radiation-hardened firewalls suited for low-earth-orbit constellations, reflecting sizeable white-space potential.
Firewall-as-a-service shifts introduce structural headwinds, especially in the branch-office micro-segment that dropped from 18% of unit shipments in 2024 to an expected 12% by 2031. Pure-play cloud providers are capturing this slice, while hardware incumbents defend datacenter and campus-core turf by embedding lifetime cloud-management licenses into chassis SKUs. Disrupters using open-source firmware on commodity x86 boards hold 9% of small-office deployments by undercutting list prices yet lack the support certifications demanded by regulated industries.
Hardware Firewall Industry Leaders
Cisco Systems, Inc.
Cujo LLC
Fortinet Inc.
Palo Alto Networks Inc.
Bitdefender SRL
- *Disclaimer: Major Players sorted in no particular order


Market Opportunities and Future Outlook
Compliance-driven refresh and certification transitions create whitespace for vendors that can combine high-throughput inspection with validated cryptography and auditable supply chains. The September 2026 retirement of FIPS 140-2 in favor of FIPS 140-3 increases urgency for updates to cryptographic modules embedded in hardware firewalls sold into U.S. federal, defense-adjacent, and regulated enterprise environments. European work such as ETSI EN 304 636 (final draft released July 2026) adds further product-security requirements, which can favor appliances with hardened management planes, secure update mechanisms, and documented vulnerability handling.
On the technology and supply side, performance-per-watt and silicon availability are becoming clearer differentiators as encrypted traffic and AI-era workloads stress CPU-bound designs. Fortinet and Intel announced a strategic collaboration in July 2026 to develop the Fortinet Security Processor 6 (SP6) using Intels 18A manufacturing process, highlighting vendor moves toward tighter silicon-roadmap control to protect throughput density and lead times. Cisco has also emphasized owning critical silicon and optics designs and signing long-term agreements for silicon and memory through the end of 2026. Together, these moves point to an opportunity for hardware firewall suppliers to pair appliance refresh cycles with longer-term supply assurances, multi-year lifecycle support, and managed-service attach, particularly for data-center cores, 5G edge nodes, and OT sites where on-prem enforcement remains a deployment constraint.
Recent Industry Developments
- June 2026: Cujo LLC demonstrated a containerized application for RDK-B customer premises equipment at the RDK Tech Summit in Dusseldorf. The display highlights software defined edge capabilities for operator deployments. The development expands Cujo's footprint in modular edge solutions for service providers.
- May 2026: Fortinet - Announced the FortiGate 3500G and 400G appliances, designed for AI-driven workloads and enterprise edge security using NP7 and SP5 processors. The announcement targets higher throughput density for AI integration in data centers and large campuses. It strengthens Fortinet's position in high end edge security portfolios.
- March 2026: Cujo LLC - Introduced network level scam detection capabilities for network service providers to address crypto investment scams. The upgrade enhances provider threat intelligence and enforcement across managed networks. The capability broadens Cujo's reach in security orchestration for network operators.


Research Methodology Framework and Report Scope
Market Definition and Coverage
This market covers revenues generated from dedicated hardware appliances used to inspect, filter, and control network traffic at the perimeter, data center, branch, and industrial edge, including associated deployment and support services when tied to the appliance.
Scope exclusions: Pure cloud-only firewall delivery, standalone software firewalls, and broader security tools (such as secure web gateways or endpoint protection) are excluded unless they are bundled and priced as part of a hardware firewall offering.
Segmentation Overview
- By Component
- Device / System
- Services (Installation, Support, Managed)
- By Organization Size
- Small and Medium-Sized Enterprises (SMEs)
- Large Enterprises
- By End-User Industry
- BFSI
- Healthcare
- Manufacturing
- Government and Defense
- IT and Telecom
- Retail and E-Commerce
- Education
- By Firewall Type
- Packet-Filtering Firewalls
- Circuit-Level Gateways
- Application-Level / Proxy Firewalls
- Unified Threat Management (UTM)
- Next-Generation Firewalls (NGFW)
- AI-Accelerated / Terabit-Class Firewalls
- By Geography
- North America
- United States
- Canada
- Mexico
- South America
- Brazil
- Argentina
- Rest of South America
- Europe
- United Kingdom
- Germany
- France
- Italy
- Spain
- Netherlands
- Rest of Europe
- Asia-Pacific
- China
- Japan
- South Korea
- India
- ASEAN
- Rest of Asia-Pacific
- Middle East
- Saudi Arabia
- United Arab Emirates
- Turkey
- Rest of Middle East
- Africa
- South Africa
- Nigeria
- Kenya
- Rest of Africa
- North America
Data Sources, Market Sizing, and Validation
Desk Research
Desk work starts with building the demand context and the buyer environment for hardware security appliances. For this, we relied on public, non-paywalled sources such as NIST publications, CISA advisories, FCC broadband data, and ITU connectivity indicators, which help explain where network expansion and security enforcement are rising together. We also used sources such as U.S. SEC filings, investor presentations, and earnings call transcripts to understand how vendors describe appliance refresh cycles, subscription attachment, and channel motion.
To reduce guesswork on the supply side, we cross-checked import and export shipment data, public customs classifications, and press releases on new appliance launches, which help anchor timing and pricing direction. Patent databases were also reviewed to understand where throughput, encryption acceleration, and inspection features are progressing, since these changes can shift average selling prices over time. Where needed, our internal paid subscriptions were used for company financials and intelligence, contract and tender tracking, and shipment-level trade visibility to validate what was visible in public sources. The sources named above are illustrative rather than exhaustive, and many additional references were used to collect data points, validate assumptions, and clarify open questions.
Primary Interviews and Surveys
Primary work included expert interviews and structured surveys with OEM channel partners, managed security providers, large enterprise security teams, and system integrators who deploy firewalls across data center and branch sites. These conversations helped confirm refresh timing, typical deal structure (hardware plus support), and realistic adoption pace for higher throughput models across major regions, and then were used to tighten assumptions that desk sources could not fully explain.
Distribution of primary research fieldwork respondents
| Company type | Respondent position | Region |
|---|---|---|
| Top tier: 29% | CXOs: 15% | APAC: 45% |
| Mid tier: 55% | Functional/Unit leaders: 41% | EMEA: 30% |
| Smaller Players: 16% | Managers: 44% | Americas: 25% |
Market-Sizing & Forecasting
Sizing is built mainly through a top-down approach where network expansion and security enforcement indicators are used to reconstruct the spending pool for hardware firewalls by region and buyer group, and then it is split using observed deployment patterns. To keep the math grounded, the model tracks practical inputs such as enterprise site counts and branch density, data center build activity, appliance refresh cycles, average throughput needs, and support and service attachment rates that commonly come with hardware deployments.
Those totals are then corroborated using selective bottom-up approximations, including sampled ASP x unit volumes from channel checks, a roll-up of disclosed product revenue where it is clearly attributable, and sanity checks against shipment and trade signals. When bottom-up visibility is incomplete (for example, mixed revenue reporting or bundled contracts), gaps are handled using conservative allocation rules that are validated through interviews and then stress-tested across regions. Forecasting uses scenario analysis, since security budgets, refresh timing, and macro IT spending can shift quickly, and each scenario is tied to a small set of variables that respondents could confidently comment on.
Data Validation & Update Cycle
Validation is done through cross-checks that compare the model output against independent signals, such as shipment direction, public procurement activity, and vendor commentary on backlog and lead times. Variance checks are run by geography and customer type so that outliers become visible early, and then assumptions are reviewed in more than one analyst pass before sign-off. If a mismatch remains material, we re-contact relevant respondents to confirm whether the issue is caused by scope, timing, or a pricing shift.
Reports are refreshed annually, and interim updates are made when major events change demand, supply, or pricing. Before delivery, an analyst completes a fresh review so clients receive the latest updated view.
Mordor Intelligence's Hardware Firewall Market Size Compared Against Other Published Estimates
Published market numbers for hardware firewalls can differ a lot, even when similar labels are used, because the line between appliance revenue and adjacent security spend is not treated the same way. Differences also show up from the year selected as the base, the currency conversion timing used, and whether services that are tied to the appliance are counted inside the same total.
By checking refresh-cycle timing, channel-led ASP movement, and service attachment rates, Mordor Intelligence keeps the hardware firewall total focused on appliance-driven revenue instead of blending it with cloud-only security delivery that does not require an on-prem device. Another gap driver is forecasting posture, where some publishers assume a faster shift to high-throughput platforms across most buyer groups, while others understate replacement demand by using older installed-base assumptions.
Benchmark comparison
| Source | Market Size | Gaps in Research Methodology |
|---|---|---|
| Mordor Intelligence | USD 25.28 B (2026) | |
| Global Consultancy A | USD 27.90 B (2026) | Uses a wider scope that folds adjacent perimeter tools into appliance totals, and applies a steeper ASP uplift for high-throughput models across all regions. |
| Industry Association B | USD 22.40 B (2026) | Uses a narrower definition centered on hardware shipment value and excludes a portion of support and services that are commonly sold alongside the appliance, which reduces the final value. |
The spread in the table mainly comes from what is counted around the appliance and how quickly pricing and refresh cycles are assumed to change. Our steps stay tied to observable demand signals and repeatable checks, which makes it easier for readers to adjust inputs without breaking the model logic.


Key Questions Answered in the Report
What is the projected revenue for the hardware firewall market in 2031?
The market is forecast to reach USD 41.62 billion by 2031, up from USD 25.28 billion in 2026.
How fast is the market growing between 2026 and 2031?
It is expected to post a 10.49% CAGR over the forecast period.
Which component segment is expanding the quickest?
Services, covering installation and managed security, are set to grow at an 11.40% CAGR through 2031.
Why are AI-accelerated firewalls gaining traction?
They sustain line-rate inspection of encrypted traffic and are seeing an 11.98% CAGR as 5G and hyperscale data volumes soar.
Which region is anticipated to record the highest growth?
Asia-Pacific is projected for the fastest regional CAGR at 11.91% to 2031, led by China and India.
What factor could restrain hardware shipments in the near term?
Rapid adoption of firewall-as-a-service is expected to trim on-prem appliance demand by diverting small-office buyers to cloud models.
Page last updated on:






