
Hardcopy Peripherals And Printing Consumables Market Size and Share
Market Overview
| Study Period | 2020 - 2031 |
|---|---|
| Market Size (2026) | USD 141.14 Billion |
| Market Size (2031) | USD 176.28 Billion |
| Growth Rate (2026 - 2031) | 4.55 % |
| Fastest Growing Market | Asia Pacific |
| Largest Market | North America |
| Market Concentration | Medium |
Major Players *Disclaimer: Major Players sorted in no particular order Image © Mordor Intelligence. Reuse requires attribution under CC BY 4.0. | |
Hardcopy Peripherals And Printing Consumables Market Analysis by Mordor Intelligence
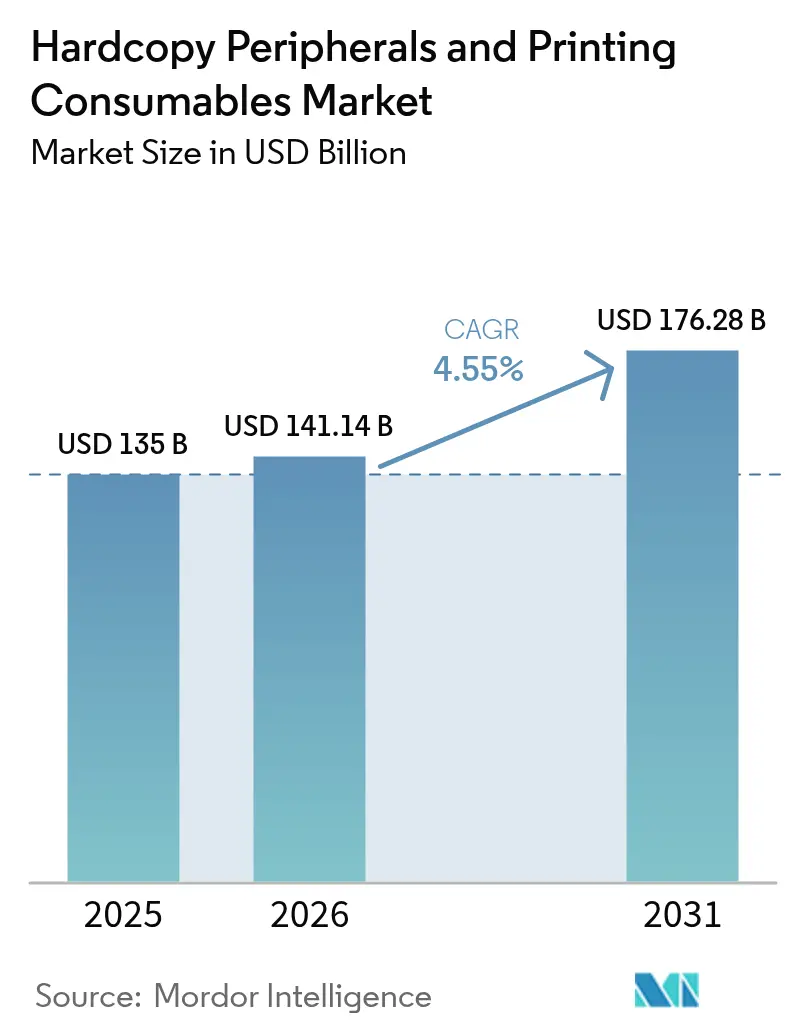
The Hardcopy peripherals and printing consumables market size is expected to grow from USD 135 billion in 2025 to USD 141.14 billion in 2026 and is forecast to reach USD 176.28 billion by 2031 at 4.55% CAGR over 2026-2031. Expansion persists despite paper-reduction mandates because hybrid work, e-commerce packaging, and subscription Print-as-a-Service (PraaS) deals sustain device and supplies demand. Managed print services (MPS) adoption lets enterprises cut 20-30% of fleet cost while shifting spend from capex to opex.[1] Energy-efficient fusing units and refillable ink tanks help vendors defend price premiums as ESG reporting expands. Semiconductor shortages still disrupt hardware availability, yet print suppliers buffer risk by redesigning boards for easier component sourcing.
Key Report Takeaways
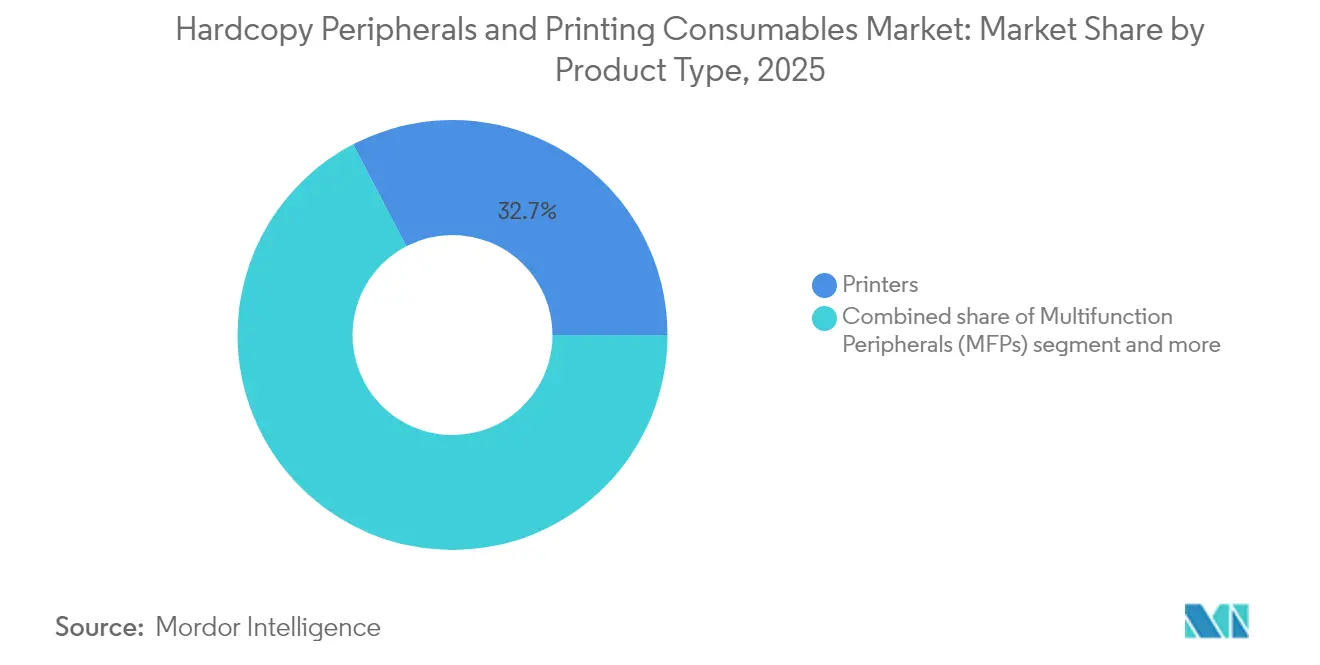
- By product type, printers held 32.65% of 2025 revenue, whereas wide-format/production printers are forecast to post a 4.95% CAGR through 2031.
- By technology, inkjet commanded 44.60% of the Hardcopy peripherals & printing consumables market share in 2025, while laser printing is slated to grow 5.85% CAGR to 2031.
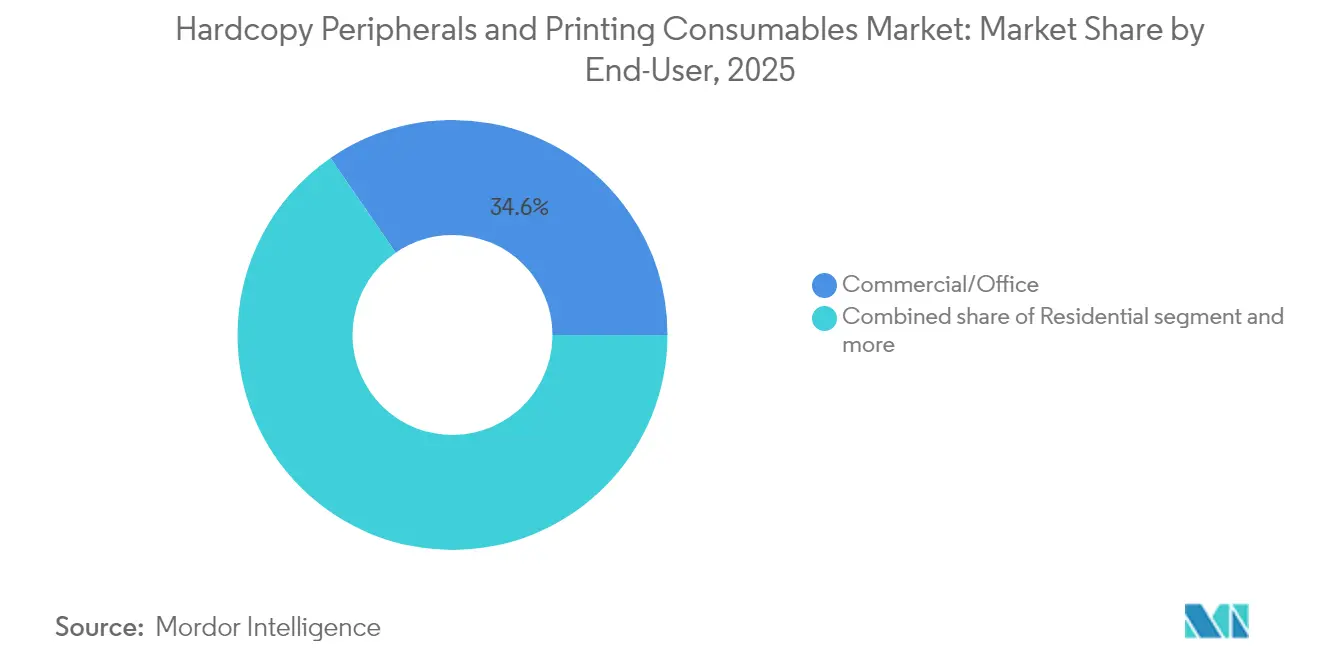
- By end-user, commercial/office accounted for 34.60% of the Hardcopy peripherals & printing consumables market size in 2025; educational institutions show the fastest 4.75% CAGR outlook.
- By distribution, direct/contractual channels secured 46.10% revenue in 2025; MPS leads growth at a 5.15% CAGR.
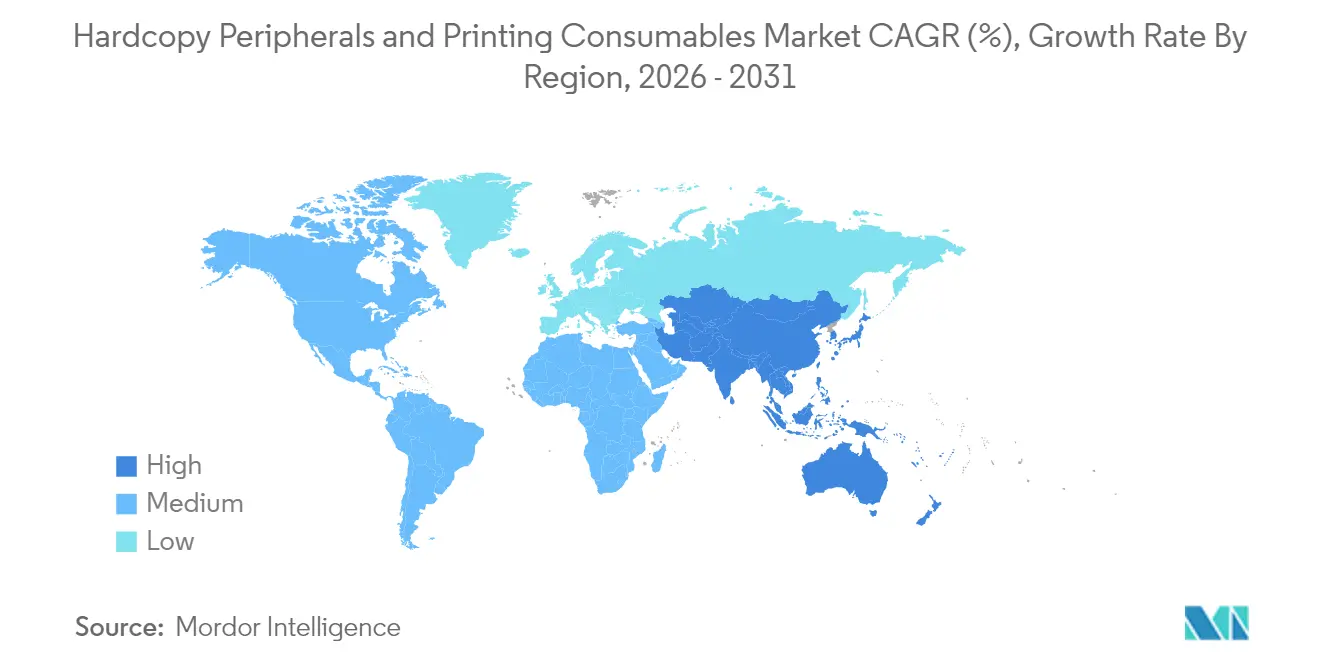
- Geographically, North America dominated with a 36.70% share in 2025, whereas Asia-Pacific is projected to expand 5.80% CAGR to 2031.
Note: Market size and forecast figures in this report are generated using Mordor Intelligence’s proprietary estimation framework, updated with the latest available data and insights as of 2026.
Market Trends and Insights
Drivers Impact Analysis of Hardcopy Peripherals And Printing Consumables Market*
| Driver | (~) % Impact on CAGR Forecast | Geographic Relevance | Impact Timeline |
|---|---|---|---|
| Growth in production digital-printing colour volume | +1.2% | North America and Western Europe | Medium term (2-4 years) |
| Decorative/tactile print enhancements | +0.8% | North America, Europe, high-income APAC | Medium term (2-4 years) |
| SME switch to low-CPP ink-tank printers | +0.9% | Global with APAC focus | Short term (≤ 2 years) |
| E-commerce packaging and in-house label printing | +1.0% | Global with NA and EU hubs | Medium term (2-4 years) |
| Hybrid-work fleets of distributed A4 MFPs | +0.7% | Developed markets | Short term (≤ 2 years) |
| Subscription Print-as-a-Service adoption | +0.6% | NA, Europe, advanced APAC | Medium term (2-4 years) |
| Source: Mordor Intelligence | |||
Growth in Production Digital-Printing Colour Volume
Digital presses now account for only 3.8% of printed pages but capture 25% of print value as brands pay premiums for short-run customisation.[2] Canon’s Colorado series trimmed turnaround time by 60%, letting PSPs deliver 22,000 transit-stop signs in 3 months instead of 12 months. When workflow automation improves by 10 points, output efficiency rises nearly 15%, strengthening ROI on colour devices. This shift channels high-margin inks and coatings into the Hardcopy peripherals and printing consumables market, widening the supply's profit pool.
Demand for Decorative / Tactile Print Enhancements
Retail packs with spot-varnish, raised-foil, or texture earn 30-50% higher unit price than standard CMYK labels, enabling PSPs to offset flat run lengths. Inline embellishment modules bolt onto many digital presses, removing extra passes and labour. Luxury and personal-care firms in Europe are the early adopters, yet mid-tier brands in North America are now piloting quarterly limited-edition launches that require smaller runs but more complex finishes. This behaviour pushes niche varnishes, foils, and compatible substrates, bolstering the Hardcopy peripherals and printing consumables market.
SME Shift to Low-CPP Ink-Tank Devices
Ink-tank hardware slashes operating expense by up to 90% compared with cartridges, a decisive factor for budget-sensitive SMEs. Epson recorded 7.8% unit growth in high-capacity tank printers during 2024 despite a fall in cartridge demand. In India and Southeast Asia, ink-tank penetration already surpasses 50% of annual A4 sales. Vendors accept lower hardware margin, then monetise refill-bottle sales and three-year service contracts. Shifted revenue timing but stabilised lifetime value keeps the Hardcopy peripherals and printing consumables market resilient.
E-Commerce Packaging and In-House Label Printing
Online retail volumes have grown 40% since 2019, prompting merchants to print labels and branded cartons internally for just-in-time dispatch. Variable-data presses handle address data and versioned artwork in one pass, reducing external lead times. Small coffee roasters and cosmetic start-ups now deploy benchtop colour label printers costing under USD 5,000, expanding the addressable installed base for supply vendors. Premium matte and recyclable laminates attach higher margins, supporting the Hardcopy peripherals and printing consumables market even when page counts plateau.
Restraints Impact Analysis of Hardcopy Peripherals And Printing Consumables Market*
| Restraint | (~) % Impact on CAGR Forecast | Geographic Relevance | Impact Timeline |
|---|---|---|---|
| Corporate ESG paper-reduction mandates | -0.6% | NA, EU, developed APAC | Medium term (2-4 years) |
| Semiconductor supply-chain volatility | -0.5% | Global | Short term (≤2 years) |
| Decline of legacy print manufacturing | -0.7% | Developed markets | Long term (≥4 years) |
| IP enforcement on third-party supplies | -0.3% | Global | Medium term (2-4 years) |
| Source: Mordor Intelligence | |||
Corporate ESG Paper-Reduction Mandates
Businesses pledge net-zero targets that restrict paper use, cutting fleet page volumes year over year. Seventy-eight percent of enterprises still call print essential in 2024, yet projections show that ratio sliding to 64% by 2025. Manufacturers counter with low-energy fusers and closed-loop cartridge return schemes such as HP Planet Partners, which recycled 398 million cartridges by 2024. Even with greener consumables, absolute sheet reduction trims growth, curbing the Hardcopy peripherals and printing consumables market by an estimated 0.6 percentage point.
Semiconductor Supply-Chain Volatility
Laser diodes, power-management ICs, and MEMS sensors remain under allocation, extending printer lead times beyond 12 weeks on some SKUs. HP redesigned controller boards to accept alternative drivers, yet the BOM cost rose. Canon adopted dual-sourcing for image sensors to stabilise its roadmap. Component tightness depresses near-term shipments, restraining the Hardcopy peripherals and printing consumables market even while service revenue climbs.
*Our forecasts treat driver/restraint impacts as directional, not additive. The impact forecasts reflect baseline growth, mix effects, and variable interactions.
Hardcopy Peripherals And Printing Consumables Market Segment Analysis
By Product Type:
Wide-Format Drives Premium GrowthPrinters provided 32.65% of 2025 revenue. Wide-format and production presses are projected to outpace the overall Hardcopy peripherals and printing consumables market at 4.95% CAGR, energised by retail banners, vehicle wraps, and corrugated displays. The segment’s contribution to the Hardcopy peripherals & printing consumables market size is poised to climb because UV-LED ink enables sustainable substrates and instant cure. Automation - cutting, and stacking - lets 59% of PSPs quote next-day delivery, a service premium feeding consumables demand.
A4-MFP refresh cycles accelerate under hybrid work. Compact models add card-reader security and cloud connectors, encouraging distributed print architecture. Copiers still serve high-volume campus hubs; 3D printers remain experimental but are now present in 18% of secondary schools across North America. All together, the category maintains steady baseline sheets, ensuring hardware-plus-supplies loops that define the Hardcopy peripherals and printing consumables market.

By Technology:
Laser Advances Through Efficiency GainsInkjet technology occupied 44.60% of revenue in 2025. Laser is advancing faster at 5.85% CAGR as lower-melting-point toners cut energy by 25% per print job. Educational districts favour lasers for rugged duty cycles and near-instant duplexing. Meanwhile, refillable ink tanks solidify the inkjet foothold in SOHO. Solid-ink engines serve graphics-rich uses, whereas thermal heads dominate logistics labelling with 15-year archive life.
Advanced controllers embed AI that predicts part wear, reducing downtime by up to 30%. Predictive analytics create new service SKUs and lock-in for branded consumables, increasing recurring sales inside the Hardcopy peripherals and printing consumables market.
By End-User:
Educational Institutions Embrace Digital TransformationCommercial/office environments represented a 34.60% share in 2025. Financial and healthcare organisations sustain physical forms for compliance, but migrate to MPS portals that enforce pull-print security. Educational institutions show the highest 4.75% CAGR as hybrid classrooms require on-demand colour course packs and 3D printed lab aids. Government departments keep a steady demand, replacing fleets every five years to satisfy data confidentiality standards.
Residential users pivoted to Wi-Fi ink tanks during lockdowns and keep those devices for home-based micro-businesses. Specialty verticals such as retail pharmacy and quick-service restaurants deploy thermal labelers to speed checkout. Each workflow layer adds niche consumables, protecting value in the Hardcopy peripherals and printing consumables market.
By Distribution Channel:
MPS Transforms Business ModelsDirect/contractual routes garnered 46.10% of 2025 sales, with enterprises demanding custom SLAs and onsite support. Managed print services expand 5.15% CAGR, providing analytics dashboards and proactive toner replacement. Cloud MPS now runs in 69% of firms, up from 55% in 2023, driven by zero-trust architecture requirements. Subscription PraaS is spreading to mid-market customers: 37% of enterprises already treat print as opex, reducing upfront spend while locking in multi-year consumables flows.
Retail and e-commerce continue to serve SOHO, where fast delivery and price transparency remain critical. Vendors use channel sales data to forecast demand, trimming inventory by 12 days on hand in 2024, improving working-capital efficiency across the Hardcopy peripherals and printing consumables market.
Geography Analysis
North America Hardcopy Peripherals and Printing Consumables Market
North America led with 36.70% of 2025 revenue. The United States generated USD 13.2 billion, propelled by regulated sectors requiring secure print and by subscription PraaS contracts that align spend with ESG objectives. Canada mirrors these patterns, with distributed A4 MFPs replacing A3 copiers as offices downsize. Energy-Star certified laser units qualify for tax rebates, further fuelling upgrades. Together, these factors keep the Hardcopy peripherals and printing consumables market vibrant in the region.
APAC Hardcopy Peripherals and Printing Consumables Market
Asia-Pacific will grow fastest at 5.80% CAGR through 2031. China and India issue new industrial permits that call for track-and-trace labels, lifting consumables volumes. India installed 3,400 digital presses across tier-2 cities in 2024, a tenfold rise in four years. Japan remains a technology bellwether, commercialising high-viscosity pigment ink for textiles and ceramics. ASEAN nations leverage government “Industry 4.0” grants to buy cloud-connected MFPs, embedding lifelong consumables demand inside the Hardcopy peripherals and printing consumables market.
Europe Hardcopy Peripherals and Printing Consumables Market
Europe shows mature but green-driven evolution. Germany, France, and the United Kingdom push water-based and de-inkable toners to meet circular-economy directives. GDPR steers adoption of secure pull-print, adding license revenue for authentication software. Universities invest in additive manufacturing labs to support STEM research, increasing 3D material purchases. Southern Europe’s tourism rebound fuels hospitality signage, supporting wide-format ink volumes. These trends safeguard the Hardcopy peripherals and printing consumables market size across the continent.
South America and MEA Hardcopy Peripherals and Printing Consumables Market
South America and the Middle East and Africa present longer-term upside. Brazil’s growing e-commerce sector requires parcel labels and corrugated printing, lifting entry-level press sales. Colombia’s finance and education verticals drove Kyocera’s 38.2% market share in 2024. Gulf states modernise government services, adding secure MFP clusters. South Africa serves as a regional distribution hub, shortening supply lead times and improving device maintenance KPIs in the Hardcopy peripherals and printing consumables market.
Regulatory Landscape
Regulation affecting hardcopy peripherals and printing consumables increasingly centers on circularity, chemicals, and end-of-life obligations. In the EU, Regulation (EU) 2024/1781 (Ecodesign for Sustainable Products Regulation, ESPR) sets a framework for sustainability and circularity requirements that can extend to electronic equipment, strengthening design-for-repairability and information or disclosure expectations across printer and MFP portfolios. At the same time, legacy Ecodesign Directive measures for certain imaging equipment continue through the transition window ending December 31, 2026.
In the United States, chemical compliance and state e-waste rules are the main moving parts. The U.S. EPA finalized Significant New Use Rules (SNURs) under TSCA in May 2026 (effective July 2026), adding compliance diligence for substances used in materials and processing relevant to printing systems and supplies. Separately, state programs continue expanding covered-device scope, including Oregon E-Cycles (effective January 1, 2026), which adds printers and other peripherals, and California's Covered Electronic Waste (CEW) program, which broadens coverage to additional battery-embedded products. This raises OEM and channel requirements around registration, collection, and recycling reporting.
Value Chain Analysis
The value chain spans upstream electronics and imaging components (controllers, sensors, printheads/laser assemblies) and formulation inputs (toners, inks, coatings, substrates), then moves through OEM design and manufacturing. Downstream, products are distributed via direct and contractual enterprise channels, retail and e-commerce for SOHO, and managed print services (MPS) for fleet-level supply replenishment and service. Semiconductor allocation and cost inflation remain key upstream constraints, pushing OEMs to redesign boards, dual-source parts, and rebalance make-buy decisions. On the demand side, MPS and subscription models tighten the link between device placement and recurring consumables pull-through.
Recent supply-side moves also point to tighter integration and procurement consolidation across hardware and consumables ecosystems. Fujifilm and Konica Minolta formalized Global Procurement Partners Corp (January 2025) to optimize materials sourcing and development or production for toner-based printing systems and MFPs, reflecting regionalized sourcing and long-term contracting to manage volatility. In production and packaging print, BHS Corrugated and Agfa agreed (March 2025) on print engines for BHS Jetliner systems, with Agfa as a certified ink supplier, and Koenig and Bauer announced a global alliance with INX (June 2026) positioning INX as a preferred partner for UV/LED-UV inks on sheetfed presses. Overall, press performance, ink qualification, and supply assurance are increasingly managed as a bundled stack rather than standalone purchases.
Competitive Landscape
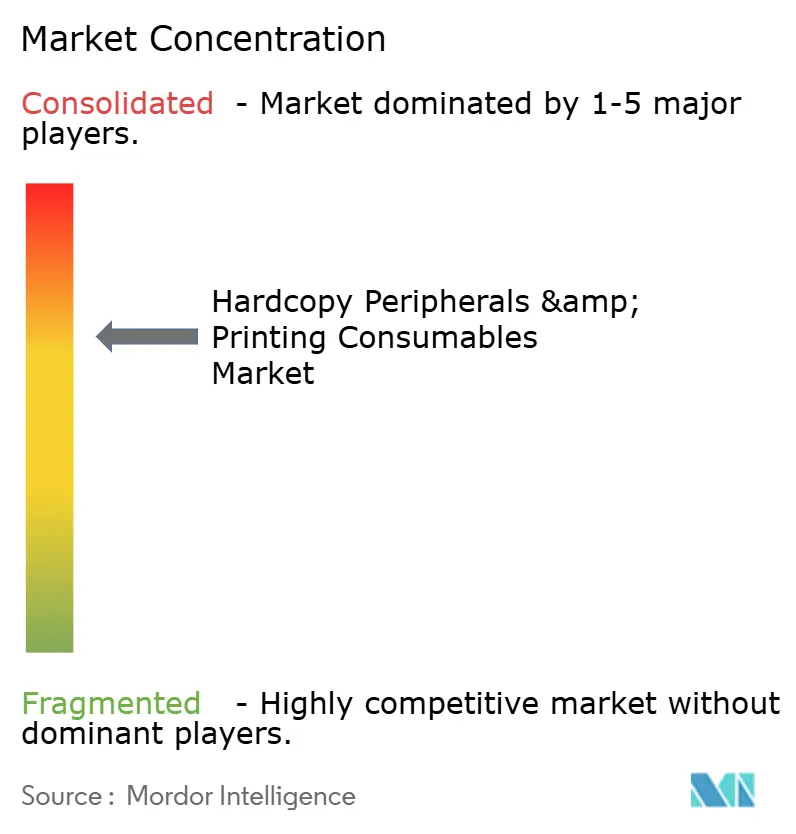
The Hardcopy peripherals & printing consumables market remains moderately concentrated: HP, Canon, Epson, Brother, and Xerox together hold about 70% global revenue. Hardware differentiation flattens as page cost, analytics, and sustainability shape value. HP’s quantum-resistant firmware and AI “perfect print” technology set new security benchmarks. Canon’s Fiery acquisition bolsters end-to-end colour management, deepening workflow integration. Epson rides refillable tanks, shipping 80 million EcoTank units since launch.
Ricoh owns 37.7% of the U.S. continuous-feed inkjet field and 60% in Canada, reflecting a successful vertical focus on transaction and book printing[5].
Chinese challengers Pantum and Ninestar exploit cost leadership and rapid firmware updates, widening footprint in Latin America and Africa. Heidelberg partners with Canon to deliver fibre-based packaging lines, targeting brands replacing plastic. Vendors that combine low-carbon devices, predictive service, and secure cloud APIs will gain share as the Hardcopy peripherals & printing consumables market pivots to outcome-based contracts.
Hardcopy Peripherals And Printing Consumables Industry Leaders
-
HP Inc.
-
Canon Inc.
-
Seiko Epson Corporation
-
Brother Industries Ltd.
-
Xerox Corporation
- *Disclaimer: Major Players sorted in no particular order
Hardcopy Peripherals And Printing Consumables Market Companies Covered in this Report
- HP Inc.
- Canon Inc.
- Seiko Epson Corp.
- Brother Industries Ltd.
- Xerox Corp.
- Kyocera Corp.
- Ricoh Co. Ltd.
- Konica Minolta Inc.
- Sharp Corp.
- Samsung Electronics (Printing)
- OKI Electric Industry Co.
- Lexmark International Inc.
- Toshiba Tec Corp.
- Fujifilm Business Innovation
- Dell Technologies
- Pantum Electronics
- Ninestar Corp.
- Zebra Technologies
- Electronics For Imaging (EFI)
- RISO Kagaku Corp.
Read Analysis of Hardcopy Peripherals And Printing Consumables Companies
Market Opportunities and Future Outlook
Opportunity areas cluster around workflow automation, security hardening, and production-class inkjet that expands high-value color volume and specialty applications. Product roadmaps and launches in 2026 show where vendors are directing R&D and go-to-market efforts: HP introduced LaserJet Pro 4000/4100 and LaserJet Enterprise 5000/6000 series with quantum-resistant security and AI-enabled document workflow tools (March 2026). This aligns with enterprise pull-print security and cloud management requirements, and it tends to favor MPS-led consumables attachment.
In commercial and industrial production print, B2/B2+ format digital inkjet and high-speed web-fed platforms are being positioned as bridge technologies for offset-to-digital transitions. That approach enlarges the addressable base for inks, toners, coatings, and service kits. HEIDELBERG announced general availability of its Jetfire 75 B2+ inkjet press integrated into the Prinect workflow ecosystem (February 2026). Fujifilm launched the REVORIA PRESS PC2120 with automation and six-color capability (June 2026), and Canon expanded production inkjet with the ColorStream 7000 series (June 2026). Canon also demonstrated the varioPRESS iV7 B2+ sheetfed inkjet system in the United States (July 2026). These moves, together with packaging and label in-housing trends already visible in the market, reinforce whitespace in workflow software, qualified consumables portfolios, and predictive service offerings that increase recurring revenue per installed device.
Recent Industry Developments in Hardcopy Peripherals And Printing Consumables Market
- June 2026: HP announced a strategic partnership with OpenAI to integrate the Frontier platform into its global operations, targeting both customer-facing experiences and internal transformation. The move reinforces the shift toward AI-enabled workflows and service-led differentiation that can increase attachment for managed services, security features, and digitally orchestrated supplies replenishment.
- June 2025: Seiko Epson announced global commercialization of its Direct to Shape Printing System, combining PrecisionCore printheads with robotics for printing directly on objects. This expands industrial inkjet use cases beyond paper, supporting demand for specialized inks, engineered substrates, and service contracts tied to new production workflows.
- May 2024: HP and Canva announced a multi-year global partnership to enable integrated design-to-print workflows for Canva users via HP Print Service Providers. This strengthens distributed, on-demand printing ecosystems by connecting design creation to localized production, supporting higher volumes of short-run jobs and consumables pull-through for PSP networks.
Hardcopy Peripherals And Printing Consumables Market Report Scope and Research Methodology
Market Definition and Coverage
This market covers revenue generated from new hardcopy printing devices and the recurring consumables that keep them running, counted on a global value basis in USD across commercial and consumer demand.
Scope exclusions: Used and refurbished devices, standalone scanners, and non-printing PC peripherals are not counted in this market sizing.
Segments Covered in This Report
- By Product Type
- Printers
- Copiers
- Multifunction Peripherals (MFPs)
- Wide-format / Production Printers
- 3-D Printers
- By Technology
- Inkjet
- Laser
- Solid-ink
- Thermal
- By End-User
- Residential
- Commercial / Office
- Educational Institutions
- Government and Public Sector
- Other Applications
- By Distribution Channel
- Direct / Contractual
- Retail and E-commerce
- Managed Print Services (MPS)
- By Geography
- North America
- United States
- Canada
- Europe
- Germany
- United Kingdom
- France
- Italy
- Spain
- Russia
- Rest of Europe
- Asia-Pacific
- China
- Japan
- India
- South Korea
- Australia and New Zealand
- Rest of Asia-Pacific
- South America
- Brazil
- Argentina
- Rest of South America
- Middle East and Africa
- Middle East
- Saudi Arabia
- United Arab Emirates
- Turkey
- Rest of Middle East
- Africa
- South Africa
- Nigeria
- Rest of Africa
- Middle East
- North America
Data Sources, Market Sizing, and Validation
Desk Research
Desk work starts by mapping how printing demand shows up in public data, so the market is not sized only from vendor narratives. We rely on sources such as US Census Bureau manufacturing and trade tables, USITC and UN Comtrade import and export series, OECD and World Bank macro indicators, and ISO and IEC standards libraries for product definitions and terminology.
To tighten the device and consumables linkage, we also read company filings, earnings decks, and reputable press coverage to track shipment momentum, channel shifts, and pricing commentary. In a limited way, paid subscriptions for company financial intelligence and shipment-level trade data are used to cross-check model inputs where public series are too aggregated. These desk sources are illustrative only, and we also used other public documents and data releases for collection, validation, and clarification.
Primary Interviews and Surveys
Primary work is used to confirm what is actually being bought and replenished, and where value is shifting between devices and supplies. We spoke with a mix of OEM and channel-facing professionals, corporate print buyers, and service partners to validate device replacement cycles, cartridge and toner yield assumptions, and typical discounting by region. Since this is a global market, inputs were checked across major demand centers in APAC, EMEA, and the Americas so regional mix effects are not overstated.
Distribution of primary research fieldwork respondents
| Company type | Respondent position | Region |
|---|---|---|
| Top tier: 37% | CXOs: 16% | APAC: 41% |
| Mid tier: 43% | Functional/Unit leaders: 32% | EMEA: 33% |
| Smaller Players: 20% | Managers: 52% | Americas: 26% |
Market-Sizing & Forecasting
Sizing begins with a top-down build where device demand is reconstructed from reported shipment and trade direction, then translated into value using typical ASP bands by format and technology, and then linked to the recurring consumables pool through installed base and usage logic. To keep the totals realistic, we corroborate them with selective bottom-up checks, such as sampled ASP times unit volumes in key countries, supplier revenue roll-ups where disclosure is available, and channel checks on consumables mix.
Key inputs that move the model include office versus home print intensity, installed base replacement cycles, cartridge and toner yield and page coverage assumptions, the mix shift between inkjet and laser, and regional currency effects on reported pricing. Where direct volume data is missing for niche formats (for example, specialty wide-format), we estimate gaps using proxy indicators like adjacent device shipments and distributor mix, then pressure-test those assumptions in interviews.
For forecasting, we lean on scenario analysis, since print volumes and device spending respond to macro growth, hybrid work patterns, and enterprise cost control in uneven ways. The forward view is anchored on expert consensus for the direction of print demand, combined with expected pricing progression for consumables and the pace of hardware refresh cycles.
Data Validation & Update Cycle
Outputs are checked through multiple passes so the final numbers do not rely on one dataset or one assumption. We compare the modeled value against independent signals such as import value trends, large-economy shipment momentum, and public revenue disclosures, and then investigate outliers before internal sign-off.
If large variances appear by region or by device versus consumables split, assumptions are revisited and primary contacts are re-engaged to confirm what changed in procurement behavior or channel inventory. Reports are refreshed annually, with interim updates when material events affect pricing, supply, or demand, and a final pre-delivery review is completed so clients receive the latest view.
Mordor Intelligence's Hardcopy Peripherals and Printing Consumables Market Size Versus Other Published Estimates
Published market values for this space often vary because the device scope and the consumables attachment logic are not handled the same way across studies, and because some sources update pricing assumptions at different points in the year. We also see differences when authors treat supplies as a broad printing category instead of tying them to the hardcopy installed base.
The main gap driver is whether adjacent items are pulled into the total, where Mordor Intelligence counts new printers, copiers, and multifunction systems together with recurring ink and toner consumables (including drums, fusers, and maintenance kits) but leaves out used equipment and standalone scanners, which can materially shift the value depending on what is bundled.
Benchmark comparison
| Source | Market Size | Gaps in Research Methodology |
|---|---|---|
| Mordor Intelligence | USD 141.14 B (2026) | |
| Global Consultancy A | USD 128.60 B (2026) | Often limits the scope to printer hardware and core cartridges, and it may exclude copier and MFP classes plus parts like drums and fusers, which reduces the recurring supplies pool tied to the installed base. |
| Industry Association B | USD 152.90 B (2026) | Frequently expands the basket to include managed print service value or broader document solutions, and it can apply higher average page volume assumptions, which lifts the implied consumables spend. |
The spread in the table mainly comes down to what gets counted as hardcopy equipment, how tightly consumables are connected to the device installed base, and how pricing is normalized across regions. By keeping the scope explicit and using repeatable checks on shipments, installed base, and replenishment behavior, the model stays transparent and easier to reconcile with real market signals.
Key Questions Answered in the Report
What is the current value of the Hardcopy peripherals & printing consumables market?
The Hardcopy peripherals & printing consumables market stands at USD 141.14 billion in 2026 and is forecast to reach USD 176.28 billion by 2031.
Which technology is growing fastest?
Laser devices post the quickest rise, advancing at a projected 5.85% CAGR through 2031 thanks to energy-efficient toner and improved total cost of ownership.
Why are managed print services gaining traction?
MPS save organisations 20-30% of printing cost, automate supplies replenishment and incorporate security analytics, prompting a 5.15% CAGR in the distribution segment.
How does hybrid work influence fleet design?
Decentralised teams need secure A4 multifunction printers near workpoints, replacing large A3 copiers and boosting demand for compact, cloud-connected models.
What role do ESG goals play?
Corporate paper-reduction and carbon-footprint targets drive adoption of low-energy devices, refillable consumables and closed-loop recycling, reshaping purchase criteria across the Hardcopy peripherals & printing consumables market.
Which region offers the strongest growth outlook?
Asia-Pacific leads with a 5.80% CAGR to 2031, fuelled by industrial expansion in China and India and rising investments in digital printing infrastructure.