Hair Care Products Market Size and Share
Market Overview
| Study Period | 2021 - 2031 |
|---|---|
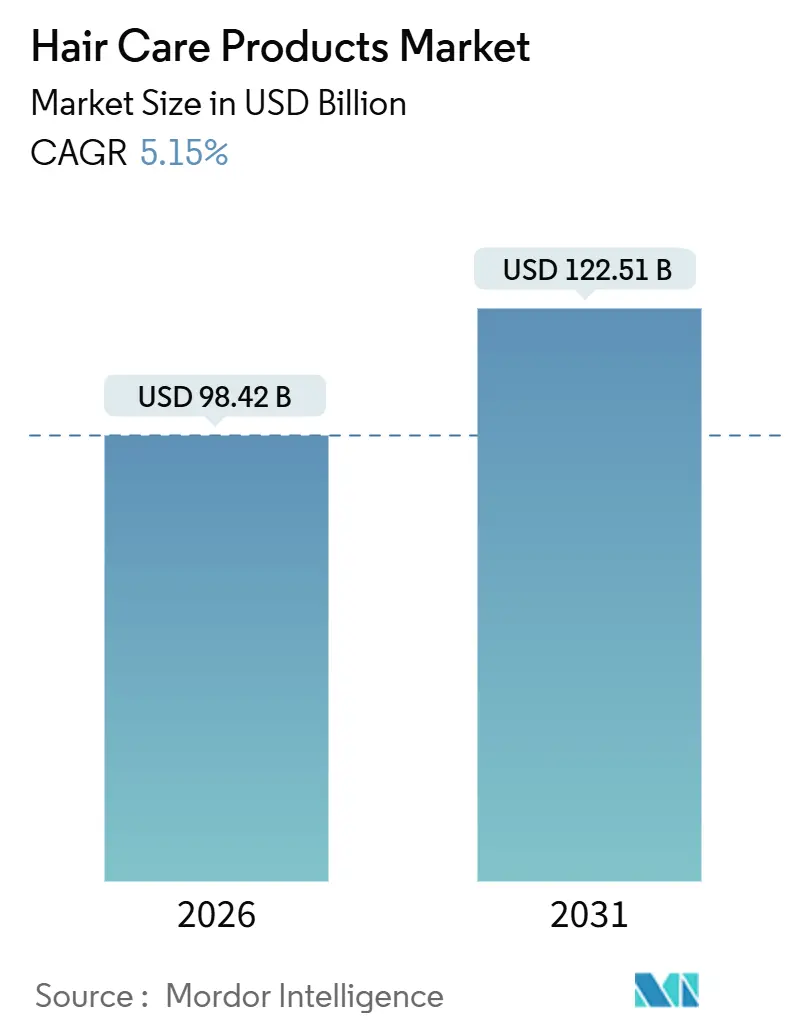
| Market Size (2026) | USD 98.42 Billion |
| Market Size (2031) | USD 122.51 Billion |
| Growth Rate (2026 - 2031) | 5.15% CAGR |
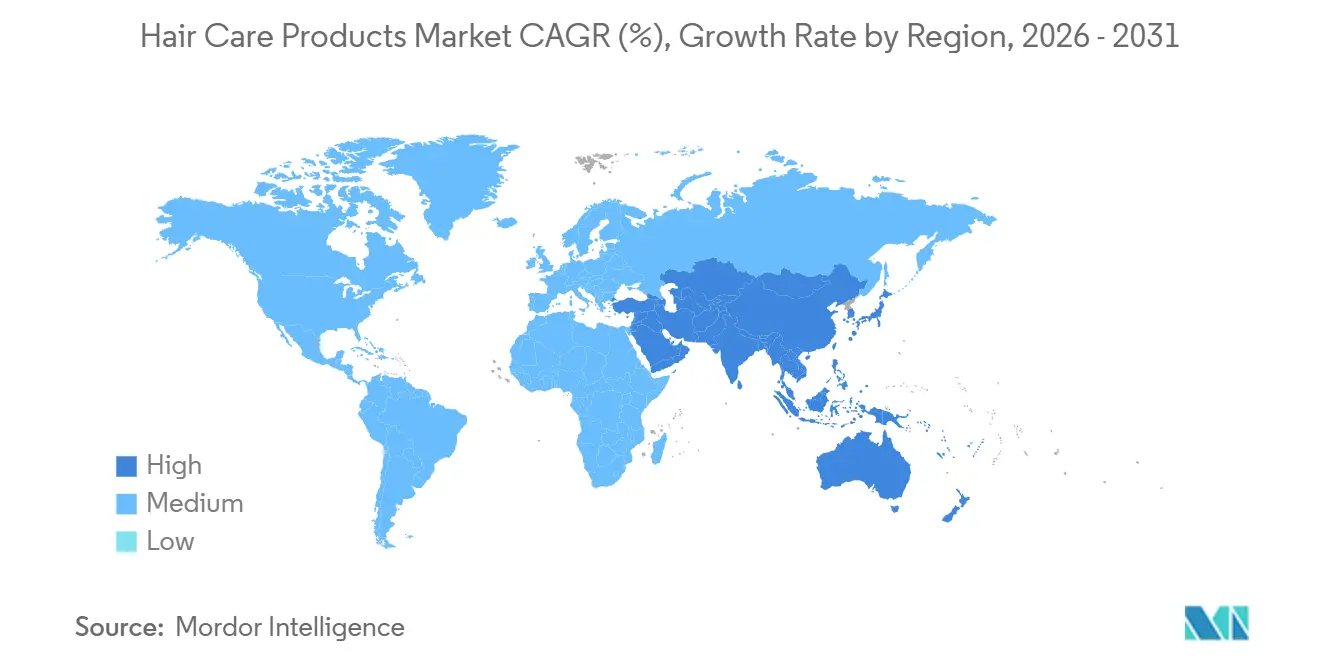
| Fastest Growing Market | Asia Pacific |
| Largest Market | Asia Pacific |
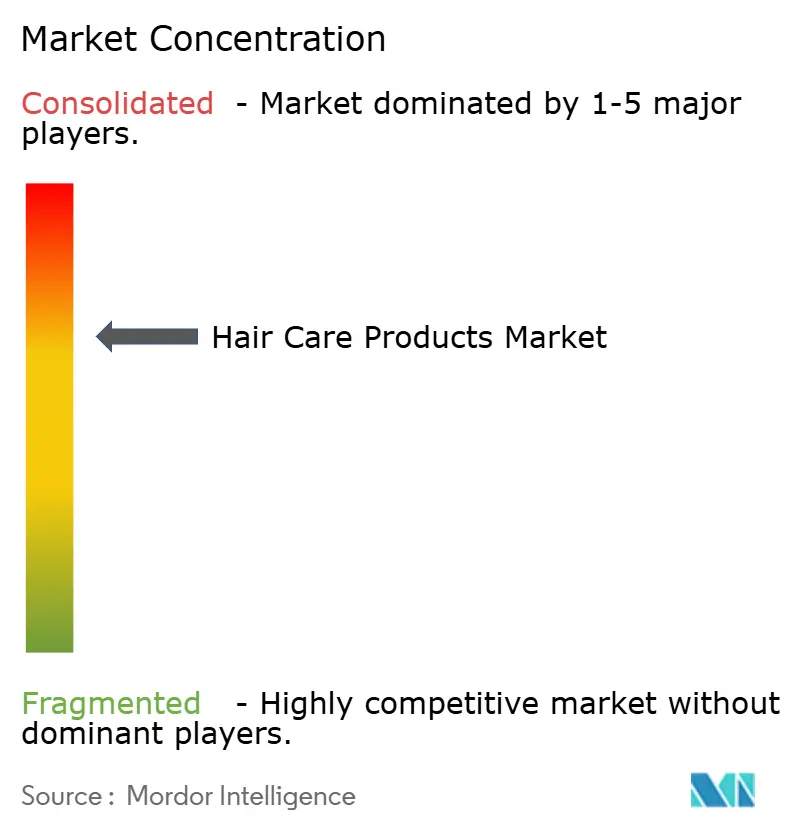
| Market Concentration | Medium |
Major Players *Disclaimer: Major Players sorted in no particular order Image © Mordor Intelligence. Reuse requires attribution under CC BY 4.0. | |
Hair Care Products Market Analysis by Mordor Intelligence
The hair care market size is valued at USD 98.42 billion in 2026 and is projected to reach USD 122.51 billion by 2031, advancing at a 5.15% CAGR. Growing consumer insistence on scientifically validated formulations, rapid regulatory change, and digital-first retail models together set the tone for expansion. Dermatological research tying the scalp microbiome to follicle vitality is steering R&D budgets toward probiotic actives and bond-repair chemistries. Asia-Pacific’s regulatory harmonization and fast-growing middle class keep the region ahead on both volume and premiumization. Meanwhile, e-commerce tools such as virtual try-ons compress discovery-to-purchase cycles, reshaping competitive dynamics. Although the hair care market remains fragmented, niche disruptors leveraging personalized diagnostics and refillable packaging are steadily capturing share from incumbents.
Key Report Takeaways
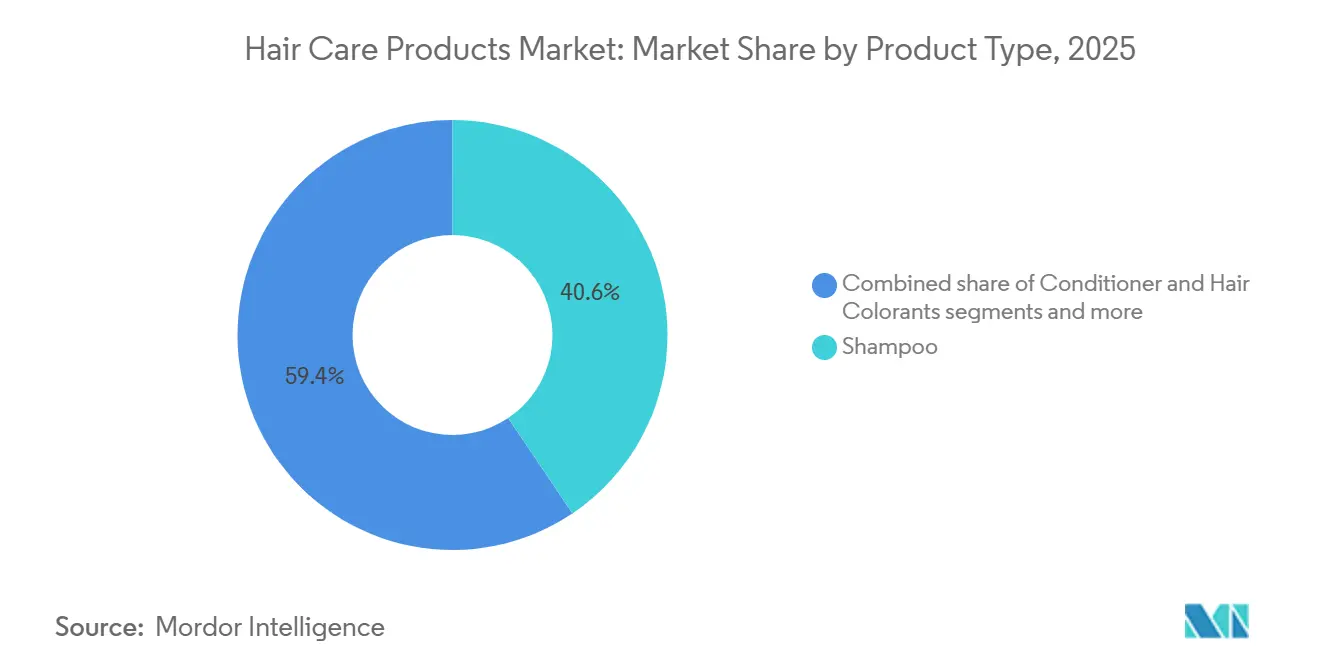
- By product type, shampoo led with 40.58% of the hair care market share in 2025, while styling products are forecast to expand at a 7.31% CAGR through 2031.
- By category, mass products held 75.68% share in 2025; premium lines are projected to post a 6.27% CAGR to 2031.
- By ingredient type, conventional formulations dominated with 75.12% share in 2025, whereas natural and organic products are on track for a 7.15% CAGR between 2026 and 2031.
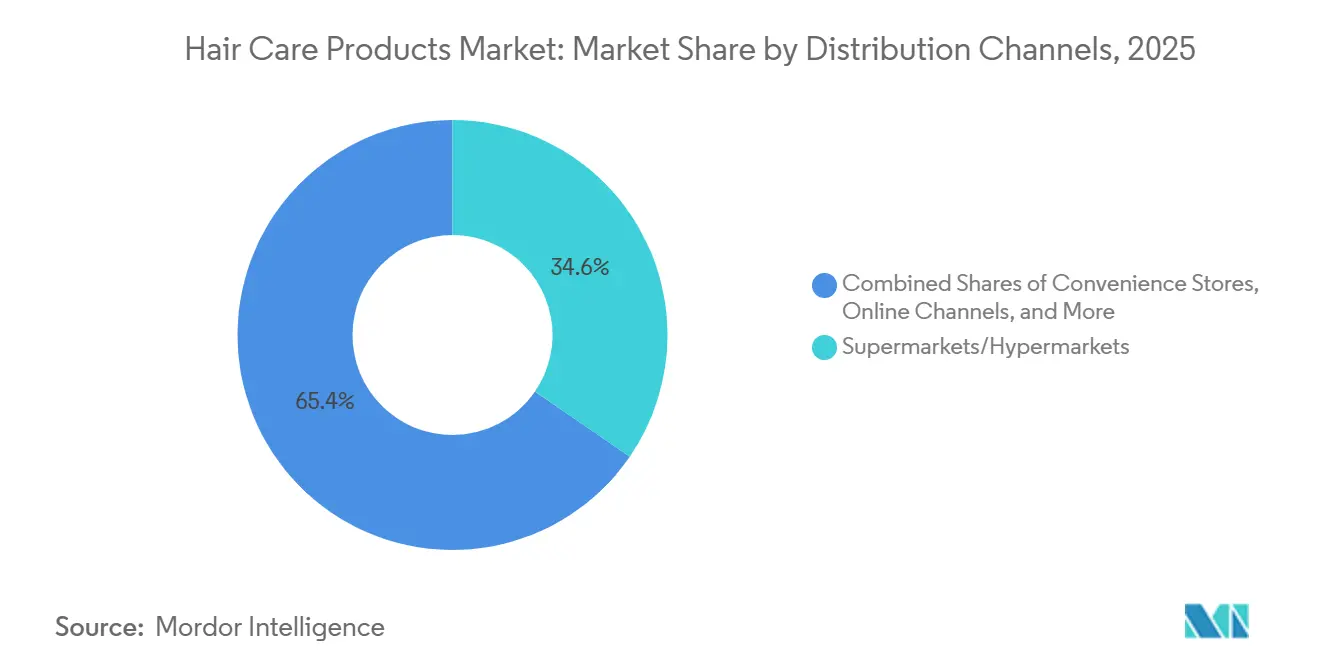
- By distribution channel, supermarkets and hypermarkets secured 34.58% of 2025 sales, yet online retail is the fastest-growing path at a 6.78% CAGR to 2031.
- By geography, Asia-Pacific commanded 35.63% of 2025 revenue and is expected to grow at 6.69% through 2031.
Note: Market size and forecast figures in this report are generated using Mordor Intelligence’s proprietary estimation framework, updated with the latest available data and insights as of January 2026.
Global Hair Care Products Market Trends and Insights
Drivers Impact Analysis
| Drivers | (~) % Impact on CAGR Forecast | Geographic Relevance | Impact Timeline |
|---|---|---|---|
| Strong Demand for Products Formulated with Clean Label Ingredients | +1.2% | Global, with peak adoption in North America & EU | Medium term (2-4 years) |
| Technological Innovations in Product Formulations | +1.5% | Global, led by Asia-Pacific and North America | Long term (≥ 4 years) |
| Demand for Multi-Functional and Damage Control Products | +1.1% | Global, particularly strong in Asia-Pacific | Medium term (2-4 years) |
| Rising Awareness of Scalp Health | +0.9% | Global, with early gains in North America, EU, and Japan | Long term (≥ 4 years) |
| Influence of Social Media and Influencers | +0.8% | Global, strongest in markets with high social media penetration (APAC, North America) | Short term (≤ 2 years) |
| Rising Consumer Awareness about Personal Hygiene | +0.6% | Global, with emphasis in emerging markets (South America, MEA) | Medium term (2-4 years) |
| Source: Mordor Intelligence | |||
Strong Demand for Products Formulated with Clean Label Ingredients
In 2024, the U.S. FDA chose not to define "natural" for cosmetics, leaving brands to navigate state-level regulations like California's law mandating the disclosure of 26 fragrance allergens[1]Source: U.S. Food and Drug Administration, “Natural Cosmetics,” fda.gov. In contrast, the EU's Regulation 1223/2009 enforces pre-market safety assessments and bans over 1,300 substances, a standard many global brands adopt to avoid the challenges of dual formulations. This regulatory disparity is driving ingredient innovation; brands are replacing synthetic preservatives, such as parabens, with fermentation-derived alternatives like Leuconostoc radish root ferment, recognized for its antimicrobial properties and low allergen risk, as noted in dermatology journals. The shift extends to packaging as well. Refillable formats now account for 12% of premium hair care sales in Western Europe, driven by Extended Producer Responsibility directives that impose recycling fees on single-use plastics. However, the clean-label movement faces challenges; while "natural" claims are widespread, fewer than 15% of products carry third-party certifications like USDA Organic or Ecocert, causing consumer confusion that competitors exploit through transparency-focused marketing.
Technological Innovations in Product Formulations
Artificial intelligence is shifting from being a marketing tool to becoming a critical asset in product formulation, significantly influencing product development cycles. In 2025, L'Oréal utilized its VOYAGER AI platform to evaluate 100,000 ingredient combinations for bond-repair efficacy. This initiative reduced lab testing time by 60% and discovered novel peptide sequences that outperformed existing technologies in tensile strength assessments. Similarly, Shiseido's generative AI examines consumer scalp images to provide personalized regimen recommendations. By processing microbiome data and sebum production metrics, it achieves an impressive 85% accuracy in predicting product performance. These advancements are expanding the scope of customization; brands that once limited bespoke formulations to ultra-premium lines are now introducing mass-market products with modular ingredient systems, enabling consumers to mix and customize at home. Biotechnology is also transforming sourcing methods. Precision fermentation now enables the production of squalane, keratin, and hyaluronic acid without relying on animal or plant extraction. This approach not only meets vegan certification standards but also reduces production costs by 30%. Between 2023 and 2025, patent filings for microencapsulation technologies increased by 40%, as brands aim to stabilize volatile actives like retinol and vitamin C in shampoos—ingredients that traditionally degraded within weeks of opening, as reported by WIPO. However, the rapid pace of innovation presents challenges. The quick turnover of ingredients often surpasses the timeline for comprehensive long-term safety studies. Additionally, regulatory bodies such as the European Chemicals Agency are enforcing stricter allergen testing protocols, causing product launch delays of 6 to 12 months.
Demand for Multi-Functional and Damage Control Products
In 2025, bond-building treatments became a significant segment, representing 18% of styling product sales and highlighting the billion-dollar market for repairing thermal styling damage. The core of this innovation lies in bis-aminopropyl diglycol dimaleate, a molecule that penetrates the hair cortex to reconnect broken disulfide bonds, effectively repairing structural damage caused by bleaching and heat. Brands are enhancing these formulations by integrating UV filters, antioxidants, and humidity-resistant polymers into heat protectants. This advancement simplifies three-step routines into a single application, appealing to time-pressed consumers. However, this multi-functionality complicates regulatory compliance, as claims must be validated through extensive testing. In 2024, the European Commission's Scientific Committee on Consumer Safety required separate efficacy studies for each claimed benefit, increasing product development costs by USD 50,000 to USD 100,000. The damage-control narrative resonates strongly in the Asia-Pacific region, where high humidity and frequent chemical treatments accelerate cuticle damage. Reflecting this demand, South Korea's Ministry of Food and Drug Safety approved 42 new bond-repair formulations in 2025, a 35% rise from the previous year[2]Source: Ministry of Food and Drug Safety, “Cosmetics Approvals 2025,” mfds.go.kr. These products address both immediate styling needs and long-term hair health. However, the reliability of efficacy claims remains a concern. Independent testing by consumer advocacy groups found that 40% of bond-repair products failed to show measurable improvements in tensile strength, undermining consumer trust and attracting regulatory scrutiny.
Rising Awareness of Scalp Health
In a paradigm shift, dermatological research is now positioning hair care as a discipline centered on scalp health, largely influenced by advancements in microbiome science. A study in 2024, featured in Frontiers in Cellular and Infection Microbiology, pinpointed 15 bacterial genera linked to healthy scalp conditions. Notably, species like Cutibacterium and Staphylococcus were highlighted for their role in producing antimicrobial peptides. These peptides play a crucial role in curbing the overgrowth of Malassezia, the primary culprit behind dandruff. In a bid to fine-tune this microbial balance, brands are now turning to prebiotics, such as inulin, and postbiotics, like propionic acid. This marks a significant shift from traditional antifungal agents, which often indiscriminately eliminate beneficial flora. In 2025, Japan's KOSÉ Corporation unveiled a scalp serum, harnessing the power of Lactobacillus ferment lysate. Clinical trials revealed its efficacy, showcasing a 28% reduction in sebum oxidation and enhanced follicle density in individuals grappling with androgenetic alopecia. The rise of diagnostic tools is evident, with handheld devices leveraging spectroscopy to assess sebum composition and microbial load. These devices craft personalized treatment protocols, which dermatologists subsequently validate during telehealth consultations. In a significant endorsement, the American Academy of Dermatology, in 2025, integrated scalp microbiome analysis into its clinical practice guidelines, lending credibility to a domain once dismissed by skeptics as mere pseudoscience.
Restraints Impact Analysis
| Resytraints | (~) % Impact on CAGR Forecast | Geographic Relevance | Impact Timeline |
|---|---|---|---|
| Adoption of Traditional At-Home Hair Care Solutions | -0.7% | Strong in South Asia (India, Pakistan), moderate in Southeast Asia and Latin America | Medium term (2-4 years) |
| Health Concerns Over Chemical Ingredients | -0.6% | Global, with regulatory pressure concentrated in EU and California | Long term (≥ 4 years) |
| Availability of Counterfeit Products | -0.4% | Concentrated in Asia-Pacific and MEA, particularly in e-commerce channels | Short term (≤ 2 years) |
| Intense Market Competition | -0.3% | Global, with price wars most severe in mass-market segments | Short term (≤ 2 years) |
| Source: Mordor Intelligence | |||
Adoption of Traditional At-Home Hair Care Solutions
Traditional remedies are experiencing a significant revival, particularly in regions where Ayurvedic and herbal treatments are culturally ingrained. In 2024, India's traditional medicine sector achieved a substantial USD 18.1 billion valuation. Hair care, fueled by ingredients such as amla, bhringraj, and shikakai—considered safer alternatives to synthetic options—accounted for 28% of these sales, according to the Ministry of AYUSH[3]Source: Ministry of AYUSH, “Traditional Medicine Market,” ayush.gov.in. Companies like Dabur and Himalaya have capitalized on this trend by launching mass-market products that combine traditional botanicals with modern preservatives, ensuring extended shelf life without refrigeration. Multinational brands face a significant challenge: these traditional remedies are priced 50% to 70% lower than imported products, creating a price-performance gap that marketing efforts struggle to overcome. DIY formulations are also gaining popularity on social media platforms; TikTok videos featuring rice water rinses and coconut oil masks have collectively garnered over 5 billion views, with users citing cost-effectiveness and ingredient transparency as primary drivers. However, the effectiveness of these remedies varies. Peer-reviewed studies reveal that while coconut oil helps reduce protein loss during washing, it does not repair existing damage—a limitation effectively addressed by commercial bond-repair treatments.
Health Concerns Over Chemical Ingredients
Debates over ingredient safety are escalating as regulatory agencies expand their lists of restricted substances. California's Safe Cosmetics Act, effective January 2025, will ban 24 chemicals, including formaldehyde-releasing preservatives and specific azo dyes. This regulation requires brands to reformulate products sold in the state or face penalties of USD 5,000 per violation. In 2024, the European Union added 12 substances, such as certain UV filters and phthalates, to Annex II of Regulation 1223/2009, citing toxicology studies that identified endocrine disruption risks. These restrictions increase compliance costs, as brands must perform stability testing, allergen assessments, and toxicological reviews for substitute ingredients, extending product development timelines by 9 to 15 months. Consumer advocacy groups, such as the Environmental Working Group, amplify these issues. Their annually updated "Dirty Dozen" list, which highlights specific molecules, influences the purchasing decisions of approximately 35 million U.S. consumers. However, public perception often outpaces scientific consensus. For example, parabens were widely criticized after a 2004 study suggested a link to breast cancer. Although subsequent research found no causal relationship, brands continue reformulating to mitigate reputational risks.
Segment Analysis
By Product Type: Shampoo Dominates Through Functional Evolution
Shampoo retained 40.58% of 2025 revenue and remained the anchor of the hair care market. In contrast, styling products are projected to log a 7.31% CAGR, reflecting thermal-tool adoption and the popularity of bond-repair sprays. This swing illustrates a maturing wash-category where incremental scent or mildness tweaks no longer warrant premiums. Bond-centric styling lines that restore disulfide bridges are particularly resonant among frequent color-treaters. Conditioners, with 28% share, advance at a gentler 4.8% as consumers experiment with leave-in creams and co-washing regimes. Hair colorants, at 18%, feel pressure from gray-acceptance movements but retain a salon stronghold because professional application mitigates ammonia exposure.
Global shipments of straighteners and curling irons topped 180 million units in 2025, feeding demand for heat-shield serums that prevent cuticle degradation at temperatures above 200 °C. L’Oréal’s 2024 Bond Repair release booked USD 320 million in its first year and captured 12% of the bond-repair niche. Scalpel-precise GMP certification (ISO 22716) acts as a trust signal online, lifting conversion rates by 15% for certified styling lines in counterfeit-prone Asian markets.
Note: Segment shares of all individual segments available upon report purchase
By Category: Mass Products Evolve Toward Premiumization
Mass-market lines controlled 75.68% of 2025 turnover, yet premium collections are slated for a 6.27% CAGR—112 basis points above the total hair care market. The premium sub-sector thrives on dermatologist endorsements and clinically substantiated claims that justify 35% to 50% price uplifts. North America and Western Europe remain strongholds where disposable incomes and eco-consciousness converge. Salon-anchored brands leverage stylist trust to sidestep price wars common on grocery shelves.
Mass-market stalwarts depend on promotional depth and broad distribution. Supermarket shelf presence locks in volume even as e-commerce drains urban share. Online channels reward premium entrants skilled in influencer alliances and subscription models, which can push repeat-purchase rates beyond 60% for customized formulas such as Function of Beauty. Pandemic-era digital acceleration entrenched these buying behaviors, and premium lines continue to outpace mass peers in direct-to-consumer growth.
By Ingredient Type: Natural Formulations Gain Despite Performance Gaps
Conventional chemistry still captures 75.12% of 2025 sales, but natural and organic lines are heading for a 7.15% CAGR as regulatory mandates and halal standards tighten. The Middle East’s halal segment calls for alcohol-free and animal-free inputs; the UAE updated certification rules in 2024 to require independent audits. In Europe, COSMOS certification demands that 95% of botanical inputs be organic, fueling an 18% jump in 2025 organic turnover.
Despite demand, sulfate-free shampoos often need higher dosages to lather, raising cost-per-wash by up to 30%. Hybrid formulas combining natural surfactants with minimal synthetic boosters attempt to strike a performance-ethics balance yet draw criticism for perceived compromise. Fermentation now delivers vegan keratin and squalane without sacrificing efficacy, giving natural claims a tangible performance footing. The U.S. FTC warned in 2024 that “natural” labels must prove minimal processing, a standard that fewer than 30% of self-identified natural SKUs meet
By Distribution Channel: E-Commerce Disrupts Traditional Retail
Supermarkets and hypermarkets collected 34.58% of 2025 spend, but online outlets grew at 6.78% as augmented reality and subscription boxes reshape discovery. L’Oréal’s ModiFace logged more than 2 billion virtual try-ons in 2025, converting 30% of users into buyers within 48 hours—a rate triple that of static listings. Specialty retailers and salons, holding 28% share, must contend with direct-to-consumer plays that reinvest saved margins into personalized content.
Subscription programs already account for 8% of digital hair-care receipts, providing first-party data that funnels into agile product development. E-commerce, however, heightens counterfeit risk: 1 in 5 hair-care items sold through third-party marketplaces in 2025 were falsified or gray-market imports. Europe’s Digital Services Act now assigns liability to platforms that fail to purge counterfeit listings within 48 hours, incentivizing robust brand-verification layers
Note: Segment shares of all individual segments available upon report purchase
Geography Analysis
Asia-Pacific commanded 35.63% of 2025 revenue and is forecast to rise at 6.69% through 2031. China’s 2024 policy shift cut import approvals from 18 months to 90 days and removed animal-testing obligations for most SKUs, slashing entry barriers for Western brands. The ASEAN Cosmetic Directive’s mutual-recognition mechanism trims regional launch costs by 40% and speeds cross-border distribution. K-beauty influences remain tangible: South Korean low-pH shampoos and scalp serums gain traction across Japan, China, and Southeast Asia, where gentle-cleansing themes resonate with humidity-prone consumers. India illustrates divergence, with premium imports flourishing in cities while Ayurvedic mainstays like Dabur and Himalaya hold 32% domestic share in 2025. Japan’s aging demographic lifts anti-graying and thickening demand; Kao’s Segreta line sold USD 180 million in 2025, up 22% year-on-year.
North America and Europe together generated 42% of 2025 sales, yet expand at a milder 4.8% because of saturation and private-label encroachment. Europe’s Regulation 1223/2009 sets the de facto global ingredient bar, prompting worldwide adoption to avoid dual formulations. North American clean-beauty proponents grew their slice of U.S. turnover to 18% in 2025, though performance deficits in sulfate- and paraben-free lines still deter mainstream conversion. Canada’s regulatory cooperation with the United States eases cross-border trade, but Quebec’s French-language packaging rule extends lead times for smaller entrants.
South America, the Middle East, and Africa collectively post a 5.8% growth rate, lifted by urbanization and rising incomes despite logistic hurdles. Brazil’s curl-defining category and keratin treatments thrive in humid conditions, fueling 12% 2025 market expansion. Halal standards drive Middle Eastern demand: the region’s halal cosmetics market reached USD 24 billion in 2024, with hair-care commanding 30% share; the UAE now mandates third-party audits that add up to nine months to launches. In urban South Africa, natural-hair advocacy lifted sales of curl-friendly lines by 28% in 2025, signaling a pivot away from chemical relaxers.
Competitive Landscape
The hair care products market exhibits moderate consolidation, characterized by the dominance of multinational corporations alongside an increasing presence of science-driven niche players. Market leaders L'Oréal, Procter & Gamble, and Unilever maintain their positions through continuous innovation and strategic acquisitions, with L'Oréal's Consumer Products Division achieving 8.9% growth driven by innovations like Elvive Glycolic Gloss. This technological integration extends to consumer-facing innovations like diagnostic tools, with L'Oréal's My Hair [iD] Hair Reader analyzing hair health and color to provide personalized recommendations.
Strategic patterns reveal increasing focus on premiumization across price segments, with mass brands introducing higher-priced lines to capture growing consumer willingness to invest in hair health. P&G reported high single-digit growth in hair care organic sales, driven by increased pricing, a premium product mix, and volume growth, particularly in North America.
White-space opportunities are emerging in specialized treatments addressing specific concerns like scalp health and damage prevention, with preventative approaches gaining traction over remedial solutions. The competitive landscape continues to evolve through strategic acquisitions, as demonstrated by Henkel's purchase of the Vidal Sassoon brand in Greater China from Procter & Gamble, strengthening its position in the premium retail segment.
Hair Care Products Industry Leaders
Unilever PLC
Procter & Gamble Company
L'Oréal S.A.
Estée Lauder Companies
Henkel AG & Co. KGaA
- *Disclaimer: Major Players sorted in no particular order
Recent Industry Developments
- February 2025: Cécred, a hair care company established by Beyoncé Knowles-Carter, initiated its exclusive distribution through Ulta Beauty, the largest beauty retailer in the United States. The products became available in more than 1,400 Ulta Beauty retail locations and on their digital platform, constituting the largest exclusive hair care product launch in Ulta Beauty's history.
- January 2025: JVN expanded its product portfolio with three hair care products: Reparative Bond Gloss, Shampoo, and Conditioner. These products repaired damaged keratin bonds in hair and improved shine. The products were distributed through Sephora.com and JVNhair.com.
- January 2025: Clairol launched ColorStrong, a new hair color line that combined vibrant colors with hair-strengthening properties. The product line offered consumers both rich color results and hair-strengthening benefits.
- November 2024: CavinKare Pvt Ltd introduced its 'Natural and Nourish Creme Hair Color' under the Indica brand. The product range comprised Natural Black, Dark Brown, and Burgundy variants, with prices starting at INR 15 across all distribution channels.
Research Methodology Framework and Report Scope
Market Definitions and Key Coverage
Our study treats the global hair care products market as the value generated from retail sales of shampoos, conditioners, colorants, styling aids, hair-repair treatments, oils, and serums that are marketed for human scalp or strand application.
Functional accessories (appliances, combs), pet products, and professional-only back-bar formulations are excluded.
Segmentation Overview
- By Product Type
- Shampoo
- Conditioner
- Hair Colorants
- Hair Styling Products
- Other Product Types
- By Category
- Premium Products
- Mass Products
- By Ingredient Type
- Natural & Organic
- Conventional / Synthetic
- By Distribution Channel
- Supermarkets/Hypermarket
- Specialty Stores
- Online Retail Stores
- Others Distribution Channel
- By Geography
- North America
- United States
- Mexico
- Canada
- Rest of North America
- Europe
- United Kingdom
- Germany
- France
- Italy
- Spain
- Russia
- Netherlands
- Sweden
- Rest of Europe
- Asia Pacific
- Japan
- China
- India
- Australia
- Rest of Asia Pacific
- South America
- Brazil
- Argentina
- Chile
- Colombia
- Peru
- Rest of South America
- Middle East and Africa
- United Arab Emirates
- South Africa
- Nigeria
- Saudi Arabia
- Egypt
- Morocco
- Turkey
- Rest of Middle East and Africa
- North America
Detailed Research Methodology and Data Validation
Primary Research
To refine assumptions, we interview dermatologists, ingredient suppliers, regional distributors, and buyers at salon chains across Asia-Pacific, North America, Europe, South America, and the Middle East and Africa. These conversations test usage frequency, emerging clean-label preferences, and average selling prices, letting us bridge gaps left by secondary data and strengthen final triangulation.
Desk Research
Mordor analysts begin with structured desk research that captures supply and demand footprints from non-paywalled tier-1 repositories such as UN Comtrade (HS 3305 trade flows), United States Census Bureau retail indicators, Eurostat production indices, WHO cosmetic safety alerts, and trade association briefs from Cosmetics Europe or the Personal Care Products Council. Company 10-Ks, investor decks, and press releases round out brand-level revenue splits, while D&B Hoovers and Dow Jones Factiva help us size private labels and monitor M&A moves. The sources named here illustrate our process; several additional public and proprietary documents were reviewed to validate and clarify data.
Market-Sizing and Forecasting
A top-down model converts population-level wash frequency, category penetration, and average pack pricing into a country revenue pool, which is then further filtered through channel share splits and currency conversions. Supplier roll-ups and sampled ASP times volume checks provide bottom-up reasonableness tests. Key drivers embedded in the model include online channel share, premiumization index, raw material price trends for surfactants and silicones, and per capita disposable income. Five-year forecasts use multivariate regression blended with scenario analysis, allowing elasticities on premium uptake and natural ingredient adoption that were vetted with primary experts.
Data Validation and Update Cycle
Outputs pass a three-layer review: automated variance scans versus historic series, peer review by a senior analyst, and final sign-off by the research manager. Models refresh annually, with mid-cycle revisions triggered by material events such as major regulatory shifts or currency shocks.
Why Mordor's Hair Care Products Baseline Commands Reliability
Published numbers often diverge because firms pick different product baskets, price bases, and refresh cadences.
Key gap drivers are scope breadth (some publishers fold scalp-specific dermatological treatments or salon back-bar volumes into retail totals), currency year selection, and optimistic premium pricing assumptions. Mordor's clearly defined retail-only scope, annual currency reconversion, and cross-check with shipment data temper both over and under estimation.
Benchmark comparison
| Market Size | Anonymized source | Primary gap driver |
|---|---|---|
| USD 95.39 B | Mordor Intelligence | - |
| USD 113.93 B | Regional Consultancy A | Includes professional back-bar sales and bundles scalp treatment devices with consumables |
| USD 110.77 B | Trade Journal B | Applies single global ASP without regional mix adjustment |
| USD 82.39 B | Global Consultancy C | Excludes premium online-only brands and converts currencies at pre-pandemic rates |
In short, the disciplined scope choices, dual-track validation, and timely refresh cycle used by Mordor Intelligence give decision-makers a balanced, transparent baseline that is both reproducible and ready for immediate application.
Key Questions Answered in the Report
What is the projected value of the global hair care market by 2031?
The hair care market is forecast to reach USD 122.51 billion by 2031, advancing at a 5.15% CAGR.
Which region leads current hair-care revenue?
Asia-Pacific led with 35.63% of 2025 global sales and maintains the fastest regional growth outlook.
Why are styling products growing faster than shampoos?
Styling lines embed bond-repair and heat-protection technologies that address damage from widespread thermal-tool use, driving a projected 7.31% CAGR.
What role does e-commerce play in hair-care sales growth?
Online channels grow at 6.78% annually, lifted by virtual try-on tech, subscription models, and direct-to-consumer personalization tools.


