
Market Overview
| Study Period | 2020 - 2031 |
|---|---|
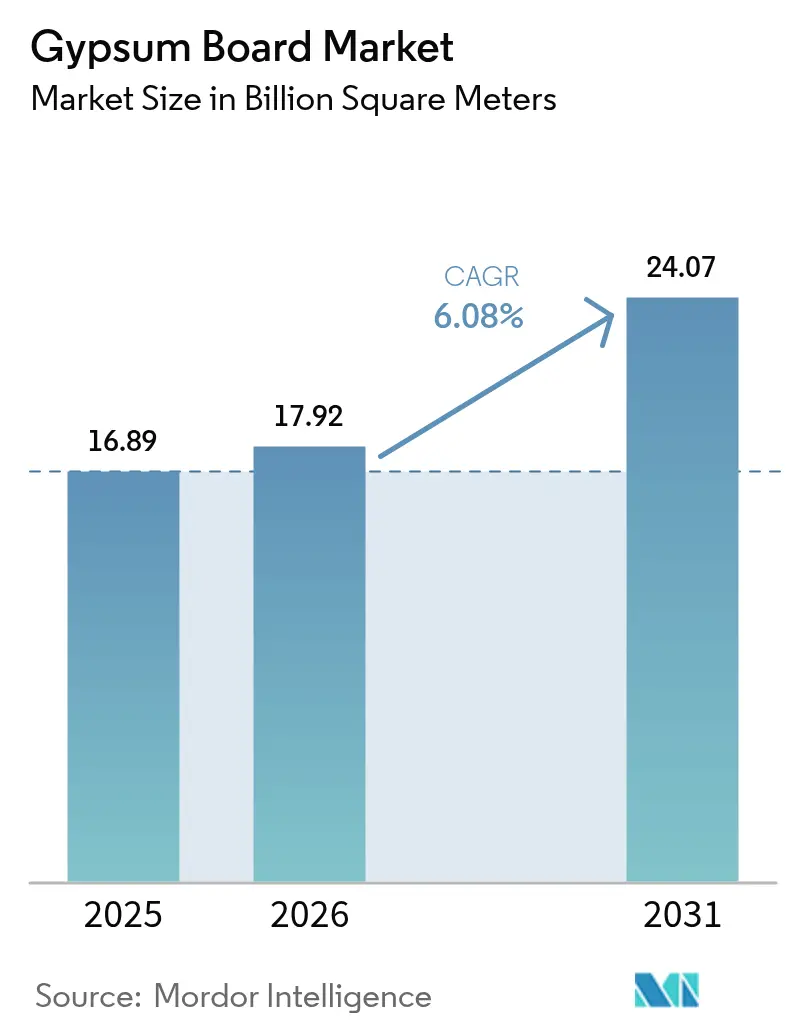
| Market Volume (2026) | 17.92 Billion square meters |
| Market Volume (2031) | 24.07 Billion square meters |
| Growth Rate (2026 - 2031) | 6.08 % |
| Fastest Growing Market | Asia Pacific |
| Largest Market | Asia Pacific |
| Market Concentration | High |
Major Players *Disclaimer: Major Players sorted in no particular order Image © Mordor Intelligence. Reuse requires attribution under CC BY 4.0. | |
Gypsum Board Market Analysis by Mordor Intelligence
Gypsum Board Market size in 2026 is estimated at 17.92 Billion square meters, growing from 2025 value of 16.89 Billion square meters with 2031 projections showing 24.07 Billion square meters, growing at 6.08% CAGR over 2026-2031. Ongoing fire-safety and energy-efficiency mandates anchor demand, while Asia-Pacific’s construction boom, chronic housing shortages in North America, and tightening embodied-carbon rules in Europe shape the competitive field. Capacity expansion projects in Texas and Montreal illustrate how producers balance cost discipline with sustainability investments. Meanwhile, the shift toward lightweight and pre-decorated solutions helps contractors mitigate labor shortages, and recycled or synthetic feedstocks gain strategic importance as coal-powered electricity retires faster than expected. Fiber-cement’s encroachment in wet areas keeps pricing rational, yet broad infrastructure renewal programs continue to backstop volume growth across the gypsum board market.
Key Report Takeaways
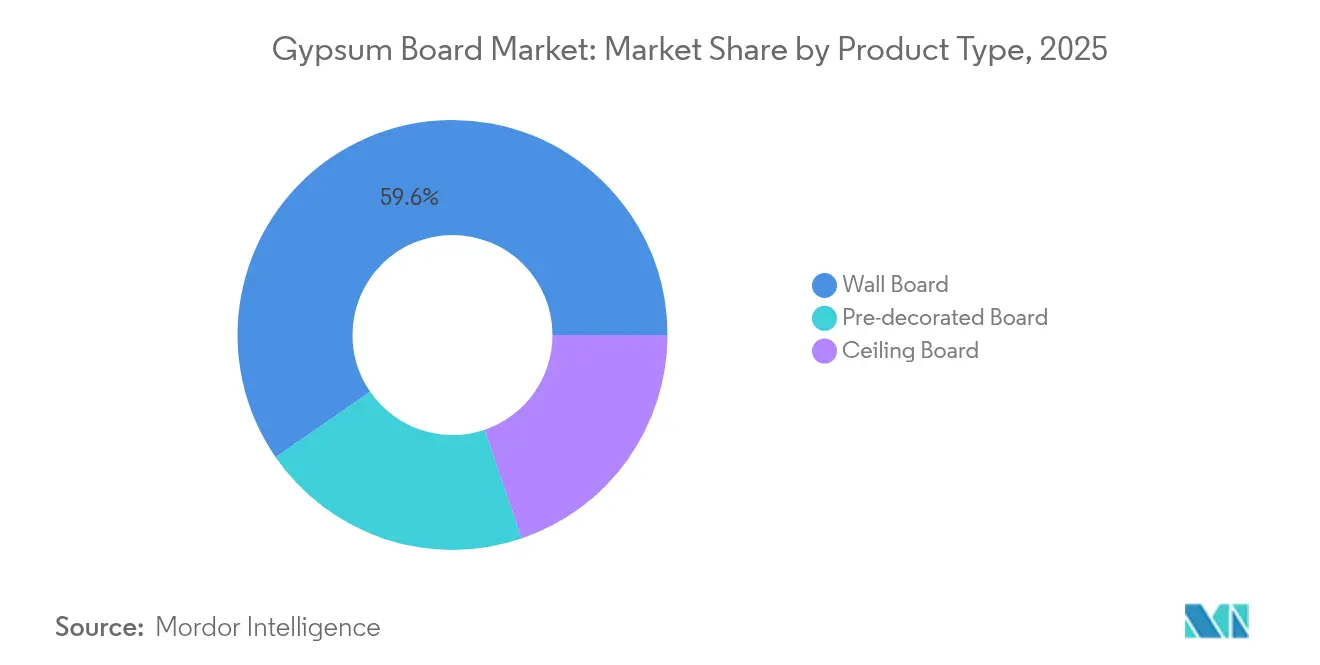
- By product type, wall board led with 59.62% of gypsum board market share in 2025, while pre-decorated board is projected to record a 7.39% CAGR to 2031.
- By raw material, natural gypsum accounted for 69.55% share of the gypsum board market size in 2025, whereas synthetic FGD gypsum is set to expand at 6.78% CAGR through 2031.
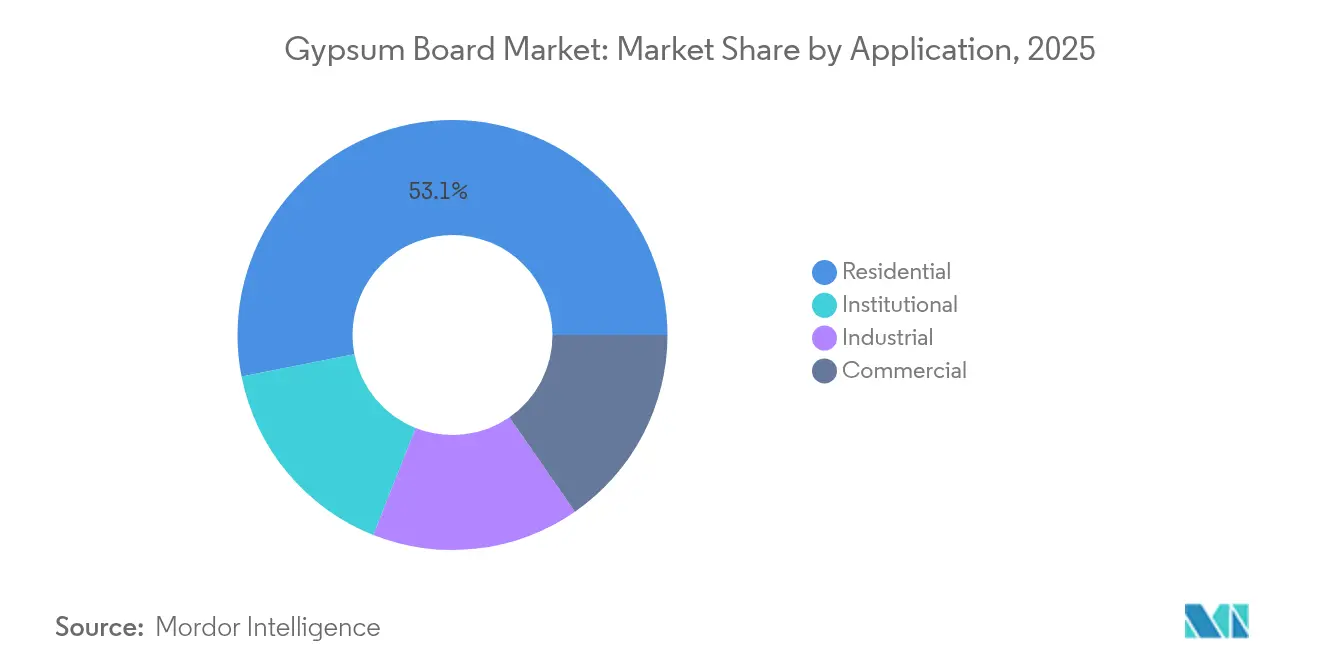
- By application, residential construction captured 53.10% share of the gypsum board market size in 2025; institutional projects are advancing at a 7.08% CAGR between 2026 and 2031.
- By geography, Asia-Pacific dominated with 46.10% gypsum board market share in 2025 and is forecast to grow at 7.31% CAGR to 2031.
Note: Market size and forecast figures in this report are generated using Mordor Intelligence’s proprietary estimation framework, updated with the latest available data and insights as of 2026.
Global Gypsum Board Market Trends and Insights
Drivers Impact Analysis*
| Drivers | (~) % Impact on CAGR Forecast | Geographic Relevance | Impact Timeline |
|---|---|---|---|
| Surging residential construction in APAC | +2.1% | Asia-Pacific core, spill-over to MEA | Medium term (2-4 years) |
| Accelerating renovation and remodeling wave in mature markets | +1.8% | North America and Europe | Short term (≤ 2 years) |
| Shift toward lightweight and high-strength drywall solutions | +1.2% | Global | Long term (≥ 4 years) |
| Government incentives for fire-, sound- and energy-efficient buildings | +1.0% | North America and EU, expanding to APAC | Medium term (2-4 years) |
| Cost-advantaged synthetic (FGD) gypsum availability | +0.9% | North America core, limited EU | Short term (≤ 2 years) |
| Source: Mordor Intelligence | |||
Surging Residential Construction in APAC
Rapid urban migration pushes developers toward high-density housing, and gypsum board systems help shorten interior fit-out cycles compared with wet plaster. Although China’s overall cement output fell 10% in 2024, wallboard volumes remained resilient because developers focused on accelerating finishing work to unlock cash flows. India’s government-backed housing schemes add steady baseline demand, while Southeast Asian megaprojects specify gypsum for its proven fire resistance in schools and transit hubs. Labor shortages across the region strengthen the appeal of factory-finished boards that reduce on-site trades.
Accelerating Renovation and Remodeling Wave in Mature Markets
Renovation outlays in the United States climbed to USD 509 billion in 2025, reversing two years of contraction. Forty percent of U.S. dwellings pre-date 1970, so wall replacements align with tighter fire and insulation codes, directly lifting gypsum demand. Homeowners spent an average USD 4,700 on interior upgrades, with mold- and moisture-resistant boards ranking high on shopping lists. Similar retrofit mandates in the EU catalyze orders for high-performance panels that combine thermal and acoustic gains. These dynamics sustain a stable volume base for the gypsum board market during economic slowdowns.
Shift Toward Lightweight and High-Strength Drywall Solutions
Eighty percent of global contractors report skilled-labor gaps, making board weight reduction a productivity lever. New formulations shave 20-30% off panel mass, easing handling while maintaining fire ratings. Glass-fiber-reinforced boards rated for over two-hour exposure extend use cases where Type X products once sufficed. Integration with mass-timber builds also reduces overall embodied carbon by up to 75% compared with conventional concrete toppings[1]. Research and development pipelines thus prioritize lighter yet stronger offerings that reposition the gypsum board market for evolving construction techniques.
Government Incentives for Fire, Sound, and Energy-Efficient Buildings
Federal P100 standards dictate stringent interior system performance for all U.S. civilian properties and spur adoption of specialty boards meeting specified fire and acoustic thresholds. California’s AB-2446 targets a 40% cut in building-material carbon intensity by 2035, which encourages low-carbon gypsum innovations. Similar policies in France under RE2020 tighten every three years and further elevate the value proposition for CarbonLow and similar lines. As incentives spread to Asia-Pacific, specification writers increasingly view gypsum as a multipurpose solution, broadening the gypsum board market’s institutional footprint.
Restraints Impact Analysis*
| Restraints | (~) % Impact on CAGR Forecast | Geographic Relevance | Impact Timeline |
|---|---|---|---|
| Volatile natural gypsum and energy prices | -1.4% | Global, acute in energy-intensive regions | Short term (≤ 2 years) |
| Rising penetration of fibre-cement and other panel alternatives | -0.8% | North America and APAC, limited EU | Medium term (2-4 years) |
| Carbon-neutral mandates raising embodied-carbon scrutiny | -0.6% | EU core, expanding to North America | Long term (≥ 4 years) |
| Source: Mordor Intelligence | |||
Volatile Natural Gypsum and Energy Prices
Mined gypsum output touched 22 million tons in the United States during 2024, but unit costs varied widely by mine depth and haulage distance. Calcination relies heavily on natural gas, making board pricing sensitive to fuel swings. As decommissioning of coal plants removes synthetic supply, mills draw from deposits located farther afield, inflating freight bills and amplifying cost risk[2]. Energy-efficient kilns and regional warehouse hubs partly soften the blow, yet input volatility still trims the gypsum board market growth trajectory in the near term.
Rising Penetration of Fibre-Cement and Other Panel Alternatives
Impact- and water-resistant boards are now marketed with fire ratings comparable to gypsum, eroding one of gypsum’s historic competitive moats. Healthcare and education projects increasingly specify hybrid wall assemblies, prompting gypsum suppliers to accelerate product differentiation strategies. Although substitution remains a minority threat, it nevertheless subtracts from the gypsum board market’s mid-term momentum.
*Our forecasts treat driver/restraint impacts as directional, not additive. The impact forecasts reflect baseline growth, mix effects, and variable interactions.
Segment Analysis
By Product Type: Wall Board Dominance Faces Pre-Decorated Disruption
Wall board retained 59.62% gypsum board market share in 2025, sustained by universal acceptance in residential interiors where cost and code compliance drive specification. Pre-decorated panels, however, are forecast to post 7.39% CAGR to 2031, a speed more than one percentage point above the overall gypsum board market.
Premium segments now favor mold-, moisture- or impact-modified boards such as PURPLE XP, priced at a 20-30% uplift over generic Type X, yet often selected for kitchens, baths, and healthcare corridors where downtime is costly. Manufacturers bundle these attributes with factory coatings to seize higher-margin value capture. As contractors increasingly pursue “paint-ready” delivery, pre-decorated formats are poised to widen their share within the gypsum board market.

By Raw Material: Natural Gypsum Leadership Challenged by Synthetic Transition
Natural rock contributed 69.55% of feedstock to the gypsum board market size in 2025, yet reliant producers confront exposure to ore-grade variability and diesel logistics costs. Synthetic FGD gypsum, although set back by coal-plant retirements, is still forecast to grow at 6.78% CAGR as mills retrofit for broader feed compatibility and as regulators recognize its recycling benefits.
Moving forward, blended recipes of mined, synthetic, and recycled fines should stabilize input risk profiles while supporting the gypsum board market’s circular-economy credentials.
By Application: Residential Scale Contrasts with Institutional Growth Dynamics
Residential remodeling and new-home builds absorbed 53.10% of 2025 volume, confirming the segment’s anchor role inside the gypsum board market. Yet institutional buildings, schools, hospitals, and civic centers, are projected to expand fastest at 7.08% CAGR as code writers elevate fire and acoustic baselines for occupant safety.
Institutional specifications increasingly bundle low-embodied carbon with 1- or 2-hour fire separation, steering demand toward specialty boards and thereby lifting average selling prices. Meanwhile, commercial office starts soft-pedal yet data-center and healthcare builds offset much of the slack, maintaining a diverse end-use profile that underpins the gypsum board market during economic cycles.
Geography Analysis
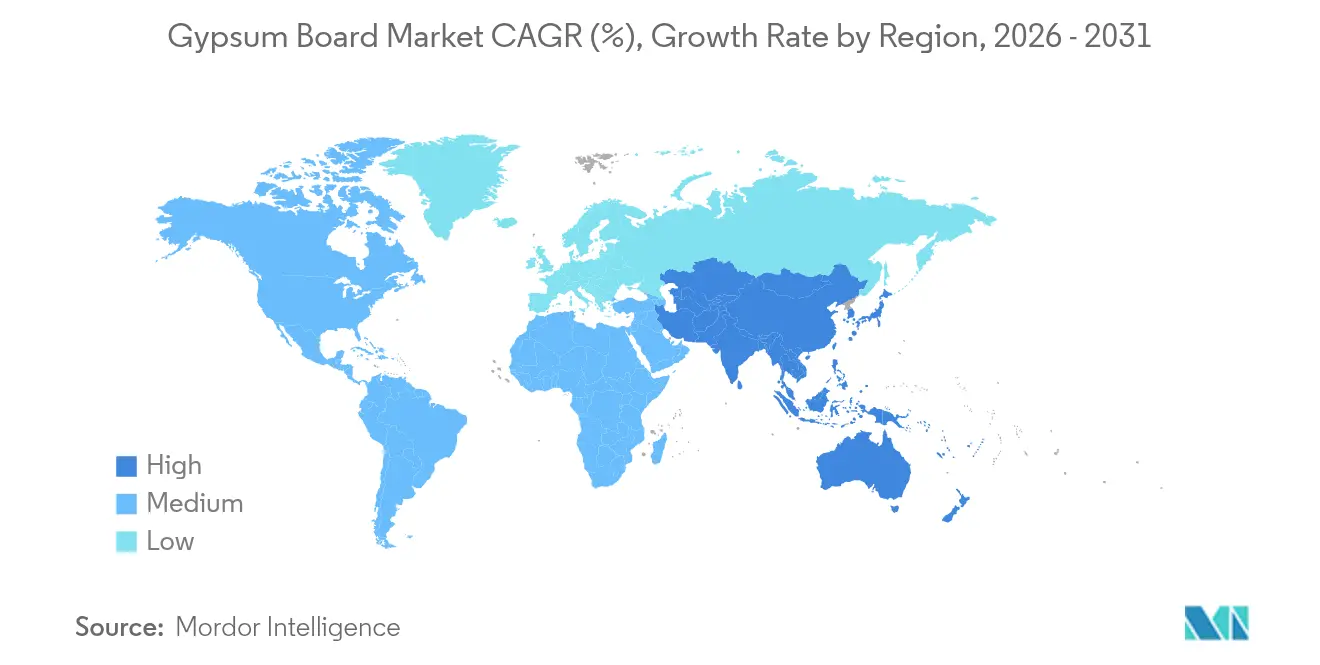
Asia-Pacific claimed 46.10% of 2025 shipments, thanks to China’s massive real-estate backlog and India’s Housing for All program. Regional growth at 7.31% CAGR through 2031 ensures the gypsum board market remains volume-weighted to this geography despite political and credit risk clouds.
North America embodies renovation-driven steadiness. Europe’s pathway is more regulation-led, as RE2020 and similar frameworks reinforce demand for carbon-optimized designs despite slower macro indicators. Together, the three regions shape the competitive map, while South America, and Middle-East and Africa remain opportunity frontiers where lower per-capita penetration leaves headroom for future gypsum board market growth.
Manufacturers differentiate through environmental product declarations, often bundling recycled content to meet tender prerequisites. Although construction output is flatter than Asia-Pacific, premium ESG-minded pricing offsets slower unit growth, safeguarding revenue expansion inside the gypsum board market.
Value Chain Analysis
The gypsum board value chain begins with feedstock sourcing, natural gypsum from quarries and mines, plus synthetic gypsum such as FGD material from power plants and recycled gypsum recovered from manufacturing and construction waste. Inputs also include paper facers or glass mat, starch and other additives, alongside energy for calcination and drying, which keeps natural gas and electricity availability and pricing central to cost competitiveness.
Because gypsum board is high volume and freight intensive, manufacturing is often organized as a regional network. Plant siting and distribution economics therefore depend on proximity to both raw material sources and construction demand centers. Finished boards typically move through building-material dealers, retail channels, and lumber yards, while standards and documentation, for example ASTM C1396 in North America and Type III Environmental Product Declarations supported by bodies such as the Gypsum Association and Eurogypsum, influence specification and procurement decisions for fire, sound, and moisture performance.
Competitive Landscape
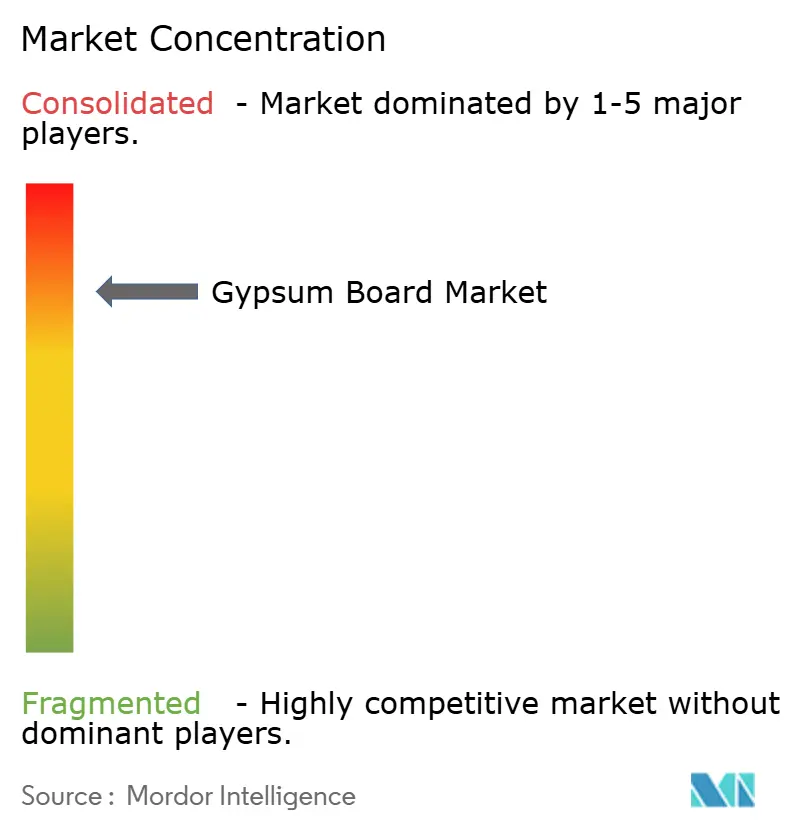
The gypsum board market exhibits high consolidation. Strategic pivots emphasize product differentiation over price cuts. Saint-Gobain markets CarbonLow with up to 60% less embodied carbon, targeting projects subject to green-building credits. Technology uptake extends to logistics and recycling. Automated guided vehicles inside plants cut handling costs, while pilot facilities in Germany and the United States process site scraps into feedstock, reducing landfill fees and supporting ESG disclosures. Competitive intensity thus hinges on who commercializes sustainable solutions at scale fastest, as price wars remain limited by high capital barriers and freight sensitivities that localize supply.
Gypsum Board Industry Leaders
-
BNBM
-
Etex Group
-
Georgia-Pacific Gypsum LLC
-
Knauf Group
-
Saint-Gobain
- *Disclaimer: Major Players sorted in no particular order
Market Opportunities and Future Outlook
A gap is emerging around supply-chain resilience and regionalization, especially where freight costs and disruptions make locally produced wallboard more competitive than long-haul supply. North American capital deployment reflects this focus, including the June 2026 opening of a new wallboard plant in Wheatland County, Alberta (CGC Inc., Knauf Group) and the May 2026 advancement of USG plans for a large gypsum manufacturing facility in Orange, Texas, supported by the Texas Jobs, Energy, Technology and Innovation (JETI) program.
Decarbonization and circularity also create room for product and process upgrades across the gypsum board market, including low-embodied carbon lines and feedstock strategy as synthetic FGD availability tightens with coal retirements. Producers are increasing optionality through higher recycled gypsum use and process efficiency initiatives. Permitting and resource development, for example the May 2026 industrial approval for CertainTeed Canada’s Antrim Gypsum Mine in Nova Scotia, further points to efforts to secure long-life natural gypsum supply for domestic manufacturing. At the same time, formulation and drying-control work that targets lower water and energy intensity is being pursued alongside lightweight and pre-decorated board formats, which address contractor productivity constraints and premium specification needs.
Recent Industry Developments
- June 2026: Etex acquired a majority stake in Algeria-based Global Gypse, expanding its plasterboard manufacturing footprint in North Africa. The deal strengthens local supply capability in a freight-sensitive product category and supports Etex's push to grow in markets where construction demand is served best by regional production.
- June 2026: Knauf Group, through its CGC Inc. division, opened a new wallboard manufacturing plant in Wheatland County, Alberta, Canada. The added capacity increases supply coverage in Western Canada and reinforces the industry trend toward placing plants closer to end markets to manage logistics costs and service levels.
- October 2024: Saint-Gobain Canada announced CarbonLow, a gypsum wallboard line positioned at up to 60% less embodied carbon and tied to a planned zero-carbon gypsum facility near Montreal. The launch increased competitive pressure around EPD-backed, low-carbon specifications in institutional and renovation projects where embodied-carbon criteria are becoming part of tender requirements.
Research Methodology Framework and Report Scope
Market Definition and Coverage
For this methodology, the gypsum board market covers factory-made gypsum boards sold for interior construction, mainly for wall, ceiling, and partition systems, across residential and non-residential buildings. We track demand at the point of board consumption and size it in square meters to keep results comparable across regions.
Scope exclusions: It excludes jointing compounds, metal studs and framing, insulation, paint, and installation labor, and it also excludes gypsum plaster and other non-board wall systems.
Segmentation Overview
- By Product Type
- Wall Board
- Ceiling Board
- Pre-decorated Board
- By Raw Material
- Natural Gypsum
- Synthetic (FGD) Gypsum
- Recycled Gypsum
- By Application
- Residential
- Commercial
- Institutional
- Industrial
- By Geography
- Asia-Pacific
- China
- India
- Japan
- South Korea
- Thailand
- Malaysia
- Indonesia
- Vietnam
- Rest of Asia-Pacific
- North America
- United States
- Canada
- Mexico
- Europe
- Germany
- United Kingdom
- France
- Italy
- Spain
- Russia
- Turkey
- Nordics
- Rest of Europe
- South America
- Brazil
- Argentina
- Colombia
- Rest of South America
- Middle-East and Africa
- Saudi Arabia
- United Arab Emirates
- Nigeria
- Egypt
- Qatar
- South Africa
- Rest of Middle-East and Africa
- Asia-Pacific
Data Sources, Market Sizing, and Validation
Desk Research
Desk work starts by grounding the model in construction activity and materials indicators that can be checked openly. We typically use national statistics offices for building permits and housing starts, UN Comtrade trade flows for gypsum and gypsum products, and USGS mineral summaries for gypsum production. Where relevant for supply context, we also review energy and environment agency information on flue gas desulfurization gypsum. In parallel, building code and fire safety references (such as IBC-aligned publications and national code portals) are used to understand where drywall adoption is structurally supported.
On the industry side, we review company filings and investor presentations for capacity additions, plant utilization commentary, and regional demand signals. Patent databases are used selectively to track board innovations tied to fire, moisture, and lightweighting claims. When trade is a meaningful supply lever, we may also use an import and export shipment-level database. The desk source list here is illustrative only, and other public references were used during data collection, validation, and clarification.
Primary Interviews and Surveys
Primary work is used to test what the desk indicators miss, especially local channel behavior and product mix shifts. We speak with manufacturers, distributors, contractors, and large buyers, then cross-check by region so supply changes and construction cycles are not blended into one average. Assumptions such as board mix, typical thickness preferences, and substitution to pre-decorated boards are validated before the final model is locked.
Distribution of primary research fieldwork respondents
| Company type | Respondent position | Region |
|---|---|---|
| Top tier: 38% | CXOs: 18% | APAC: 45% |
| Mid tier: 40% | Functional/Unit leaders: 22% | EMEA: 35% |
| Smaller Players: 22% | Managers: 60% | Americas: 20% |
Market-Sizing & Forecasting
Sizing is built using a top-down approach where construction demand proxies are translated into gypsum board consumption, then converted into square meters using typical coverage factors and product mix by end use. To keep totals realistic, we corroborate results with selective bottom-up checks, including sampling board pricing by region and combining it with observed volume ranges. We then adjust for distribution markups and mix where needed.
Key inputs used in the model include housing completions and new floor area additions, commercial fit-out intensity, renovation share versus new build, gypsum board import and export trends, and capacity announcements paired with utilization ranges gathered from interviews. Because square meters can increase even when revenue does not, we also track signals that change board yield, such as shifts toward thinner boards, higher share of moisture and fire rated boards, and adoption of pre-decorated products in fast-turn projects.
For forecasting, scenario analysis is applied on top of short-run time series smoothing, so the model reflects different paths for construction cycles, interest rates, and public infrastructure spending. When bottom-up checks are missing for a smaller country, gaps are handled through peer-market ratioing based on per-capita floor area trends and trade dependence, then rechecked with regional experts.
Data Validation & Update Cycle
Validation is done by comparing modeled consumption against independent signals, including regional construction output changes, trade balances, and whether implied utilization looks feasible against known capacity. Outliers are reviewed, and if a sharp jump is driven by one assumption, the related inputs are reopened and rechecked with at least one additional interview.
Before sign-off, the model and logic go through a multi-step analyst review so unit conversions, coverage factors, and mix assumptions remain consistent across regions. The study is refreshed annually, and interim updates are made when large capacity additions, trade restrictions, or demand shocks materially change the outlook. Right before delivery, we do a final pass to incorporate the latest public releases and any new field feedback.
Mordor Intelligence's Gypsum Board Market Estimate Compared With Other Published Estimates
Published market sizes for gypsum board can look far apart even when everyone is describing a similar construction use case. This usually happens because the unit of sizing differs, the product set included is wider or narrower, and the conversion from building activity to board demand is handled with different input choices.
The benchmark table shows a unit split that is a common source of mismatch, and in Mordor Intelligence's model the market is sized in square meters of board consumption. This avoids inflating totals when higher priced specialty boards gain share or when currency rates move sharply.
Benchmark comparison
| Source | Market Size | Gaps in Research Methodology |
|---|---|---|
| Mordor Intelligence | USD 17.92 B (2026) | |
| Global Consultancy A | USD 62.04 B (2024) | Reports revenue in USD for gypsum board, which can embed pricing, channel margins, and specialty-board premium effects that are not comparable to a volume-led total, and the base year differs from the forecast-year view. |
| Industry Publisher B | USD 13.73 B (2024) | Uses a narrower revenue base and different category splits, and may apply conservative pricing progression, which can hold down the total even if square meter demand is rising with construction activity. |
Reading the three numbers together, the spread is mainly explained by whether the market is presented as physical consumption or as revenue, plus differences in base year and mix pricing logic. Our approach stays traceable because the drivers are tied to observable construction activity and board coverage factors, and then stress-tested with channel feedback before the forecast is finalized.
Key Questions Answered in the Report
What is the current size of the gypsum board market?
The gypsum board market size reached 17.92 billion m² in 2026 and is projected to climb to 24.07 billion m² by 2031.
Which region leads the gypsum board market?
Asia-Pacific dominates with 46.10% share in 2025 and is expected to post the fastest 7.31% CAGR to 2031.
Which product segment is growing fastest?
Pre-decorated gypsum board is forecast to expand at 7.39% CAGR, outpacing traditional wall board growth.
How are sustainability mandates influencing gypsum board demand?
Embodied-carbon regulations such as California’s AB-2446 and France’s RE2020 spur demand for low-carbon boards like Saint-Gobain’s CarbonLow, shifting specifications toward greener products.
What is the biggest restraint on gypsum board market growth?
Volatile energy and raw-gypsum costs reduce producer margins and can slow capacity additions, trimming near-term growth prospects.