
Gulf Of Mexico Oil and Gas Market Size and Share
Market Overview
| Study Period | 2021 - 2031 |
|---|---|
| Forecast Data Period | 2026 - 2031 |
| Historical Data Period | 2021 - 2024 |
| Growth Rate | 2.64 % |
| Market Concentration | Low |
Major Players *Disclaimer: Major Players sorted in no particular order Image © Mordor Intelligence. Reuse requires attribution under CC BY 4.0. | |
Gulf Of Mexico Oil and Gas Market Analysis by Mordor Intelligence
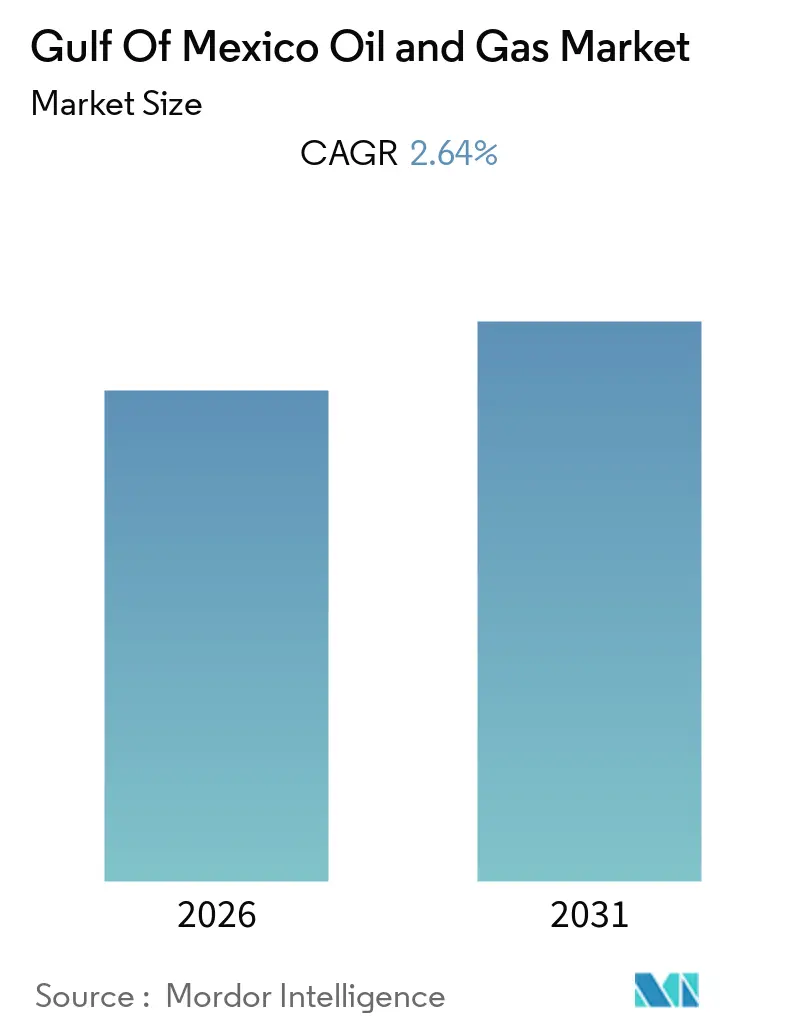
The Gulf Of Mexico Oil And Gas Market size is expected to register a CAGR of 2.64% during the forecast period (2026-2031).
- Over the medium term, the GOM oil and gas market is expected to thrive in the coming years due to the high resource potential in huge oil and gas reserves and a high active rig count.
- On the other hand, the volatility of oil and gas prices globally is expected to impede market growth in the near future.
- Nevertheless, the region contains bright prospects for deepwater exploration and production, which is expected to create significant opportunities during the forecasted period.
Note: Market size and forecast figures in this report are generated using Mordor Intelligence’s proprietary estimation framework, updated with the latest available data and insights as of 2026.
Gulf Of Mexico Oil and Gas Market Trends and Insights
Upstream Segment Expected to Dominate the Market
- The Gulf of Mexico has significant oil and gas reserves in shallow and deepwater areas. The region has a long history of exploration and production activities, and there is still untapped potential, particularly in deepwater and ultra-deepwater regions. The exploration and development of these reserves drive the gulf of Mexico oil and gas upstream segment's dominance in the Gulf of Mexico market.
- In recent years, as onshore oil fields have matured, offshore exploration and production (E&P) activities have seen a noticeable increase. The Gulf of Mexico region has experienced consistent growth in crude oil and natural gas production for four decades.
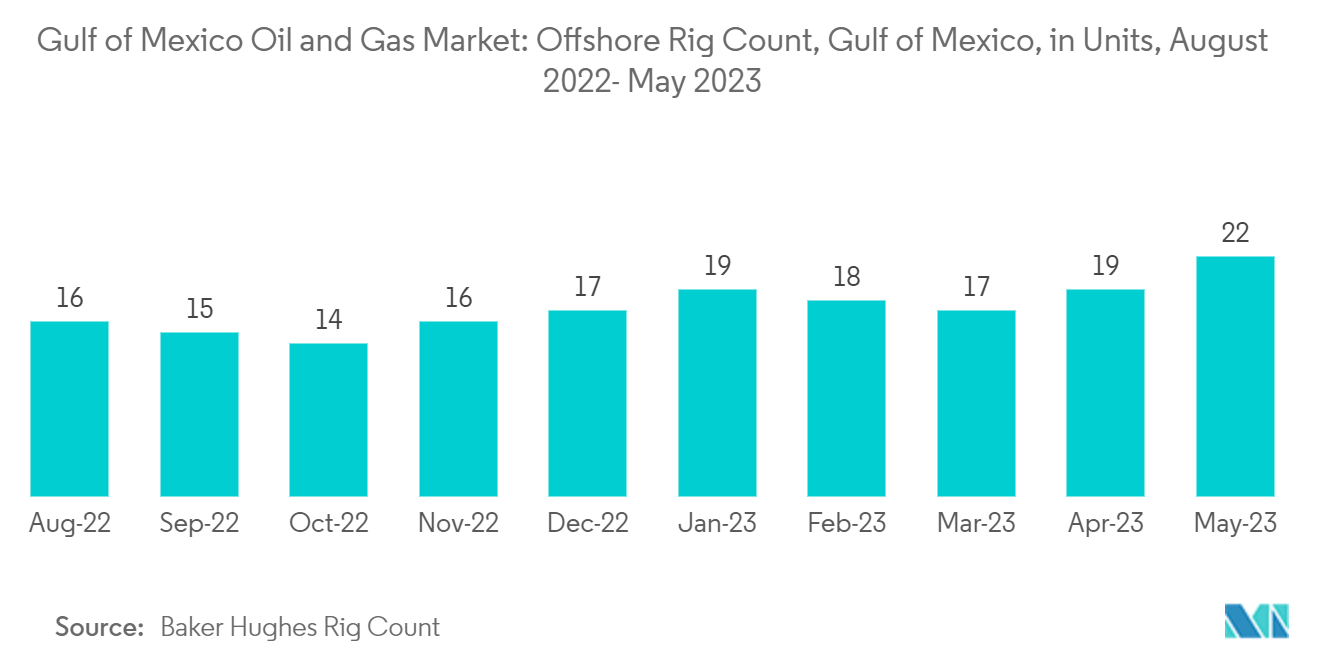
- This growth can be attributed to significant discoveries of oil and gas reserves in both shallow and deepwater areas of the Gulf and advancements in technology for offshore drilling operations. As of May 2023, the number of offshore rigs in the Gulf of Mexico had reached 22, indicating the continued expansion of E&P activities in the region.
- Furthermore, the expansion and exploration activities have led to various regional discoveries, further driving the market. For instance, in January 2023, Talos Energy, a Houston-based company, successfully identified significant oil and natural gas reserves in two deepwater discoveries in the US Gulf of Mexico. The company intends to develop these discoveries by establishing subsea tie-backs to its existing Ram Powell tension-leg platform (TLP).
- Furthermore, as deepwater and ultra-deepwater activities in the Gulf of Mexico continue to rise, production from these fields is anticipated to reach 7.6 million barrels per day in three years and 9 million per day in eighteen years. Consequently, there is an expected surge in demand for subsea production systems, which will further propel the market forward.
- Owing to the above points, the upstream segment is expected to dominate the Gulf of Mexico oil and gas market during the forecast period.
GOM Federal Offshore or the United States PART Expected to Dominate the Market
- The United States has a significant coastline along the Gulf of Mexico, providing direct access to the region's oil and gas reserves. This proximity gives U.S.-based companies a logistical advantage in exploration, production, and transportation activities.
- The United States has an extensive network of pipelines, platforms, and support services already established in the Gulf of Mexico. This infrastructure enables efficient extraction, processing, and distribution of oil and gas resources, contributing to the dominance of the U.S. in the market.
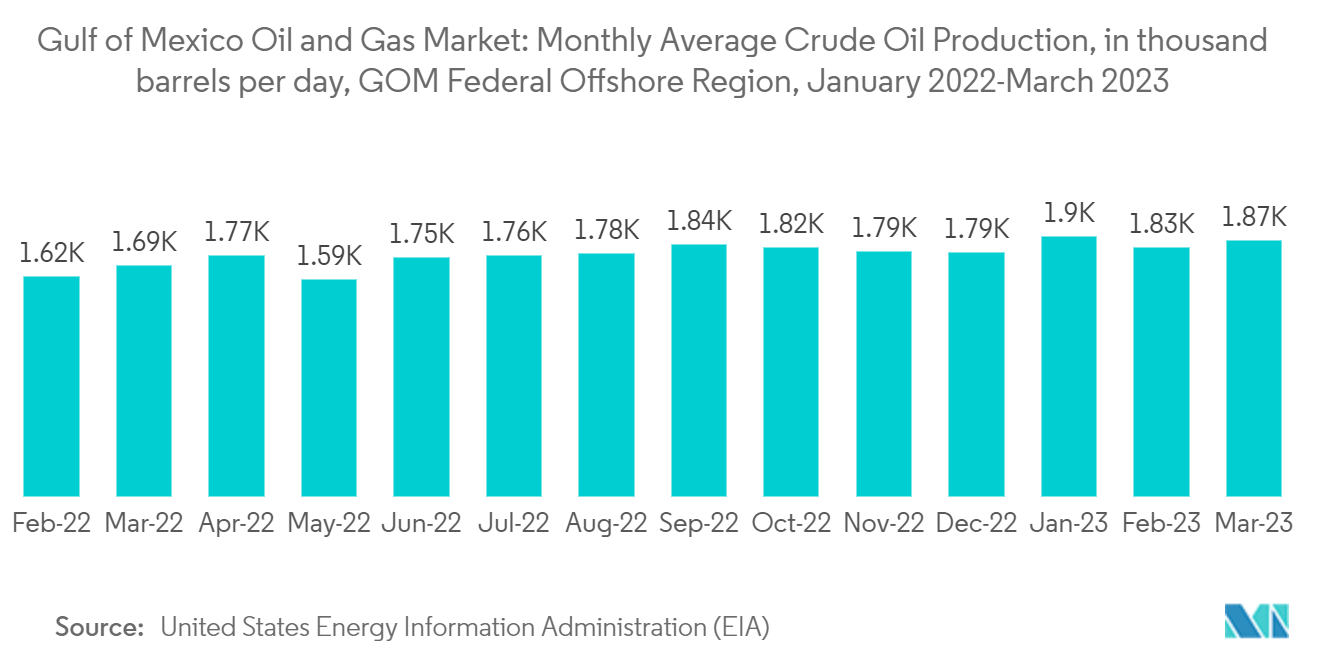
- According to the United States Energy Information Administration (EIA), the GOM Federal Offshore region's average crude oil production reached 1,742 thousand barrels daily in 2022. This figure is anticipated to experience a positive trajectory in the upcoming years, primarily driven by multiple upcoming projects in offshore waters.
- For instance, in April 2023, B.P. announced that it had successfully commenced oil production at its Argos offshore platform, which comes at a crucial moment, bolstering bp's status as a prominent producer in the deepwater region of the U.S. Gulf of Mexico. Argos, bp's fifth platform in the Gulf of Mexico, holds a gross production capacity of up to 140,000 barrels of oil per day. Notably, it is bp's first newly operated production facility in the region since 2008.
- Additionally, in March 2023, Shell Plc, a significant player in the oil industry, approved the development of the Dover offshore oil field in the Gulf of Mexico (GoM). Shell also revealed its intentions to establish the project as a subsea tieback to Shell's Appomattox offshore production platform. The project aims to commence production by the end of 2024, with peak rates estimated to reach 21,000 barrels of oil equivalent per day (boe/d).
- Such developments are expected to accelerate oil and gas production in the GOM Federal Offshore region in the near future.
Regulatory Landscape
In the United States portion of the Gulf of Mexico (Outer Continental Shelf), offshore oil and gas leasing, permitting, and operations are primarily overseen by the Bureau of Ocean Energy Management (BOEM) and the Bureau of Safety and Environmental Enforcement (BSEE) under the OCS regulatory framework (including 30 CFR 250/550/551). In 2026, policy direction referenced by the US Department of the Interior emphasized revisions intended to reduce administrative burden while maintaining environmental and safety compliance, which affects the pace and cost of moving from leases to approved development plans.
The leasing cadence is also being formalized through mandated Gulf of America lease sales under the One Big Beautiful Bill Act, with bi-annual sales in March and August through 2032. BOEM also advanced updates to offshore financial assurance requirements through a notice of proposed rulemaking published in March 2026, and BSEE moved to revise elements of the 2023 Blowout Preventer Systems and Well Control Rule to streamline reporting and recordkeeping requirements for BOP-related compliance.
Value Chain Analysis
The Gulf of Mexico oil and gas value chain is anchored in offshore leasing and permitting (BOEM), safety and operational compliance (BSEE), and upstream project execution led by operators and partners that contract drilling, subsea, and marine logistics services. Upstream activities span exploration, appraisal, development drilling, subsea production systems, and floating production units and hubs, with increasing reliance on high-pressure, high-temperature (HPHT) capabilities as projects move into deeper and more technically demanding reservoirs.
Midstream connectivity is a key enabler, linking new deepwater developments to existing offshore hubs and onshore processing and export networks via oil and gas pipelines. Recent examples highlighting supply-chain and infrastructure linkages include US DOI approval for bp’s Kaskida deepwater project (March 2026) and related offshore pipeline investments, including Enbridge’s sanctioned project to expand oil export and gas gathering capacity to support Kaskida, as well as the Enbridge and Shell Pipeline joint venture (Oceanus Pipeline Company, LLC) to develop new oil and gas pipelines for the Sparta development. Downstream and export pathways include crude and gas processing and delivery to domestic markets and LNG export infrastructure, with offshore-oriented LNG approaches (e.g., Delfin LNG) extending the chain toward liquefaction and marine shipping.
Competitive Landscape
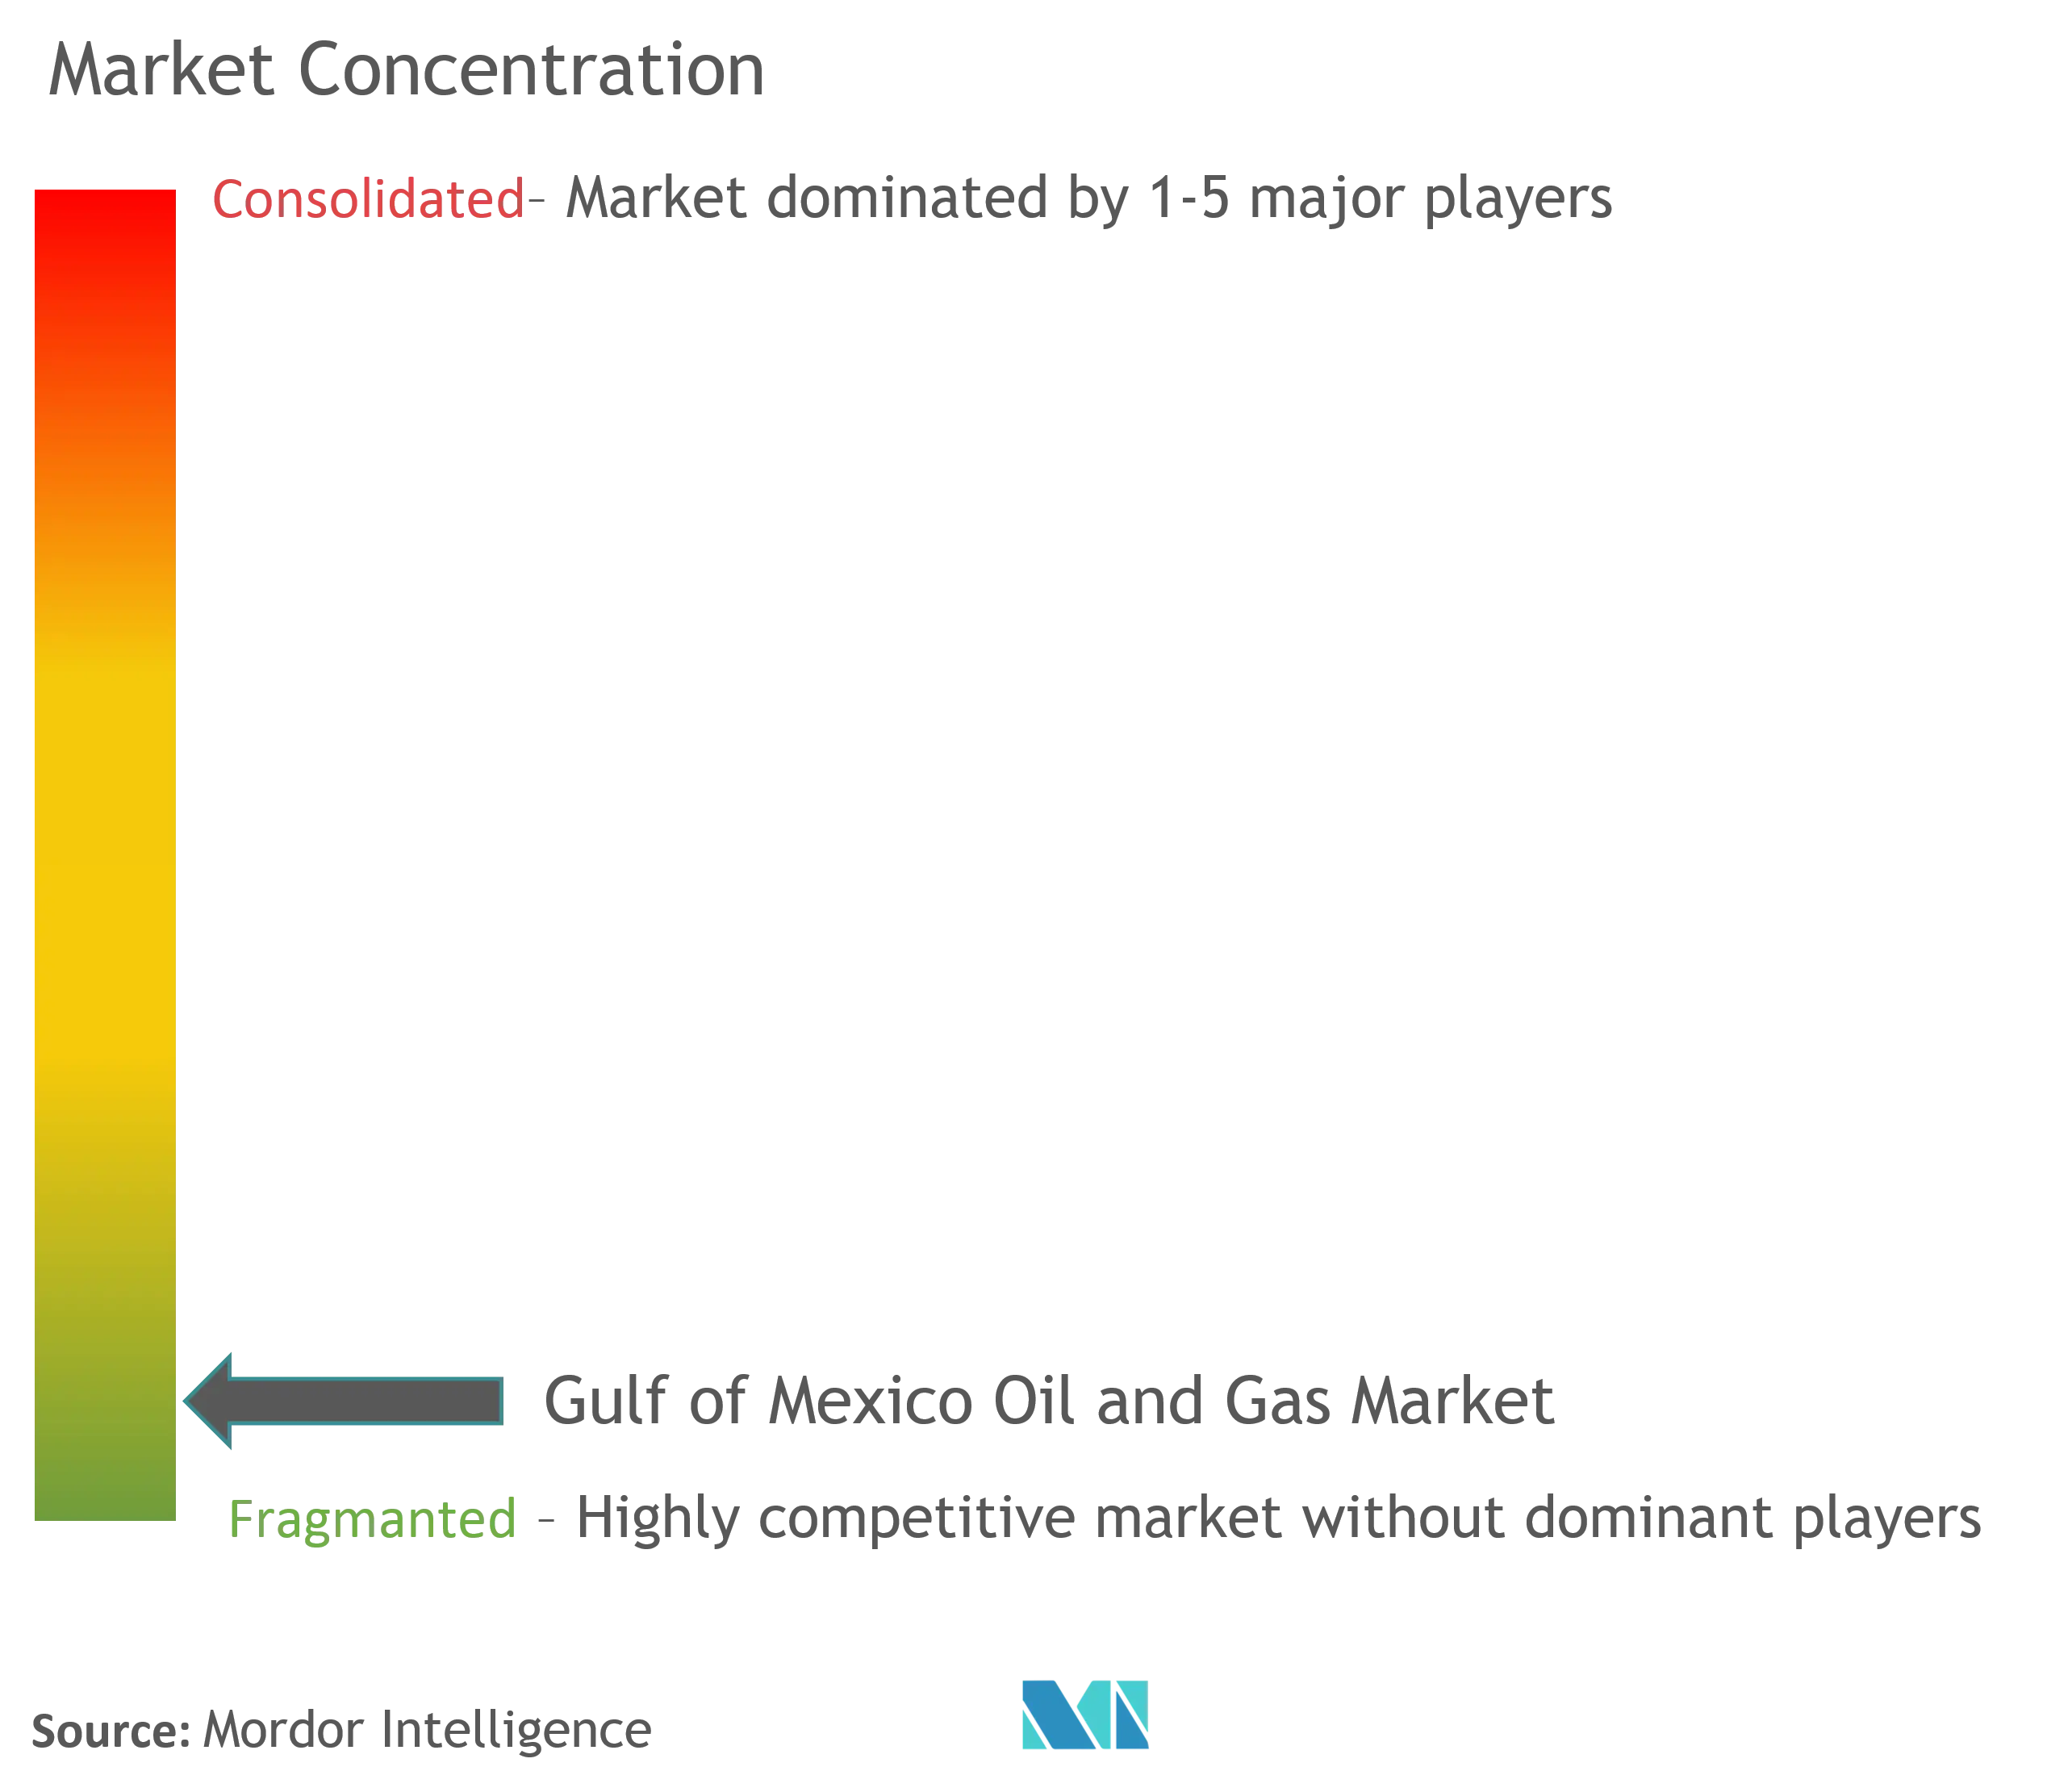
The Gulf of Mexico oil and gas market is fragmented. Some of the key players (in no particular order) include Chevron Corporation, Shell PLC, BP PLC, ExxonMobil Corp., and Delfin LNG LLC, among others.
Gulf Of Mexico Oil and Gas Industry Leaders
-
Chevron Corporation
-
Shell Plc.
-
BP Plc.
-
Exxon Mobil Corp
-
Delfin LNG LLC
- *Disclaimer: Major Players sorted in no particular order
Market Opportunities and Future Outlook
Deepwater project sanctioning and approvals in the US Gulf create near- and medium-term opportunities for subsea production systems, HPHT equipment, drilling services, and tieback engineering that can shorten cycle time to first oil. A key evidence point is the US Department of the Interior approval of bp’s Kaskida deepwater project in March 2026, which uses 20,000 psi technology and supports demand for specialized well design, subsea controls, and high-specification completion and intervention services across the Paleogene trend.
Infrastructure-led opportunities are also tied to pipeline and export buildouts that connect new fields to hubs and monetize associated gas. Enbridge’s sanctioned investment to support Kaskida and the Enbridge-Shell Pipeline joint venture for Sparta highlight the commercial pull for new oil and gas takeaway capacity and brownfield integration work in the Gulf. In gas monetization, Delfin LNG’s move to a final investment decision for an offshore FLNG vessel provides a concrete pathway for incremental midstream services, offshore pipeline utilization, and LNG-related marine logistics linked to Gulf production.
Recent Industry Developments
- July 2026: Delfin Midstream partnered with EIG’s MidOcean Energy to advance its second FLNG vessel, enabling MidOcean to acquire up to a 50% equity interest, and issued a Limited Notice to Proceed to Siemens Energy for long-lead equipment procurement. The step formalizes vendor commitments and financing alignment for additional offshore liquefaction capacity tied to the Gulf, strengthening the project execution path ahead of a targeted FID by year-end 2026.
- April 2025: Chevron announced startup of oil production at the Whale facility in the deepwater US Gulf of Mexico, with Shell Offshore Inc. as operator. Bringing a large new hub online supports regional throughput and creates follow-on pull for subsea tiebacks, maintenance, and offshore logistics services around the producing asset base.
- August 2024: Chevron started production from the Anchor project, described as the first deepwater Gulf of Mexico development to use 20,000 psi pressure technology. The milestone validated ultra-HPHT equipment and operating practices at scale, expanding the addressable set of technically challenging reservoirs for future developments and service demand.
Research Methodology Framework and Report Scope
Market Definition and Coverage
For this study, the Gulf of Mexico oil and gas market is defined as the revenue generated from oil and gas activities across the Gulf region, captured across the upstream, midstream, and downstream value chain, and counted within the defined Gulf geography.
Scope exclusions: Onshore refinery and petrochemical activity outside the Gulf of Mexico geography, along with broader US nationwide energy services not tied to Gulf projects, is not counted.
Segmentation Overview
- Location
- Onshore
- Offshore
- Operations
- Upstream
- Downstream
- Midstream
- Geography Regional Market Analysis {Market Size and Demand Forecast till 2028 (for regions only)}
- GOM Federal Offshore or the United States PART
- Mexico PART
- Cuba PART
Data Sources, Market Sizing, and Validation
Desk Research
Desk research starts with building a clean picture of how much activity is happening in the Gulf and where it sits in the value chain. We referenced public sources such as the US Energy Information Administration (EIA), the Bureau of Ocean Energy Management (BOEM), and the US Bureau of Safety and Environmental Enforcement (BSEE) for production, lease, and offshore operating signals that help anchor the demand pool.
We also used sources such as the US International Trade Commission data, USGS publications where relevant, and peer reviewed technical papers to sanity check typical development patterns and asset behavior. Alongside that, we reviewed company annual reports, investor presentations, and earnings call notes to track project timing and operational changes. For selective cross checks, we used paid subscriptions that support company financials and intelligence, news and financials, and patent databases to clarify ownership changes and technology adoption. These examples are not exhaustive, and many other public and paid sources were also referred to for data collection, validation, and clarification.
Primary Interviews and Surveys
Primary work was used to convert the activity signals into sizing inputs and to pressure test the assumptions behind the model. We spoke with a mix of operators, contractors, equipment and service providers, logistics participants, and domain specialists across the Gulf so the final numbers reflect contracting patterns and project pacing, not only published plans.
Distribution of primary research fieldwork respondents
| Company type | Respondent position |
|---|---|
| Top tier: 31% | CXOs: 15% |
| Mid tier: 54% | Functional/Unit leaders: 40% |
| Smaller Players: 15% | Managers: 45% |
Market-Sizing & Forecasting
Sizing starts with a top-down build where production and investment signals are translated into revenue pools for Gulf activities, then split across the value chain based on how spending typically lands in upstream, midstream, and downstream work. To keep totals realistic, the outputs are cross checked with selective bottom-up approximations, such as sampled project economics, a few supplier revenue roll-ups, and simple volume times price checks in parts of the chain where public data is clearer.
Key inputs we track include offshore crude and gas production levels, active lease and development pipeline visibility, project sanction timing, drilling and completion activity direction, and commodity price assumptions that shape operator budgets. We also monitor utilization type indicators, such as how tight services and offshore logistics feel in the field, because this affects realized pricing and the pace of work. For forecasting, scenario analysis is used so the model can reflect different oil price and project timing outcomes, and the scenarios are filtered through what interviewees view as the most likely development path.
Data Validation & Update Cycle
Validation is done through several checks that are easy to repeat and explain. We compare the model outputs against independent signals such as published production series, offshore project milestones, and visible lease and permitting activity, then investigate any sharp variances before sign-off.
A second analyst review is completed to confirm that assumptions, conversions, and year-on-year movements are consistent, and any unusual changes trigger follow-up outreach to clarify what moved. Reports are refreshed annually, with interim updates when material events occur, and a final pre-delivery pass is done so clients receive the most current view available at that time.
Mordor Intelligence's Gulf of Mexico Oil and Gas Market Size Compared With Other Published Estimates
Published values for the Gulf of Mexico oil and gas market often differ because the cut of geography and the value chain scope are not aligned, and because the math behind pricing and activity timing is not always shown clearly. We keep the model traceable to real demand signals, and we avoid mixing Gulf project economics with wider US energy spending.
Some published figures fold in a broader Gulf Coast downstream and processing footprint, and that alone can lift the total significantly. In Mordor Intelligence, the number is limited to revenues tied to Gulf of Mexico activity across the defined upstream, midstream, and downstream chain, and it is filtered through project timing checks and basic price-consistency tests so one year does not get overstated due to temporary price spikes.
Benchmark comparison
| Source | Market Size | Gaps in Research Methodology |
|---|---|---|
| Mordor Intelligence | USD 22.56 B (2023) | |
| Industry Publisher A | USD 68.40 B (2026) | Uses a later start year and appears to include a wider Gulf Coast value chain footprint (refining and processing linked to the region), which inflates totals versus activity tied directly to Gulf projects. |
| Global Consultancy B | USD 22.67 B (2024) | Focused on upstream only, so the total can look close in some years but it excludes midstream and downstream revenue pools that are counted in a full value chain view. |
The spread in the table mainly comes from what gets counted and when it gets counted, not only from the growth rate. By keeping the scope tied to Gulf activity and using clear activity and pricing inputs that can be rechecked each year, our estimate stays easier to reconcile against production, project timing, and spend signals.
Key Questions Answered in the Report
What is the current Gulf Of Mexico Oil And Gas Market size?
The Gulf Of Mexico Oil And Gas Market is projected to register a CAGR of 2.64% during the forecast period (2026-2031)
Who are the key players in Gulf Of Mexico Oil And Gas Market?
Chevron Corporation, Shell Plc., BP Plc., Exxon Mobil Corp and Delfin LNG LLC are the major companies operating in the Gulf Of Mexico Oil And Gas Market.
What years does this Gulf Of Mexico Oil And Gas Market cover?
The report covers the Gulf Of Mexico Oil And Gas Market historical market size for years: 2020, 2021, 2022, 2023 and 2024. The report also forecasts the Gulf Of Mexico Oil And Gas Market size for years: 2026, 2027, 2028, 2029, 2030 and 2031.